
Exhibit 99.1 amerantbank.com Strategic Capital Raise September 2024
Important Notices and Disclaimers Forward-Looking Statements This presentation contains “forw-ard looking statements” including statements with respect Atmo eran thet Bancorp Inc.’s (the “Company’s”) objectives, expectations and intentions and other statements that are not historical facts. All statements other than statements of historical fact are statements that could be forward-looking statements. Forward-looking statements include statements relating to the potential securities offering, which is opportunistic and subject to market conditions, the Company’s preliminary estimated third anqu cart ial e inr form 202 at4 io nfin and expectations, the expected use of proceeds from the proposed offering (including any repositioning of the Company’s securities portfolio and other actions described herein), and th ue re C buom sinp ean ss oy’s f perat utions and strategy. You can identify these forward-looking statements through our use of words such as “may,” “balance sheet optimization efforts, “will,” “anticipate,” “assumceat,” e,”“sh “w ouou ld,”ld “in ,” “bdielieve,” “contemplate,” “expect,” “estimate,” “continue,” “point to,” “project,” “could,” “intend,” “target,” “goals,” “outlooks,” “modeled,” “dedicated,” “anticipate,” “create,” “preliminary,” mil anar d ot worhdesr ansid expressions of the future. Forward-looking statements, including those relating to our beliefs, plans, objectives, goals, expectations, anticipations, estimates and intentions, involve risks, uncertainties and other factors, which may be beyond our control, and which may cause the Company’s actual results, performance, achievements, or financial condition ditfo ferebe n m t from ate frial utluyre results, performance, achievements, or financial condition expressed or implied by such forward-looking statements. You should not rely on any forward-looking statements as predictions of future events. You should not expect us to update any forward-looking statements, except as required by law. All written or oral forward-looking statements attributable to us are expressly qualified in their entirety by this cautionary notice, together with those risks and uncertainties described in “Risk factors” in our annual report on Form 10-K for the fiscal year ended December 31, 2023 filed on March 7, 2024 (the Form 10-K ), our quarterly report on Form 10-Q (including our quarterly report on Form 10-Q filed on August 2, 2024), and in our other filings with the U.S. Securities and Exchange Commission (the “SEC”), which are a s wva eil bab sitele a wwt wt.h seec S .gov EC .’ Non-GAAP Financial Measures The Company supplements its financial results that are determined in accordance with accounting principles generally accepted in the United States of America (“GAAP”) w-ith GA An P on financial measures, such as tangible common equity ( TCE ), tangible assets (“TA”) and C -Prov oreision Pre Net Revenue (“Core PPNR ). This supplementmalat ioinnfor is not required by or is not presented in accordance with GAAP. The Company refers to these financial measures and ratios a -Gs AA“P nonfinancial measures” and they should not be considered in as isol a at suio bn stit or ute for the GAAP measures presented herein. We use certain non-GAAP financial measures, including those mentioned above, both to explain our results to shareholders and the investment community and in the internal evaluation and management of our businesses. Our management believes that these non-GAAP financial measures and the information they provide are useful to investors since these measures permit investors to view our performance using the same tools that our management uses to evaluate our past performance and prospects for future performance. While we believe that these non-GAAP financial measures are useful in evaluating our performance, this information should be considered as supplemental and not as a substitute for or superior to the related financial information prepared in accordance with GAAP. Additionally, these non-GAAP financial measures may differ from similar measures presented by other companies. Page 20 in the appendix reconciles these non-GAAP financial measures to reported GAAP results. Amerant does not provide a reconciliation of certain forward-looking non-GAAP financial measures and projections to their most directly comparable GAAP financial measures because Amerant is unable to provide, without unreasonable effort, a meaningful or accurate calculation or estimation of amounts that would be necessary for the reconciliation due to the complexity and inherent difficulty in forecasting and quantifying future amounts or when they may occur. Such unavailable information could be significant to future results. 2
Important Notices and Disclaimers (continued) Preliminary Financial Information This presentation includes certain preliminary unaudited financial information and expectations relating to the third quarter of 2024. Our third quarter of 2024 has not yet concluded and such results are preliminary estimates based upon currently available information. In the opinion of management, such unaudited financial information includes all adjustments (consisting of normal recurring adjustments) necessary for a fair presentation of our financial position and results of operations for such periods, but may not include normal quarter-end adjustments. These results are also subject to further revision based upon final actual results for the entire quarter ending September 30, 2024, our review and the review of our independent auditors of such quarterly results and an audit by our independent auditors of our annual results for the year ended December 31, 2024. Therefore, no assurance can be given that, upon completion of our review and the review of our independent auditors, we will not report materially different financial results than those set forth below. We cannot assure you that such results will be indicative of our results for the entire quarter ending September 30, 2024 or for the entire year ending December 31, 2024. Further, although this presentation describes the current estimated impact of our potential use of a portion of the proceeds from this offering (including in connection with our future balance sheet optimization efforts, potential securities portfolio repositioning, and other actions described herein) any such actions will depend on a number of factors, including market conditions and business developments. We are not required to apply any portion of the net proceeds of this offering for any particular purpose, and our management will have broad discretion in allocating the net proceeds of the offering. Accordingly, our management may not apply the net proceeds of this offering toward the repositioning of our securities portfolio, and our future financial condition may differ significantly from the prospective estimates presented in this presentation. We do not intend to update or otherwise revise these expected events and estimates to reflect future events or changes in estimates and do not intend to disclose publicly whether our actual results will vary from our estimates other than through the release of actual results in the ordinary course of business. No independent public accounting firm has compiled, examined or performed any procedures with respect to the anticipated financial information contained above, nor have they expressed any opinion or other form of assurance on such information or its achievability. These estimates should not be regarded as a representation by us, our management or the underwriters as to our actual results for the third quarter. The assumptions and estimates underlying the estimated financial information are inherently uncertain and are subject to a wide variety of significant business, economic and competitive risks and uncertainties, including those described under “Risk Fa autc ion tors ary N ” aote nd “ RC egarding Forward-Looking Statements” in our SEC filings. Accordingly, you should not place undue reliance on these estimates. In addition, the repositioning of our balance sheet as described in this presentation is subject to and contingent upon the completion of this offering during the third quarter of 2024 on terms that are satisfactory to us. Although we may consider proceeding with the rebalancing in the event that this offering does not close on acceptable terms during the third quarter of 2024, we have not yet determined to do so. The repositioning will only occur, if at all, following our receipt of adequate capital. Additional Information This presentation shall not constitute an offer to sell or the solicitation of an offer to buy, nor shall there be any sale of common stock in any state or jurisdiction in which such offer, solicitation or sale would be unlawful prior to the registration or qualification under the securities laws of such state or jurisdiction. Neither the SEC nor any other regulatory body has approved or disapproved of the securities of the Company or passed upon the accuracy or adequacy of this presentation. Any representation to the contrary is a criminal offense. The offering of the shares will be made pursuant to an effective registration statement (including a base prospectus) filed by the Company with the SEC and a preliminary prospectus supplement, which the Company intends to file with the SEC. Before you invest, you should read the registration statement (including the base prospectus) and the preliminary prospectus supplement relating to the offering and the documents incorporated by reference therein and any other documents that the Company has filed with the SEC for more information about the Company and the offering. You may obtain these documents for free by visiting the SEC’s website at www.sec.gov. Alternatively, you may request copies of the base prospectus and preliminary prosp ent bey ctcuon s tsu acp tinplg S emtephens Inc. by telephone at (800) 643-9691 or by email at prospectus@stephens.com, and by contacting Piper Sandler & Co. by telephone at (800) 747-3924 or by email at prospectus@psc.com. 3
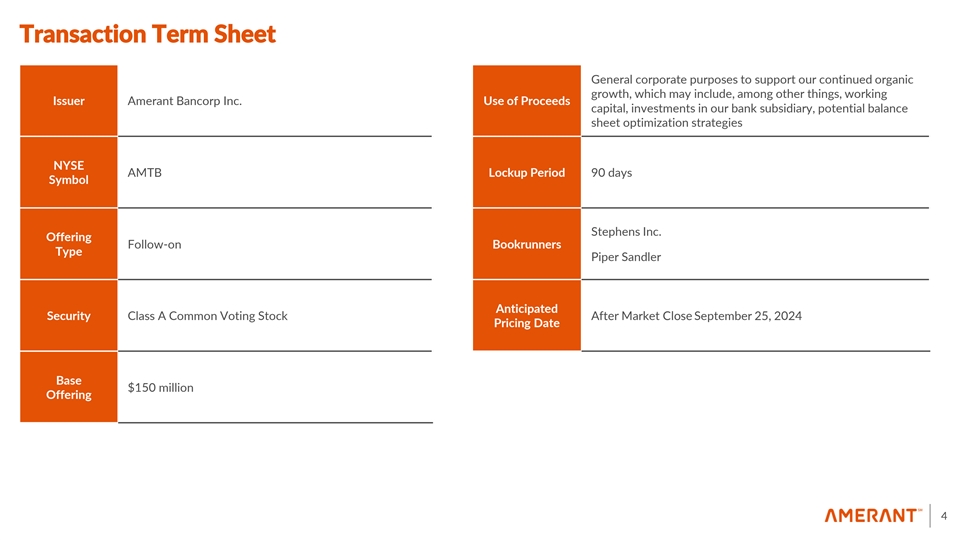
Transaction Term Sheet General corporate purposes to support our continued organic growth, which may include, among other things, working Issuer Amerant Bancorp Inc. Use of Proceeds capital, investments in our bank subsidiary, potential balance sheet optimization strategies NYSE AMTB Lockup Period 90 days Symbol Stephens Inc. Offering Follow-on Bookrunners Type Piper Sandler Anticipated Security Class A Common Voting Stock After Market Close September 25, 2024 Pricing Date Base $150 million Offering 4
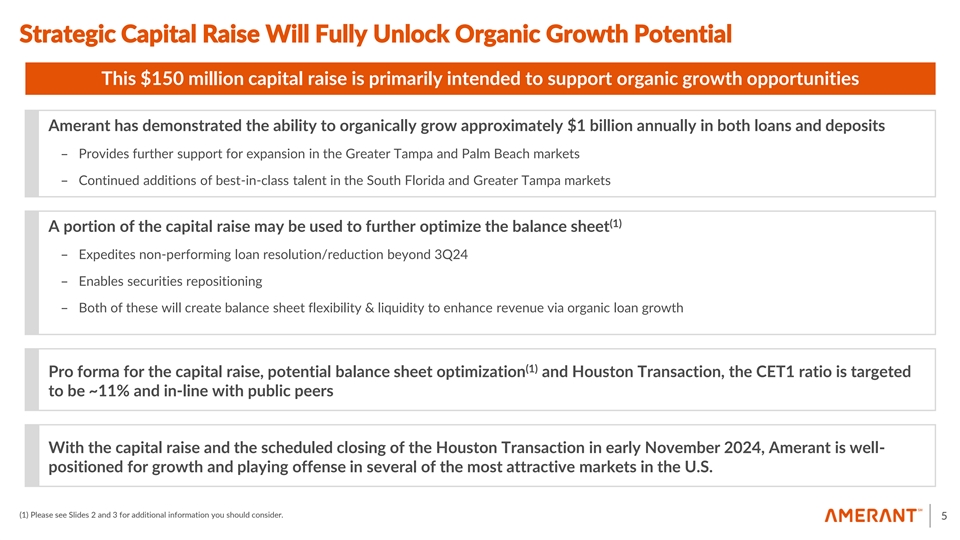
Strategic Capital Raise Will Fully Unlock Organic Growth Potential This $150 million capital raise is primarily intended to support organic growth opportunities Amerant has demonstrated the ability to organically grow approximately $1 billion annually in both loans and deposits - Provides further support for expansion in the Greater Tampa and Palm Beach markets - Continued additions of best-in-class talent in the South Florida and Greater Tampa markets (1) A portion of the capital raise may be used to further optimize the balance sheet - Expedites non-performing loan resolution/reduction beyond 3Q24 - Enables securities repositioning - Both of these will create balance sheet flexibility & liquidity to enhance revenue via organic loan growth (1) Pro forma for the capital raise, potential balance sheet optimization and Houston Transaction, the CET1 ratio is targeted to be ~11% and in-line with public peers With the capital raise and the scheduled closing of the Houston Transaction in early November 2024, Amerant is well- positioned for growth and playing offense in several of the most attractive markets in the U.S. (1) Please see Slides 2 and 3 for additional information you should consider. 5
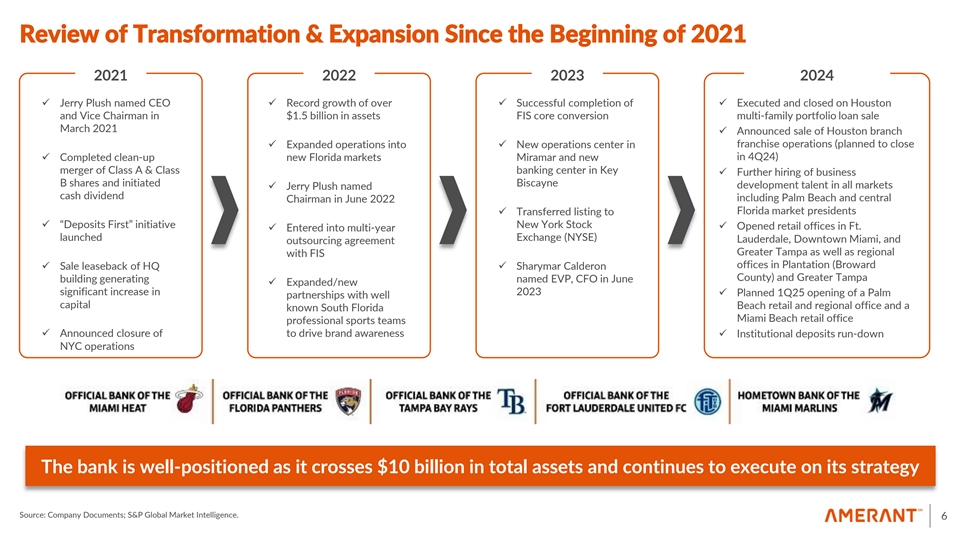
Review of Transformation & Expansion Since the Beginning of 2021 2021 2022 2023 2024 ✓ Jerry Plush named CEO ✓ Record growth of over ✓ Successful completion of ✓ Executed and closed on Houston and Vice Chairman in $1.5 billion in assets FIS core conversion multi-family portfolio loan sale March 2021 ✓ Announced sale of Houston branch ✓ Expanded operations into ✓ New operations center in franchise operations (planned to close in 4Q24) ✓ Completed clean-up new Florida markets Miramar and new merger of Class A & Class banking center in Key ✓ Further hiring of business B shares and initiated Biscayne development talent in all markets ✓ Jerry Plush named cash dividend including Palm Beach and central Chairman in June 2022 Florida market presidents ✓ Transferred listing to ✓ “Deposits First” initiative New York Stock ✓ Opened retail offices in Ft. ✓ Entered into multi-year launched Exchange (NYSE) Lauderdale, Downtown Miami, and outsourcing agreement Greater Tampa as well as regional with FIS offices in Plantation (Broward ✓ Sale leaseback of HQ ✓ Sharymar Calderon County) and Greater Tampa building generating named EVP, CFO in June ✓ Expanded/new significant increase in 2023✓ Planned 1Q25 opening of a Palm partnerships with well capital Beach retail and regional office and a known South Florida Miami Beach retail office professional sports teams ✓ Announced closure of to drive brand awareness ✓ Institutional deposits run-down NYC operations The bank is well-positioned as it crosses $10 billion in total assets and continues to execute on its strategy Source: Company Documents; S&P Global Market Intelligence. 6
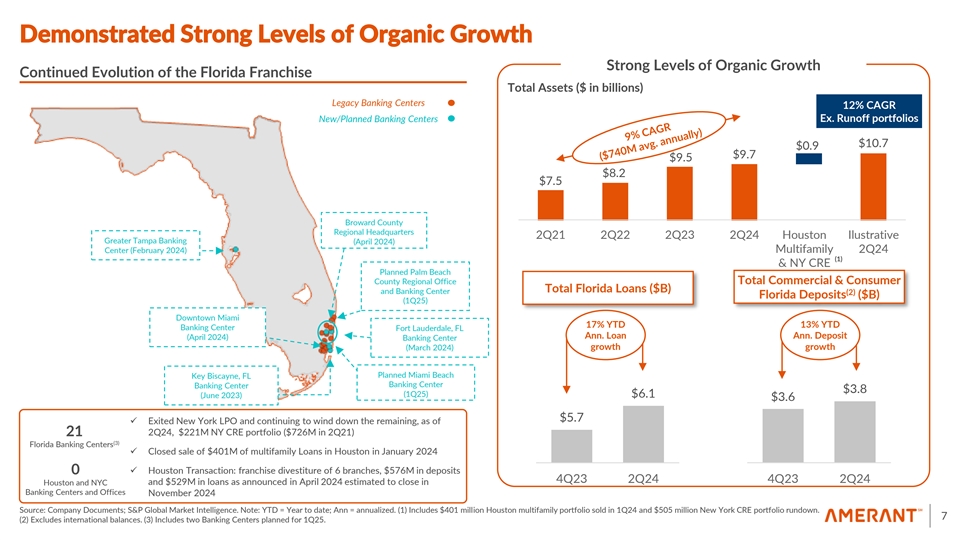
Demonstrated Strong Levels of Organic Growth Strong Levels of Organic Growth Continued Evolution of the Florida Franchise Total Assets ($ in billions) Legacy Banking Centers 12% CAGR New/Planned Banking Centers Ex. Runoff portfolios $10.7 $0.9 $9.7 $9.5 $8.2 $7.5 Broward County Regional Headquarters 2Q21 2Q22 2Q23 2Q24 Houston Ilustrative Greater Tampa Banking (April 2024) Center (February 2024) Multifamily 2Q24 (1) & NY CRE Planned Palm Beach County Regional Office Total Commercial & Consumer Total Florida Loans ($B) and Banking Center (2) Florida Deposits ($B) (1Q25) Downtown Miami 17% YTD 13% YTD Banking Center Fort Lauderdale, FL Ann. Loan Ann. Deposit (April 2024) Banking Center (March 2024) growth growth Planned Miami Beach Key Biscayne, FL Banking Center Banking Center $3.8 (1Q25) $6.1 (June 2023) $3.6 $5.7 ✓ Exited New York LPO and continuing to wind down the remaining, as of 21 2Q24, $221M NY CRE portfolio ($726M in 2Q21) (3) Florida Banking Centers ✓ Closed sale of $401M of multifamily Loans in Houston in January 2024 0✓ Houston Transaction: franchise divestiture of 6 branches, $576M in deposits 4Q23 2Q24 4Q23 2Q24 Houston and NYC and $529M in loans as announced in April 2024 estimated to close in Banking Centers and Offices November 2024 Source: Company Documents; S&P Global Market Intelligence. Note: YTD = Year to date; Ann = annualized. (1) Includes $401 million Houston multifamily portfolio sold in 1Q24 and $505 million New York CRE portfolio rundown. 7 (2) Excludes international balances. (3) Includes two Banking Centers planned for 1Q25.
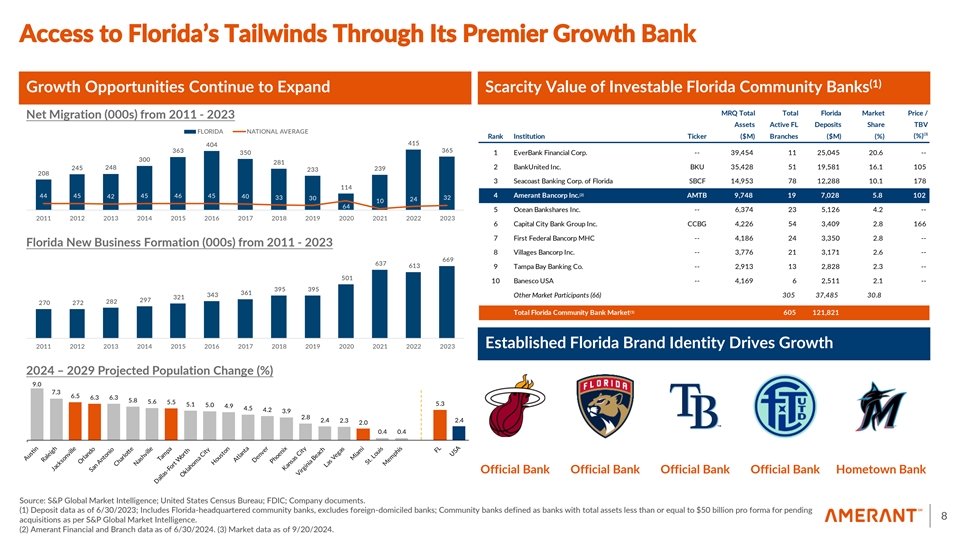
Access to Florida’s Tailwinds Through Its Premier Growth Bank (1) Growth Opportunities Continue to Expand Scarcity Value of Investable Florida Community Banks MRQ Total Total Florida Market Price / Net Migration (000s) from 2011 - 2023 Assets Active FL Deposits Share TBV FL RIDA NATI NAL A ERAGE (3) Rank Institution Ticker ($M) Branches ($M) (%) (%) 4 404 0 1 EverBank Financial Corp. -- 39,454 11 25,045 20.6 -- 00 2 2 BankUnited Inc. BKU 35,428 51 19,581 16.1 105 24 24 2 2 20 3 Seacoast Banking Corp. of Florida SBCF 14,953 78 12,288 10.1 178 4 (2) 44 4 42 4 4 4 40 4 Amerant Bancorp Inc. AMTB 9,748 19 7,028 5.8 102 0 2 24 0 4 5 Ocean Bankshares Inc. -- 6,374 23 5,126 4.2 -- 20 20 2 20 20 4 20 20 20 20 20 2020 202 2022 202 6 Capital City Bank Group Inc. CCBG 4,226 54 3,409 2.8 166 7 First Federal Bancorp MHC -- 4,186 24 3,350 2.8 -- Florida New Business Formation (000s) from 2011 - 2023 8 Villages Bancorp Inc. -- 3,776 21 3,171 2.6 -- 9 Tampa Bay Banking Co. -- 2,913 13 2,828 2.3 -- 0 10 Banesco USA -- 4,169 6 2,511 2.1 -- 4 Other Market Participants (66) 305 37,485 30.8 2 2 2 2 2 0 2 2 (1) Total Florida Community Bank Market 605 121,821 Established Florida Brand Identity Drives Growth 20 20 2 20 20 4 20 20 20 20 20 2020 202 2022 202 2024 – 2029 Projected Population Change (%) .0 . . . . . . . . . .0 4. 4. 4.2 . 2. 2.4 2. 2.4 2.0 0.4 0.4 Official Bank Official Bank Official Bank Official Bank Hometown Bank Source: S&P Global Market Intelligence; United States Census Bureau; FDIC; Company documents. (1) Deposit data as of 6/30/2023; Includes Florida-headquartered community banks, excludes foreign-domiciled banks; Community banks defined as banks with total assets less than or equal to $50 billion pro forma for pending 8 acquisitions as per S&P Global Market Intelligence. (2) Amerant Financial and Branch data as of 6/30/2024. (3) Market data as of 9/20/2024.
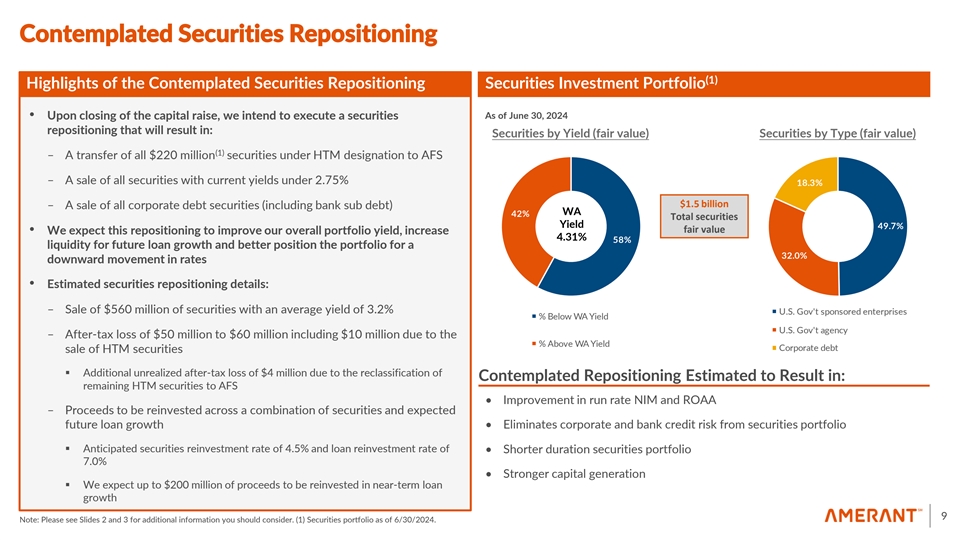
Contemplated Securities Repositioning (1) Highlights of the Contemplated Securities Repositioning Securities Investment Portfolio As of June 30, 2024 • Upon closing of the capital raise, we intend to execute a securities repositioning that will result in: Securities by Yield (fair value) Securities by Type (fair value) (1) – A transfer of all $220 million securities under HTM designation to AFS – A sale of all securities with current yields under 2.75% $1.5 billion – A sale of all corporate debt securities (including bank sub debt) WA Total securities Yield fair value • We expect this repositioning to improve our overall portfolio yield, increase 4.31% liquidity for future loan growth and better position the portfolio for a downward movement in rates • Estimated securities repositioning details: – Sale of $560 million of securities with an average yield of 3.2% U.S. Gov t sponsored enterprises Below A ield U.S. Gov t agency – After-tax loss of $50 million to $60 million including $10 million due to the Above A ield Corporate debt sale of HTM securities ▪ Additional unrealized after-tax loss of $4 million due to the reclassification of Contemplated Repositioning Estimated to Result in: remaining HTM securities to AFS • Improvement in run rate NIM and ROAA – Proceeds to be reinvested across a combination of securities and expected future loan growth • Eliminates corporate and bank credit risk from securities portfolio ▪ Anticipated securities reinvestment rate of 4.5% and loan reinvestment rate of • Shorter duration securities portfolio 7.0% • Stronger capital generation ▪ We expect up to $200 million of proceeds to be reinvested in near-term loan growth 9 Note: Please see Slides 2 and 3 for additional information you should consider. (1) Securities portfolio as of 6/30/2024.
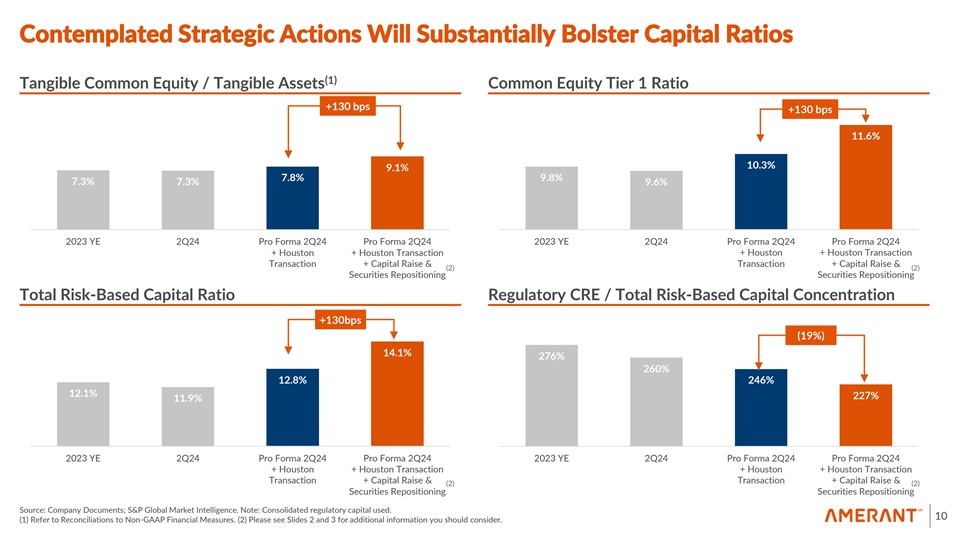
Contemplated Strategic Actions Will Substantially Bolster Capital Ratios (1) Tangible Common Equity / Tangible Assets Common Equity Tier 1 Ratio +130 bps +130 bps 11.6% 10.3% 9.1% 7.8% 9.8% 7.3% 7.3% 9.6% 2023 YE 2Q24 Pro Forma 2Q24 Pro Forma 2Q24 2023 YE 2Q24 Pro Forma 2Q24 Pro Forma 2Q24 + Houston + Houston Transaction + Houston + Houston Transaction Transaction + Capital Raise & Transaction + Capital Raise & (2) (2) Securities Repositioning Securities Repositioning Total Risk-Based Capital Ratio Regulatory CRE / Total Risk-Based Capital Concentration +130bps (19%) 14.1% 276% 260% 12.8% 246% 12.1% 227% 11.9% 2023 YE 2Q24 Pro Forma 2Q24 Pro Forma 2Q24 2023 YE 2Q24 Pro Forma 2Q24 Pro Forma 2Q24 + Houston + Houston Transaction + Houston + Houston Transaction Transaction + Capital Raise & Transaction + Capital Raise & (2) (2) Securities Repositioning Securities Repositioning Source: Company Documents; S&P Global Market Intelligence. Note: Consolidated regulatory capital used. 10 (1) Refer to Reconciliations to Non-GAAP Financial Measures. (2) Please see Slides 2 and 3 for additional information you should consider.
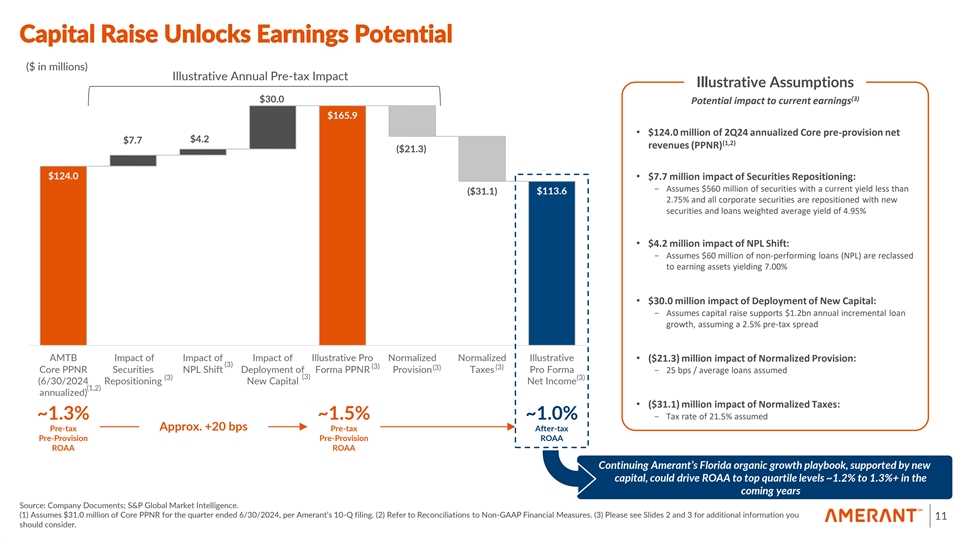
Capital Raise Unlocks Earnings Potential ($ in millions) Illustrative Annual Pre-tax Impact Illustrative Assumptions (3) $30.0 Potential impact to current earnings $165.9 • $124.0 million of 2Q24 annualized Core pre-provision net $4.2 $7.7 (1,2) revenues (PPNR) ($21.3) $124.0• $7.7 million impact of Securities Repositioning: - Assumes $560 million of securities with a current yield less than ($31.1) $113.6 2.75% and all corporate securities are repositioned with new securities and loans weighted average yield of 4.95% • $4.2 million impact of NPL Shift: - Assumes $60 million of non-performing loans (NPL) are reclassed to earning assets yielding 7.00% • $30.0 million impact of Deployment of New Capital: - Assumes capital raise supports $1.2bn annual incremental loan growth, assuming a 2.5% pre-tax spread AMTB Impact of Impact of Impact of Illustrative Pro Normalized Normalized Illustrative• ($21.3) million impact of Normalized Provision: (3) (3) (3) (3) Core PPNR Securities NPL Shift Deployment of Forma PPNR Provision Taxes Pro Forma - 25 bps / average loans assumed (3) (3) (3) (6/30/2024 Repositioning New Capital Net Income (1,2) annualized) • ($31.1) million impact of Normalized Taxes: ~1.3% ~1.5% ~1.0% - Tax rate of 21.5% assumed Approx. +20 bps Pre-tax Pre-tax After-tax Pre-Provision Pre-Provision ROAA ROAA ROAA Continuing Amerant’s Florida organic growth playbook, supported by new capital, could drive ROAA to top quartile levels ~1.2% to 1.3%+ in the coming years Source: Company Documents; S&P Global Market Intelligence. ( ) Assumes $ .0 million of Core PPNR for the quarter ended / 0/2024, -pe Q rf iling. Am e (2) ran Rt’ esf er 0 to Reconciliations to Non-GAAP Financial Measures. (3) Please see Slides 2 and 3 for additional information you 11 should consider.
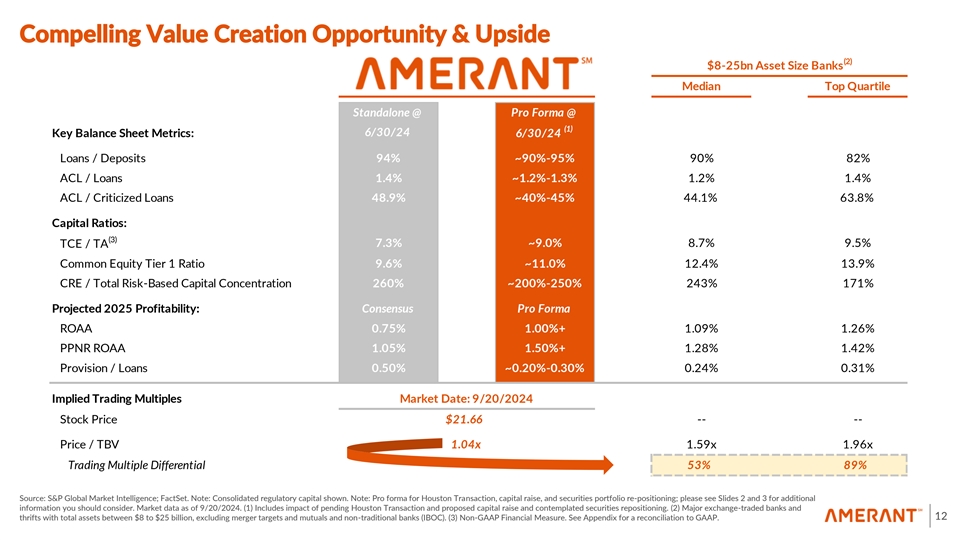
Compelling Value Creation Opportunity & Upside (2) $8-25bn Asset Size Banks Median Top Quartile Standalone @ Pro Forma @ (1) 6/30/24 Key Balance Sheet Metrics: 6/30/24 Loans / Deposits 94% ~90%-95% 90% 82% ACL / Loans 1.4% ~1.2%-1.3% 1.2% 1.4% ACL / Criticized Loans 48.9% ~40%-45% 44.1% 63.8% Capital Ratios: (3) 7.3% ~9.0% 8.7% 9.5% TCE / TA Common Equity Tier 1 Ratio 9.6% ~11.0% 12.4% 13.9% CRE / Total Risk-Based Capital Concentration 260% ~200%-250% 243% 171% Projected 2025 Profitability: Consensus Pro Forma ROAA 0.75% 1.00%+ 1.09% 1.26% PPNR ROAA 1.05% 1.50%+ 1.28% 1.42% Provision / Loans 0.50% ~0.20%-0.30% 0.24% 0.31% Implied Trading Multiples Market Date: 9/20/2024 Stock Price $21.66 -- -- Price / TBV 1.04x 1.59x 1.96x Trading Multiple Differential 53% 89% Source: S&P Global Market Intelligence; FactSet. Note: Consolidated regulatory capital shown. Note: Pro forma for Houston Transaction, capital raise, and securities portfolio re-positioning; please see Slides 2 and 3 for additional information you should consider. Market data as of 9/20/2024. (1) Includes impact of pending Houston Transaction and proposed capital raise and contemplated securities repositioning. (2) Major exchange-traded banks and thrifts with total assets between $8 to $25 billion, excluding merger targets and mutuals and non-traditional banks (IBOC). (3) Non-GAAP Financial Measure. See Appendix for a reconciliation to GAAP. 12
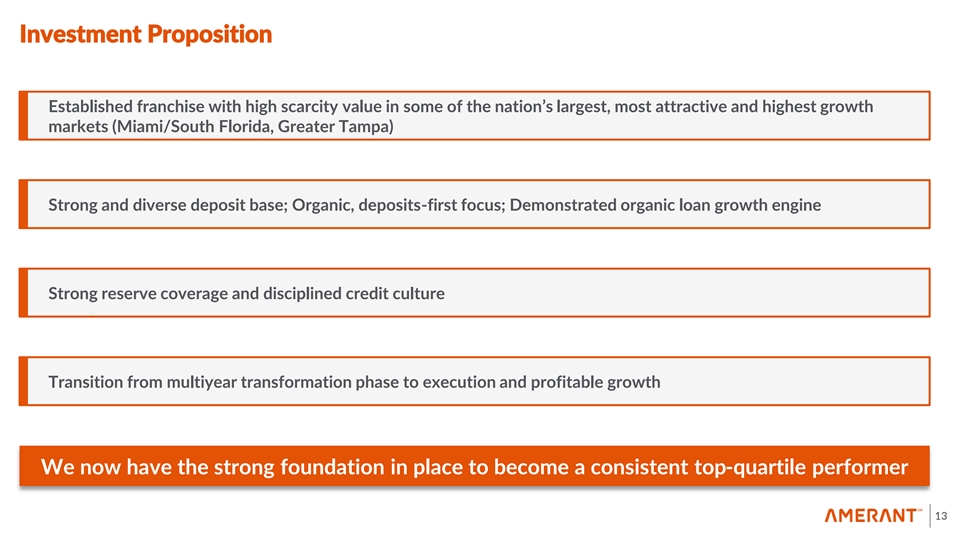
Investment Proposition Established franchise with high scarcity value in some of the nation’s largest, most attractive and highest growth markets (Miami/South Florida, Greater Tampa) Strong and diverse deposit base; Organic, deposits-first focus; Demonstrated organic loan growth engine Strong reserve coverage and disciplined credit culture Transition from multiyear transformation phase to execution and profitable growth We now have the strong foundation in place to become a consistent top-quartile performer 13

3Q24 Projected Financials 14
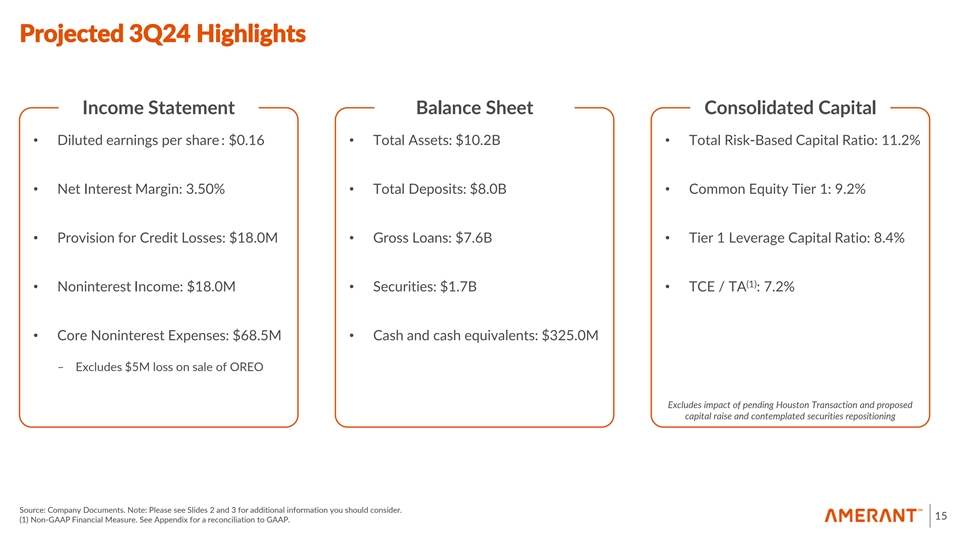
Projected 3Q24 Highlights Income Statement Balance Sheet Consolidated Capital • Diluted earnings per share : $0.16• Total Assets: $10.2B• Total Risk-Based Capital Ratio: 11.2% • Net Interest Margin: 3.50%• Total Deposits: $8.0B• Common Equity Tier 1: 9.2% • Provision for Credit Losses: $18.0M• Gross Loans: $7.6B• Tier 1 Leverage Capital Ratio: 8.4% (1) • Noninterest Income: $18.0M• Securities: $1.7B• TCE / TA : 7.2% • Core Noninterest Expenses: $68.5M• Cash and cash equivalents: $325.0M – Excludes $5M loss on sale of OREO Excludes impact of pending Houston Transaction and proposed capital raise and contemplated securities repositioning Source: Company Documents. Note: Please see Slides 2 and 3 for additional information you should consider. 15 (1) Non-GAAP Financial Measure. See Appendix for a reconciliation to GAAP.
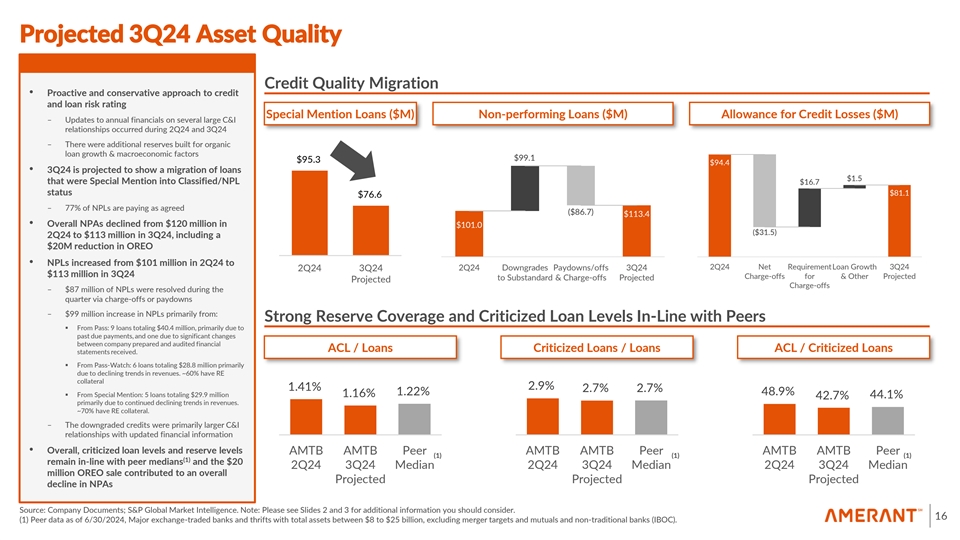
Projected 3Q24 Asset Quality Credit Quality Migration • Proactive and conservative approach to credit and loan risk rating Special Mention Loans ($M) Non-performing Loans ($M) Allowance for Credit Losses ($M) – Updates to annual financials on several large C&I relationships occurred during 2Q24 and 3Q24 – There were additional reserves built for organic loan growth & macroeconomic factors $99.1 $95.3 $94.4 • 3Q24 is projected to show a migration of loans $1.5 that were Special Mention into Classified/NPL $16.7 status $81.1 $76.6 – 77% of NPLs are paying as agreed ($86.7) $113.4 • Overall NPAs declined from $120 million in $101.0 ($31.5) 2Q24 to $113 million in 3Q24, including a $20M reduction in OREO • NPLs increased from $101 million in 2Q24 to 2Q24 Net RequirementLoan Growth 3Q24 2Q24 Downgrades Paydowns/offs 3Q24 2Q24 3Q24 $113 million in 3Q24 Charge-offs for & Other Projected to Substandard & Charge-offs Projected Projected Charge-offs – $87 million of NPLs were resolved during the quarter via charge-offs or paydowns – $99 million increase in NPLs primarily from: Strong Reserve Coverage and Criticized Loan Levels In-Line with Peers ▪ From Pass: 9 loans totaling $40.4 million, primarily due to past due payments, and one due to significant changes between company prepared and audited financial ACL / Loans Criticized Loans / Loans ACL / Criticized Loans statements received. ▪ From Pass-Watch: 6 loans totaling $28.8 million primarily due to declining trends in revenues. ~60% have RE collateral 1.41% 2.9% 2.7% 2.7% 1.22% 48.9% ▪ From Special Mention: 5 loans totaling $29.9 million 1.16% 44.1% 42.7% primarily due to continued declining trends in revenues. ~70% have RE collateral. – The downgraded credits were primarily larger C&I relationships with updated financial information • Overall, criticized loan levels and reserve levels AMTB AMTB Peer AMTB AMTB Peer AMTB AMTB Peer (1) (1) (1) (1) remain in-line with peer medians and the $20 2Q24 3Q24 Median 2Q24 3Q24 Median 2Q24 3Q24 Median million OREO sale contributed to an overall Projected Projected Projected decline in NPAs Source: Company Documents; S&P Global Market Intelligence. Note: Please see Slides 2 and 3 for additional information you should consider. 16 (1) Peer data as of 6/30/2024, Major exchange-traded banks and thrifts with total assets between $8 to $25 billion, excluding merger targets and mutuals and non-traditional banks (IBOC).
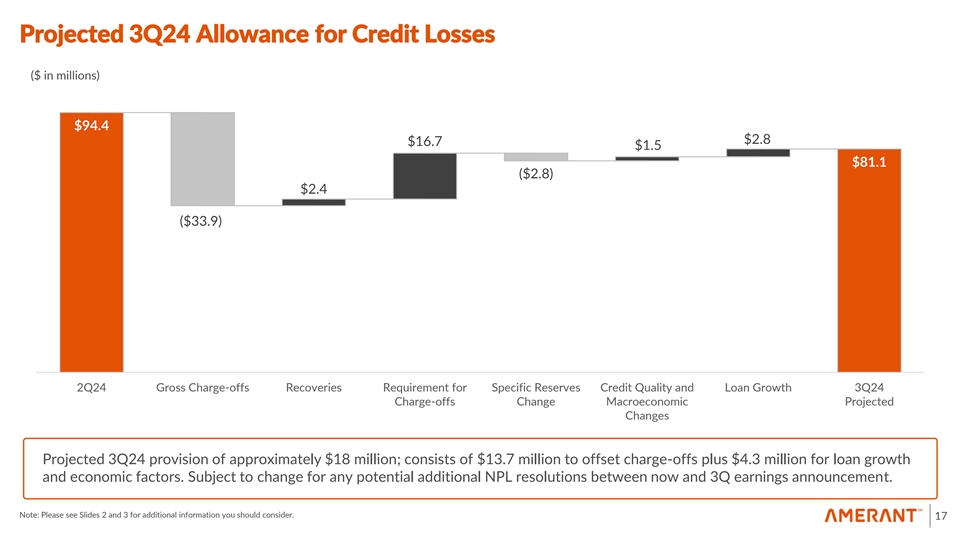
Projected 3Q24 Allowance for Credit Losses ($ in millions) $94.4 $2.8 $16.7 $1.5 $81.1 ($2.8) $2.4 ($33.9) 2Q24 Gross Charge-offs Recoveries Requirement for Specific Reserves Credit Quality and Loan Growth 3Q24 Charge-offs Change Macroeconomic Projected Changes Projected 3Q24 provision of approximately $18 million; consists of $13.7 million to offset charge-offs plus $4.3 million for loan growth and economic factors. Subject to change for any potential additional NPL resolutions between now and 3Q earnings announcement. Note: Please see Slides 2 and 3 for additional information you should consider. 17
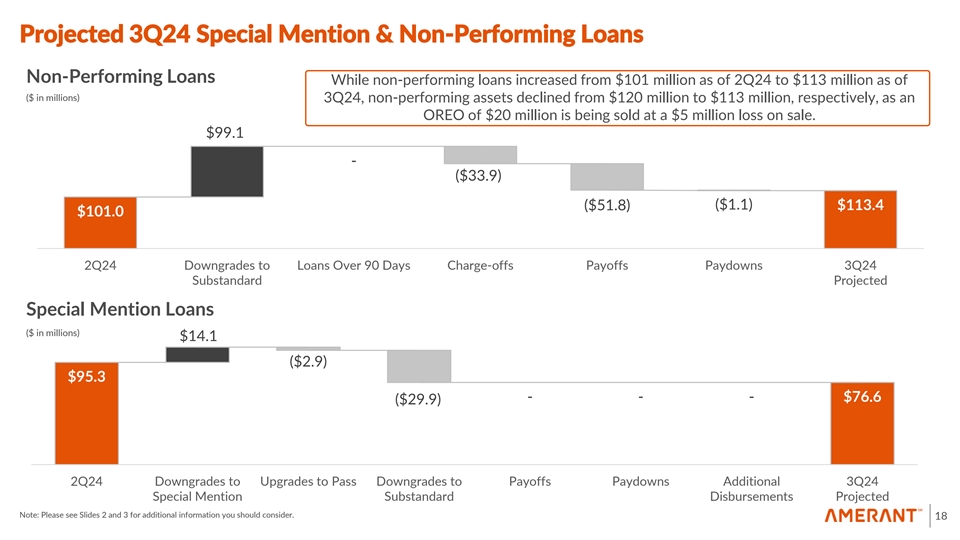
Projected 3Q24 Special Mention & Non-Performing Loans Non-Performing Loans While non-performing loans increased from $101 million as of 2Q24 to $113 million as of ($ in millions) 3Q24, non-performing assets declined from $120 million to $113 million, respectively, as an OREO of $20 million is being sold at a $5 million loss on sale. $99.1 - ($33.9) ($1.1) ($51.8) $113.4 $101.0 2Q24 Downgrades to Loans Over 90 Days Charge-offs Payoffs Paydowns 3Q24 Substandard Projected Special Mention Loans ($ in millions) $14.1 ($2.9) $95.3 - - - $76.6 ($29.9) 2Q24 Downgrades to Upgrades to Pass Downgrades to Payoffs Paydowns Additional 3Q24 Special Mention Substandard Disbursements Projected Note: Please see Slides 2 and 3 for additional information you should consider. 18

Appendices 19
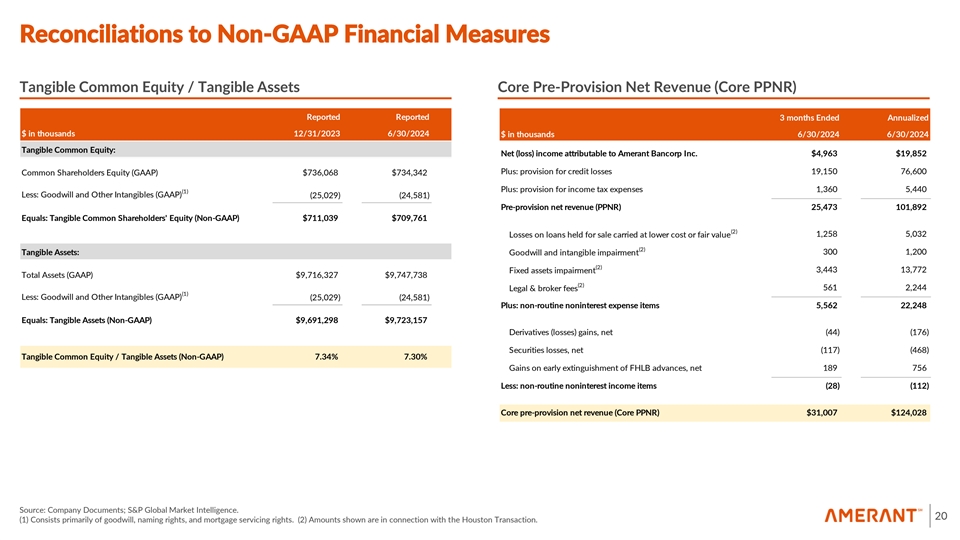
Reconciliations to Non-GAAP Financial Measures Tangible Common Equity / Tangible Assets Core Pre-Provision Net Revenue (Core PPNR) Reported Reported 3 months Ended Annualized $ in thousands 12/31/2023 6/30/2024 $ in thousands 6/30/2024 6/30/2024 Tangible Common Equity: Net (loss) income attributable to Amerant Bancorp Inc. $4,963 $19,852 Plus: provision for credit losses 19,150 76,600 Common Shareholders Equity (GAAP) $736,068 $734,342 Plus: provision for income tax expenses 1,360 5,440 (1) Less: Goodwill and Other Intangibles (GAAP) (25,029) (24,581) Pre-provision net revenue (PPNR) 25,473 101,892 Equals: Tangible Common Shareholders' Equity (Non-GAAP) $711,039 $709,761 (2) Losses on loans held for sale carried at lower cost or fair value 1,258 5,032 (2) 300 1,200 Tangible Assets: Goodwill and intangible impairment (2) Fixed assets impairment 3,443 13,772 Total Assets (GAAP) $9,716,327 $9,747,738 (2) 561 2,244 Legal & broker fees (1) Less: Goodwill and Other Intangibles (GAAP) (25,029) (24,581) Plus: non-routine noninterest expense items 5,562 22,248 Equals: Tangible Assets (Non-GAAP) $9,691,298 $9,723,157 Derivatives (losses) gains, net (44) (176) Securities losses, net (117) (468) Tangible Common Equity / Tangible Assets (Non-GAAP) 7.34% 7.30% Gains on early extinguishment of FHLB advances, net 189 756 Less: non-routine noninterest income items (28) (112) Core pre-provision net revenue (Core PPNR) $31,007 $124,028 Source: Company Documents; S&P Global Market Intelligence. 20 (1) Consists primarily of goodwill, naming rights, and mortgage servicing rights. (2) Amounts shown are in connection with the Houston Transaction.
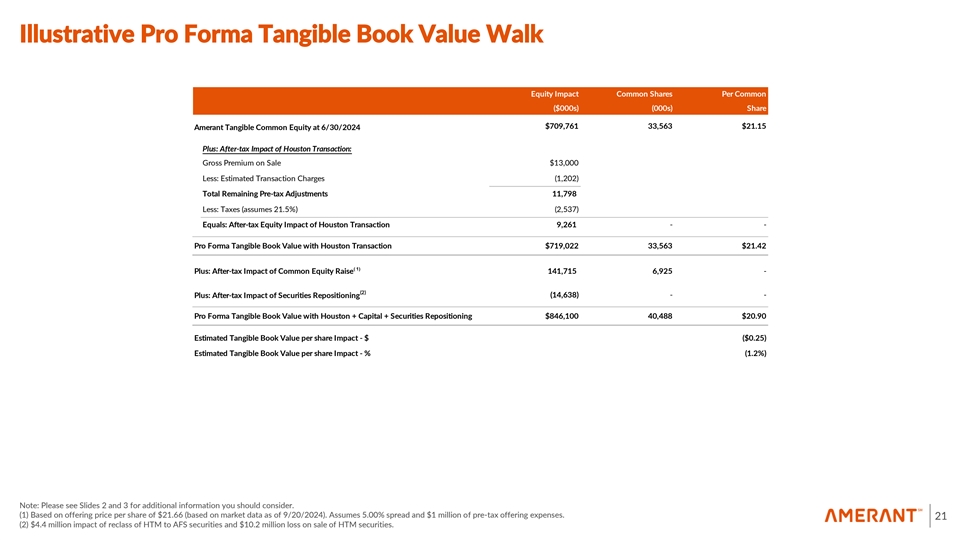
Illustrative Pro Forma Tangible Book Value Walk Equity Impact Common Shares Per Common ($000s) (000s) Share $709,761 33,563 $21.15 Amerant Tangible Common Equity at 6/30/2024 Plus: After-tax Impact of Houston Transaction: Gross Premium on Sale $13,000 Less: Estimated Transaction Charges (1,202) Total Remaining Pre-tax Adjustments 11,798 Less: Taxes (assumes 21.5%) (2,537) Equals: After-tax Equity Impact of Houston Transaction 9,261 - - Pro Forma Tangible Book Value with Houston Transaction $719,022 33,563 $21.42 ( 1) Plus: After-tax Impact of Common Equity Raise 141,715 6,925 - (2) (14,638) - - Plus: After-tax Impact of Securities Repositioning Pro Forma Tangible Book Value with Houston + Capital + Securities Repositioning $846,100 40,488 $20.90 Estimated Tangible Book Value per share Impact - $ ($0.25) Estimated Tangible Book Value per share Impact - % (1.2%) Note: Please see Slides 2 and 3 for additional information you should consider. (1) Based on offering price per share of $21.66 (based on market data as of 9/20/2024). Assumes 5.00% spread and $1 million of pre-tax offering expenses. 21 (2) $4.4 million impact of reclass of HTM to AFS securities and $10.2 million loss on sale of HTM securities.
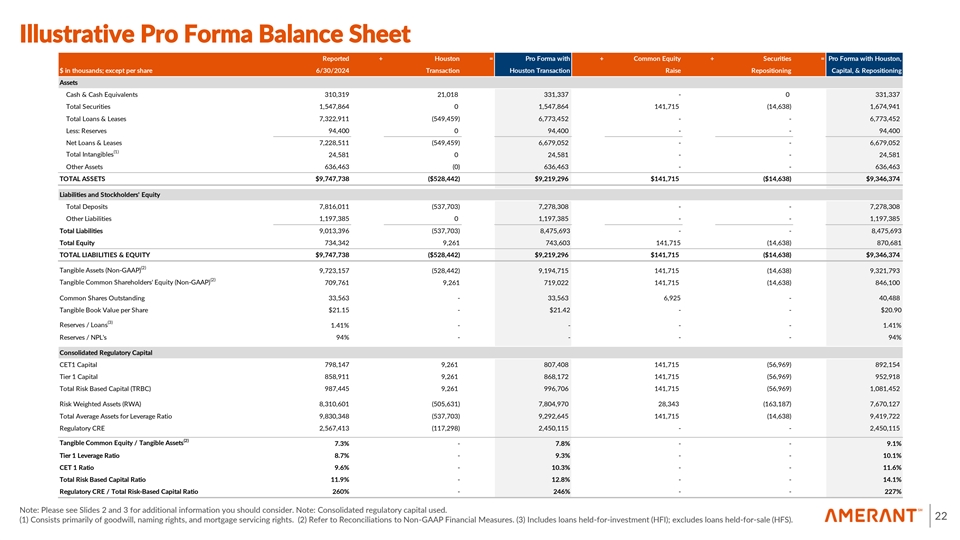
Illustrative Pro Forma Balance Sheet Reported + Houston = Pro Forma with + Common Equity + Securities = Pro Forma with Houston, $ in thousands; except per share 6/30/2024 Transaction Houston Transaction Raise Repositioning Capital, & Repositioning Assets Cash & Cash Equivalents 310,319 21,018 331,337 - 0 331,337 Total Securities 1,547,864 0 1,547,864 141,715 (14,638) 1,674,941 Total Loans & Leases 7,322,911 (549,459) 6,773,452 - - 6,773,452 Less: Reserves 94,400 0 94,400 - - 94,400 Net Loans & Leases 7,228,511 (549,459) 6,679,052 - - 6,679,052 (1) Total Intangibles 24,581 0 24,581 - - 24,581 Other Assets 636,463 (0) 636,463 - - 636,463 TOTAL ASSETS $9,747,738 ($528,442) $9,219,296 $141,715 ($14,638) $9,346,374 Liabilities and Stockholders' Equity Total Deposits 7,816,011 (537,703) 7,278,308 - - 7,278,308 Other Liabilities 1,197,385 0 1,197,385 - - 1,197,385 Total Liabilities 9,013,396 (537,703) 8,475,693 - - 8,475,693 Total Equity 734,342 9,261 743,603 141,715 (14,638) 870,681 TOTAL LIABILITIES & EQUITY $9,747,738 ($528,442) $9,219,296 $141,715 ($14,638) $9,346,374 (2) Tangible Assets (Non-GAAP) 9,723,157 (528,442) 9,194,715 141,715 (14,638) 9,321,793 (2) Tangible Common Shareholders' Equity (Non-GAAP) 709,761 9,261 719,022 141,715 (14,638) 846,100 Common Shares Outstanding 33,563 - 33,563 6,925 - 40,488 Tangible Book Value per Share $21.15 - $21.42 - - $20.90 (3) Reserves / Loans 1.41% - - - - 1.41% Reserves / NPL's 94% - - - - 94% Consolidated Regulatory Capital CET1 Capital 798,147 9,261 807,408 141,715 (56,969) 892,154 Tier 1 Capital 858,911 9,261 868,172 141,715 (56,969) 952,918 Total Risk Based Capital (TRBC) 987,445 9,261 996,706 141,715 (56,969) 1,081,452 Risk Weighted Assets (RWA) 8,310,601 (505,631) 7,804,970 28,343 (163,187) 7,670,127 Total Average Assets for Leverage Ratio 9,830,348 (537,703) 9,292,645 141,715 (14,638) 9,419,722 Regulatory CRE 2,567,413 (117,298) 2,450,115 - - 2,450,115 (2) Tangible Common Equity / Tangible Assets 7.3% - 7.8% - - 9.1% Tier 1 Leverage Ratio 8.7% - 9.3% - - 10.1% CET 1 Ratio 9.6% - 10.3% - - 11.6% Total Risk Based Capital Ratio 11.9% - 12.8% - - 14.1% Regulatory CRE / Total Risk-Based Capital Ratio 260% - 246% - - 227% Note: Please see Slides 2 and 3 for additional information you should consider. Note: Consolidated regulatory capital used. 22 (1) Consists primarily of goodwill, naming rights, and mortgage servicing rights. (2) Refer to Reconciliations to Non-GAAP Financial Measures. (3) Includes loans held-for-investment (HFI); excludes loans held-for-sale (HFS).