
Third Quarter 2019 Financial Review Earnings Call October 29, 2019

2 Important Notices and Disclaimers Forward-Looking Statements This presentation contains “forward-looking statements” within the meaning of the Securities Act of 1933 and the Securities Exchange Act of 1934, including, without limitation, future financial and operating results; costs and revenues; economic conditions generally and in our markets and among our customer base; loan demand; mortgage lending activity; changes in the mix of our earning assets and our deposit and wholesale liabilities; net interest margin; yields on earning assets; interest rates (generally and those applicable to our assets and liabilities); credit quality, including loan performance, nonperforming assets, provisions for loan losses, charge-offs, rebranding and staff realignment costs and expected savings, other- than-temporary impairments and collateral values; market trends; and customer preferences, as well as statements with respect to our objectives, expectations and intentions and other statements that are not historical facts. All statements other than statements of historical fact are statements that could be forward-looking statements. You can identify these forward- looking statements through our use of words such as “may,” “will,” “anticipate,” “assume,” “should,” “indicate,” “would,” “believe,” “contemplate,” “expect,” “estimate,” “continue,” “plan,” “point to,” “project,” “could,” “intend,” “target,” “goals,” “outlook”, "modeled" and other similar words and expressions of the future. Forward-looking statements, including those as to our beliefs, plans, objectives, goals, expectations, anticipations, estimates and intentions, involve known and unknown risks, uncertainties and other factors, which may be beyond our control, and which may cause the Company’s actual results, performance, achievements, or financial condition to be materially different from future results, performance, achievements, or financial condition expressed or implied by such forward-looking statements. You should not rely on any forward-looking statements as predictions of future events. You should not expect us to update any forward-looking statements. All written or oral forward-looking statements attributable to us are expressly qualified in their entirety by this cautionary notice, together with those risks and uncertainties described in “Risk factors” in our annual report on Form 10-K for the fiscal year ended December 31, 2018 and in our other filings with the U.S. Securities and Exchange Commission (the “SEC”), which are available at the SEC’s website www.sec.gov. Interim Financial Information Unaudited financial information as of and for interim periods, including as of and for the three and nine month periods ended September 30, 2019 and 2018, may not reflect our results of operations for our fiscal year ended, or financial condition as of December 31, 2019, or any other period of time or date. Non-GAAP Financial Measures The Company supplements its financial results that are determined in accordance with accounting principles generally accepted in the United States of America (“GAAP”) with non- GAAP financial measures, such as Adjusted Net Income per Share (Basic and Diluted), Adjusted Noninterest Expense, Adjusted Return on Equity (ROE), Adjusted Return on Assets (ROA), and other ratios. This supplemental information should not be considered in isolation or as a substitute for the GAAP measures presented herein. We use certain non-GAAP financial measures, including these, both to explain our results to shareholders and the investment community and in the internal evaluation and management of our businesses. Our management believes that these non-GAAP financial measures and the information they provide are useful to investors since these measures permit investors to view our performance using the same tools that our management uses to evaluate our past performance and prospects for future performance, especially in light of the additional costs we have incurred in 2018 in connection with the Spin-off and related transactions, and the rebranding and restructuring expenses which began in 2018 and continue in 2019. While we believe that these non-GAAP financial measures are useful in evaluating our performance, this information should be considered as supplemental and not as a substitute for or superior to the related financial information prepared in accordance with GAAP. Additionally, these non-GAAP financial measures may differ from similar measures presented by other companies. See Appendix 1 “Non-GAAP Financial Measures Reconciliations” for a reconciliation of these non-GAAP financial measures to their GAAP counterparts.
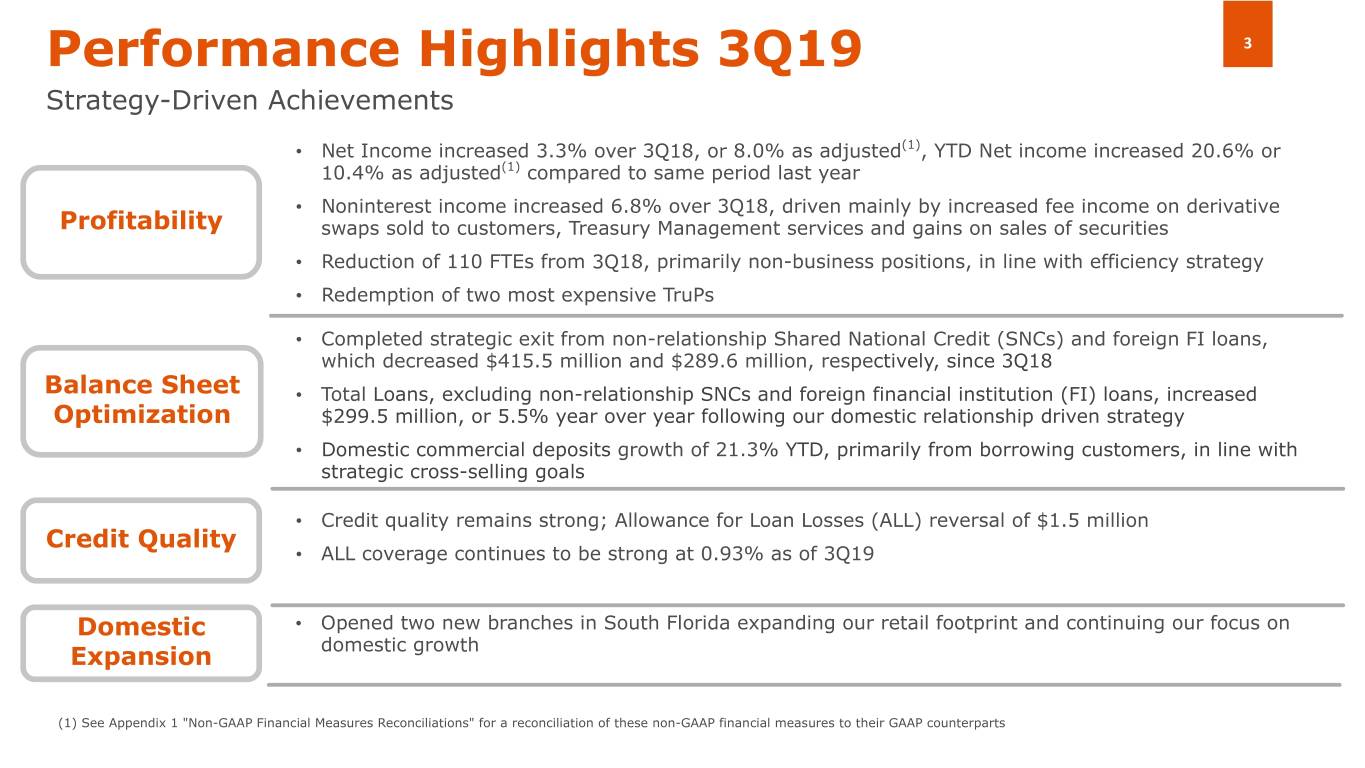
Performance Highlights 3Q19 3 Strategy-Driven Achievements • Net Income increased 3.3% over 3Q18, or 8.0% as adjusted(1), YTD Net income increased 20.6% or 10.4% as adjusted(1) compared to same period last year • Noninterest income increased 6.8% over 3Q18, driven mainly by increased fee income on derivative Profitability swaps sold to customers, Treasury Management services and gains on sales of securities • Reduction of 110 FTEs from 3Q18, primarily non-business positions, in line with efficiency strategy • Redemption of two most expensive TruPs • Completed strategic exit from non-relationship Shared National Credit (SNCs) and foreign FI loans, which decreased $415.5 million and $289.6 million, respectively, since 3Q18 Balance Sheet • Total Loans, excluding non-relationship SNCs and foreign financial institution (FI) loans, increased Optimization $299.5 million, or 5.5% year over year following our domestic relationship driven strategy • Domestic commercial deposits growth of 21.3% YTD, primarily from borrowing customers, in line with strategic cross-selling goals • Credit quality remains strong; Allowance for Loan Losses (ALL) reversal of $1.5 million Credit Quality • ALL coverage continues to be strong at 0.93% as of 3Q19 Domestic • Opened two new branches in South Florida expanding our retail footprint and continuing our focus on Expansion domestic growth (1) See Appendix 1 "Non-GAAP Financial Measures Reconciliations" for a reconciliation of these non-GAAP financial measures to their GAAP counterparts
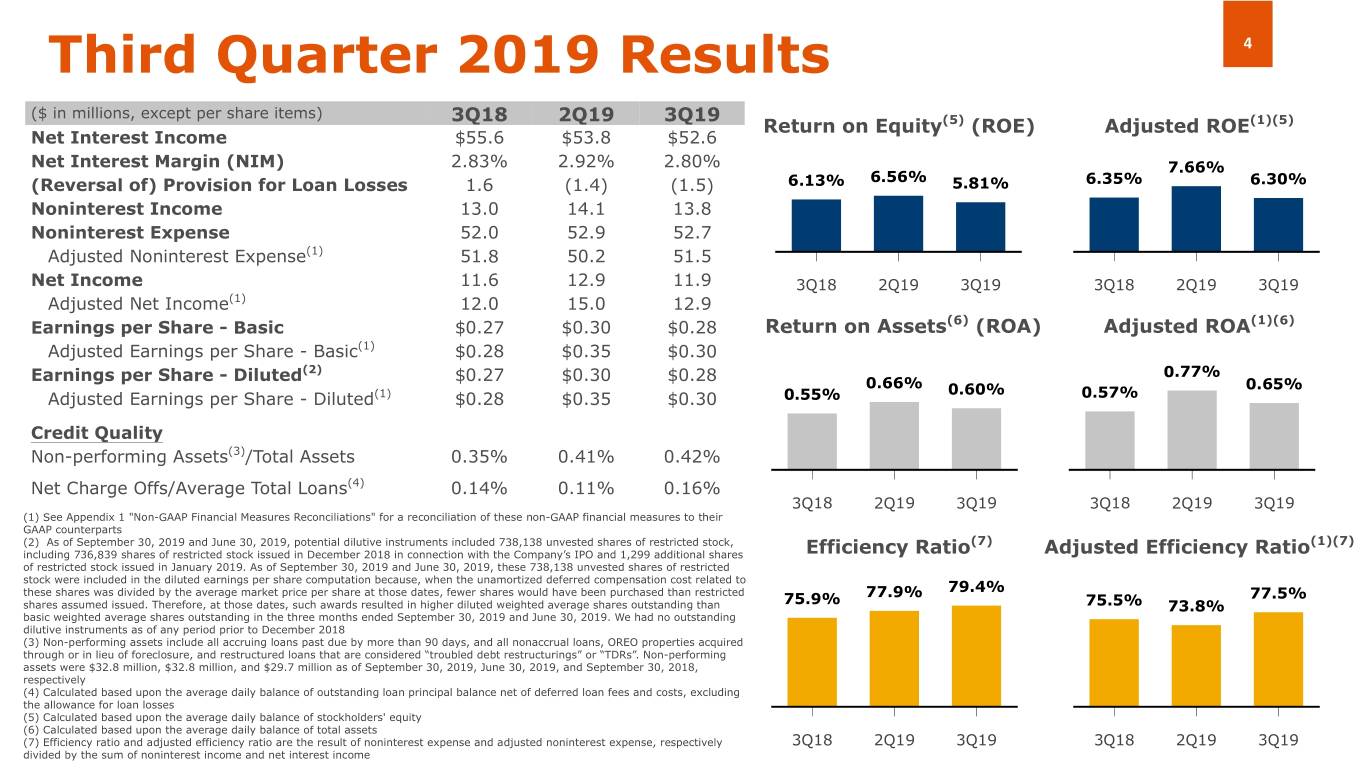
Third Quarter 2019 Results 4 ($ in millions, except per share items) 3Q18 2Q19 3Q19 Return on Equity(5) (ROE) Adjusted ROE(1)(5) Net Interest Income $55.6 $53.8 $52.6 Net Interest Margin (NIM) 2.83% 2.92% 2.80% 7.66% (Reversal of) Provision for Loan Losses 1.6 (1.4) (1.5) 6.13% 6.56% 5.81% 6.35% 6.30% Noninterest Income 13.0 14.1 13.8 Noninterest Expense 52.0 52.9 52.7 Adjusted Noninterest Expense(1) 51.8 50.2 51.5 Net Income 11.6 12.9 11.9 3Q18 2Q19 3Q19 3Q18 2Q19 3Q19 Adjusted Net Income(1) 12.0 15.0 12.9 Earnings per Share - Basic $0.27 $0.30 $0.28 Return on Assets(6) (ROA) Adjusted ROA(1)(6) Adjusted Earnings per Share - Basic(1) $0.28 $0.35 $0.30 Earnings per Share - Diluted(2) $0.27 $0.30 $0.28 0.77% 0.66% 0.60% 0.65% Adjusted Earnings per Share - Diluted(1) $0.28 $0.35 $0.30 0.55% 0.57% Credit Quality Non-performing Assets(3)/Total Assets 0.35% 0.41% 0.42% Net Charge Offs/Average Total Loans(4) 0.14% 0.11% 0.16% 3Q18 2Q19 3Q19 3Q18 2Q19 3Q19 (1) See Appendix 1 "Non-GAAP Financial Measures Reconciliations" for a reconciliation of these non-GAAP financial measures to their GAAP counterparts (2) As of September 30, 2019 and June 30, 2019, potential dilutive instruments included 738,138 unvested shares of restricted stock, (7) (1)(7) including 736,839 shares of restricted stock issued in December 2018 in connection with the Company’s IPO and 1,299 additional shares Efficiency Ratio Adjusted Efficiency Ratio of restricted stock issued in January 2019. As of September 30, 2019 and June 30, 2019, these 738,138 unvested shares of restricted stock were included in the diluted earnings per share computation because, when the unamortized deferred compensation cost related to 79.4% these shares was divided by the average market price per share at those dates, fewer shares would have been purchased than restricted 75.9% 77.9% 77.5% shares assumed issued. Therefore, at those dates, such awards resulted in higher diluted weighted average shares outstanding than 75.5% 73.8% basic weighted average shares outstanding in the three months ended September 30, 2019 and June 30, 2019. We had no outstanding dilutive instruments as of any period prior to December 2018 (3) Non-performing assets include all accruing loans past due by more than 90 days, and all nonaccrual loans, OREO properties acquired through or in lieu of foreclosure, and restructured loans that are considered “troubled debt restructurings” or “TDRs”. Non-performing assets were $32.8 million, $32.8 million, and $29.7 million as of September 30, 2019, June 30, 2019, and September 30, 2018, respectively (4) Calculated based upon the average daily balance of outstanding loan principal balance net of deferred loan fees and costs, excluding the allowance for loan losses (5) Calculated based upon the average daily balance of stockholders' equity (6) Calculated based upon the average daily balance of total assets (7) Efficiency ratio and adjusted efficiency ratio are the result of noninterest expense and adjusted noninterest expense, respectively 3Q18 2Q19 3Q19 3Q18 2Q19 3Q19 divided by the sum of noninterest income and net interest income
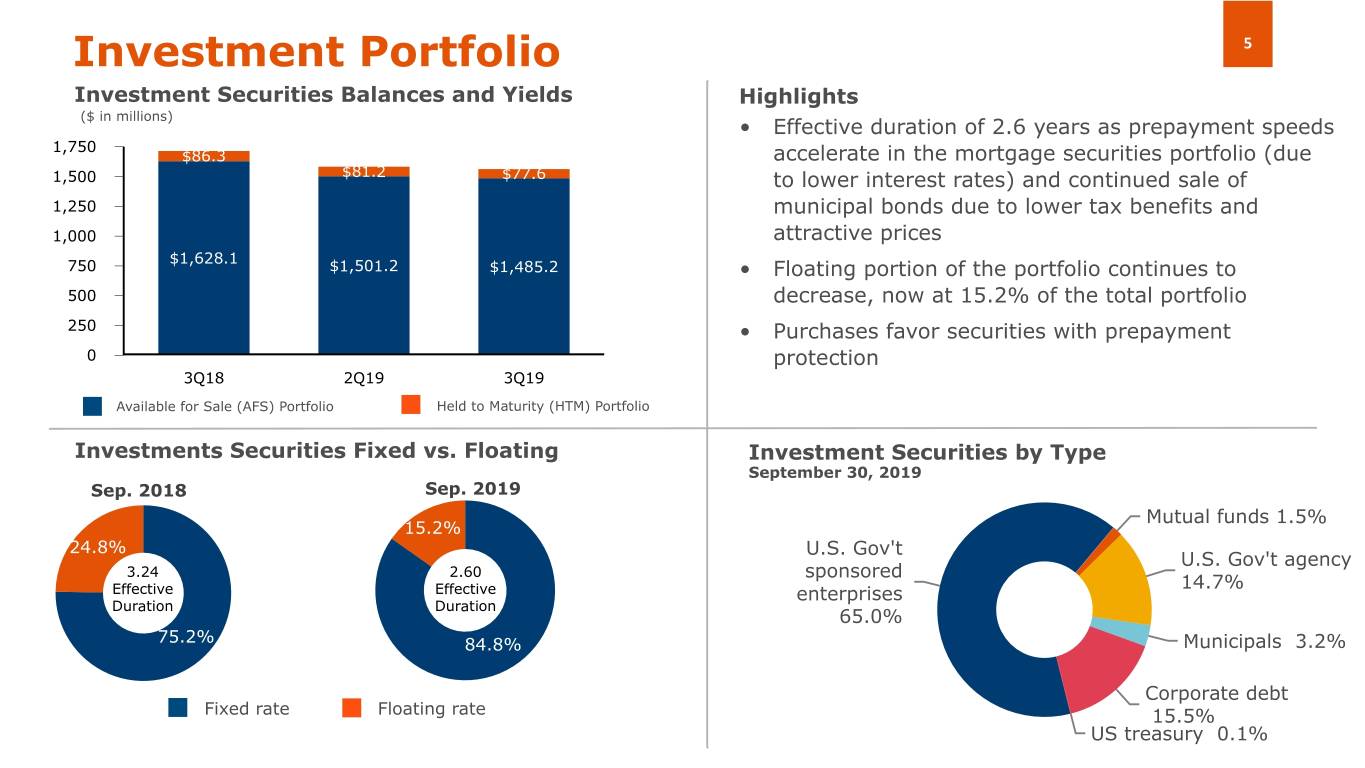
Investment Portfolio 5 Investment Securities Balances and Yields Highlights ($ in millions) • Effective duration of 2.6 years as prepayment speeds 1,750 $86.3 accelerate in the mortgage securities portfolio (due 1,500 $81.2 $77.6 to lower interest rates) and continued sale of 1,250 municipal bonds due to lower tax benefits and 1,000 attractive prices $1,628.1 750 $1,501.2 $1,485.2 • Floating portion of the portfolio continues to 500 decrease, now at 15.2% of the total portfolio 250 • Purchases favor securities with prepayment 0 protection 3Q18 2Q19 3Q19 Available for Sale (AFS) Portfolio Held to Maturity (HTM) Portfolio Investments Securities Fixed vs. Floating Investment Securities by Type September 30, 2019 Sep. 2018 Sep. 2019 Mutual funds 1.5% 15.2% 24.8% U.S. Gov't U.S. Gov't agency 3.24 2.60 sponsored 14.7% Effective Effective enterprises Duration Duration 65.0% 75.2% 84.8% Municipals 3.2% Corporate debt Fixed rate Floating rate 15.5% US treasury 0.1%
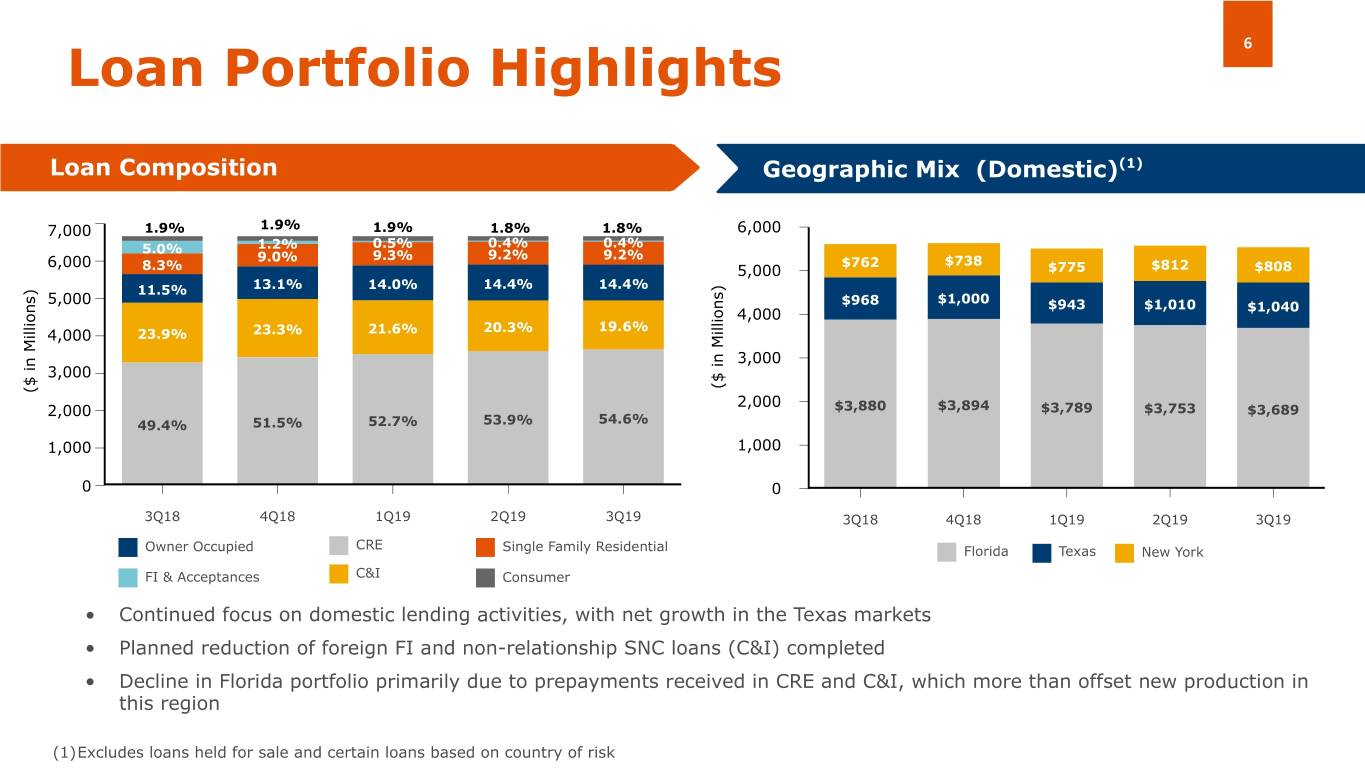
6 Loan Portfolio Highlights Loan Composition Geographic Mix (Domestic) (Domestic)(1) 7,000 1.9% 1.9% 1.9% 1.8% 1.8% 6,000 1.2% 0.5% 0.4% 0.4% 5.0% 9.3% 9.2% 9.2% 6,000 9.0% $762 $738 8.3% 5,000 $775 $812 $808 11.5% 13.1% 14.0% 14.4% 14.4% 5,000 $968 $1,000 $943 $1,010 4,000 $1,040 20.3% 19.6% 4,000 23.9% 23.3% 21.6% 3,000 3,000 ($ in Millions) ($ in Millions) 2,000 2,000 $3,880 $3,894 $3,789 $3,753 $3,689 49.4% 51.5% 52.7% 53.9% 54.6% 1,000 1,000 0 0 3Q18 4Q18 1Q19 2Q19 3Q19 3Q18 4Q18 1Q19 2Q19 3Q19 CRE Owner Occupied Single Family Residential Florida Texas New York FI & Acceptances C&I Consumer • Continued focus on domestic lending activities, with net growth in the Texas markets • Planned reduction of foreign FI and non-relationship SNC loans (C&I) completed • Decline in Florida portfolio primarily due to prepayments received in CRE and C&I, which more than offset new production in this region (1)Excludes loans held for sale and certain loans based on country of risk
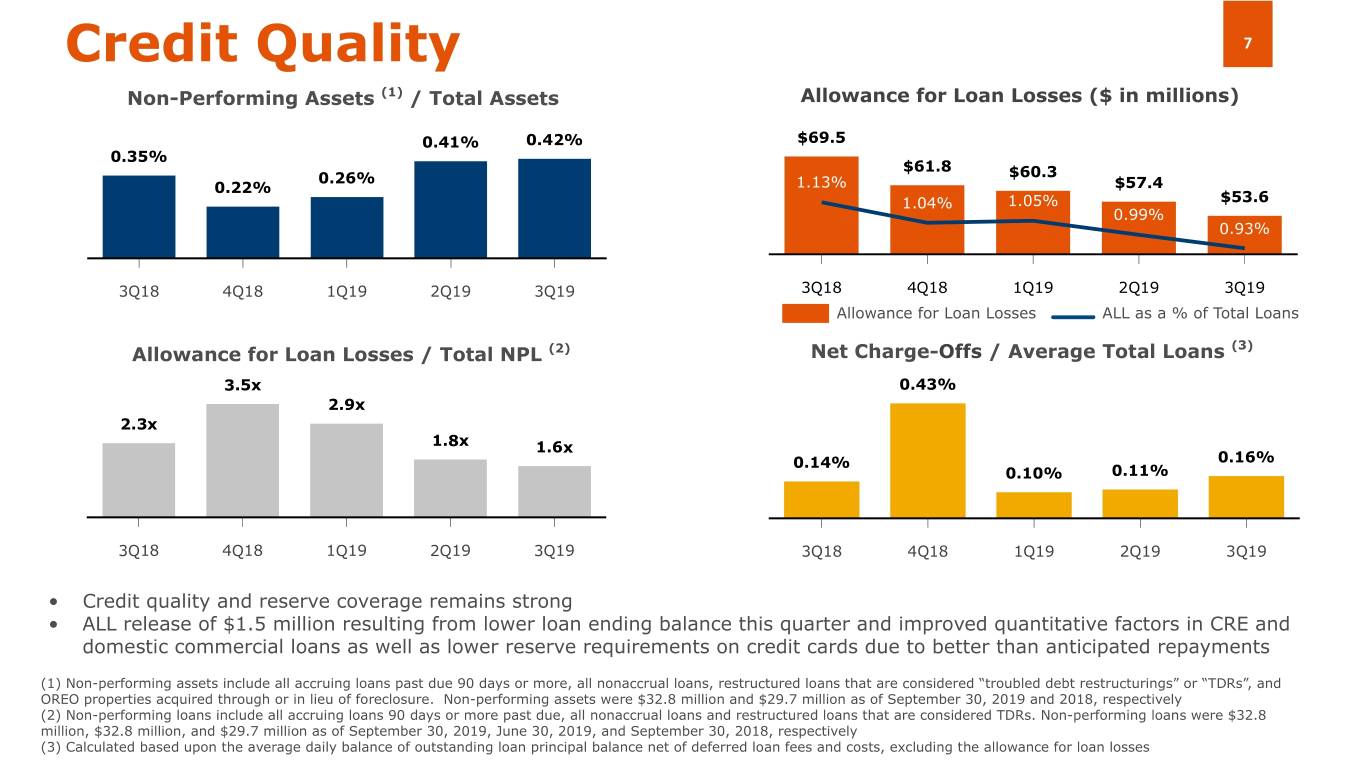
Credit Quality 7 Non-Performing Assets (1) / Total Assets Allowance for Loan Losses ($ in millions) 0.41% 0.42% $69.5 0.35% $61.8 0.26% $60.3 0.22% 1.13% $57.4 1.04% 1.05% $53.6 0.99% 0.93% 3Q18 4Q18 1Q19 2Q19 3Q19 3Q18 4Q18 1Q19 2Q19 3Q19 Allowance for Loan Losses ALL as a % of Total Loans (3) Allowance for Loan Losses / Total NPL (2) Net Charge-Offs / Average Total Loans 3.5x 0.43% 2.9x 2.3x 1.8x 1.6x 0.14% 0.16% 0.10% 0.11% 3Q18 4Q18 1Q19 2Q19 3Q19 3Q18 4Q18 1Q19 2Q19 3Q19 • Credit quality and reserve coverage remains strong • ALL release of $1.5 million resulting from lower loan ending balance this quarter and improved quantitative factors in CRE and domestic commercial loans as well as lower reserve requirements on credit cards due to better than anticipated repayments (1) Non-performing assets include all accruing loans past due 90 days or more, all nonaccrual loans, restructured loans that are considered “troubled debt restructurings” or “TDRs”, and OREO properties acquired through or in lieu of foreclosure. Non-performing assets were $32.8 million and $29.7 million as of September 30, 2019 and 2018, respectively (2) Non-performing loans include all accruing loans 90 days or more past due, all nonaccrual loans and restructured loans that are considered TDRs. Non-performing loans were $32.8 million, $32.8 million, and $29.7 million as of September 30, 2019, June 30, 2019, and September 30, 2018, respectively (3) Calculated based upon the average daily balance of outstanding loan principal balance net of deferred loan fees and costs, excluding the allowance for loan losses
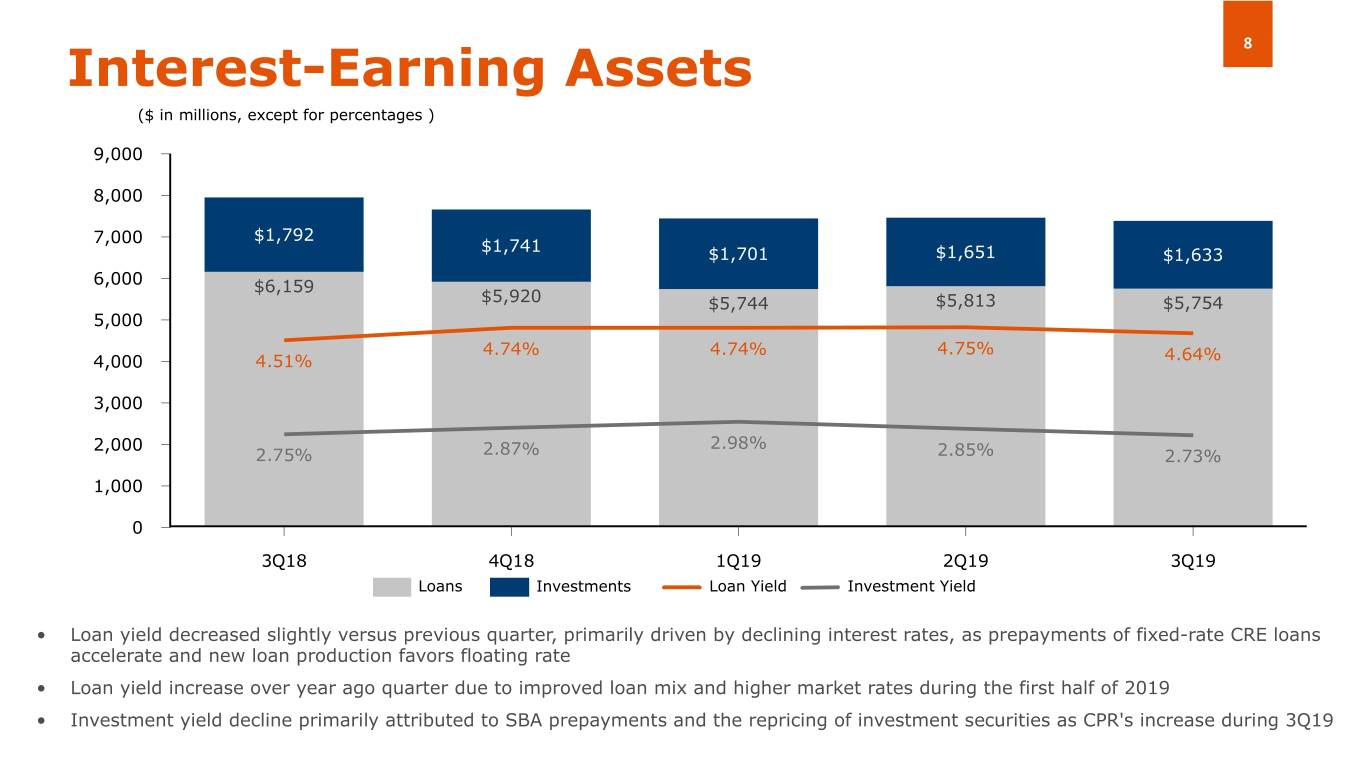
8 Interest-Earning Assets ($ in millions, except for percentages ) 9,000 8,000 7,000 $1,792 $1,741 $1,701 $1,651 $1,633 6,000 $6,159 $5,920 $5,744 $5,813 $5,754 5,000 4.74% 4.74% 4.75% 4,000 4.51% 4.64% 3,000 2,000 2.98% 2.75% 2.87% 2.85% 2.73% 1,000 0 3Q18 4Q18 1Q19 2Q19 3Q19 Loans Investments Loan Yield Investment Yield • Loan yield decreased slightly versus previous quarter, primarily driven by declining interest rates, as prepayments of fixed-rate CRE loans accelerate and new loan production favors floating rate • Loan yield increase over year ago quarter due to improved loan mix and higher market rates during the first half of 2019 • Investment yield decline primarily attributed to SBA prepayments and the repricing of investment securities as CPR's increase during 3Q19
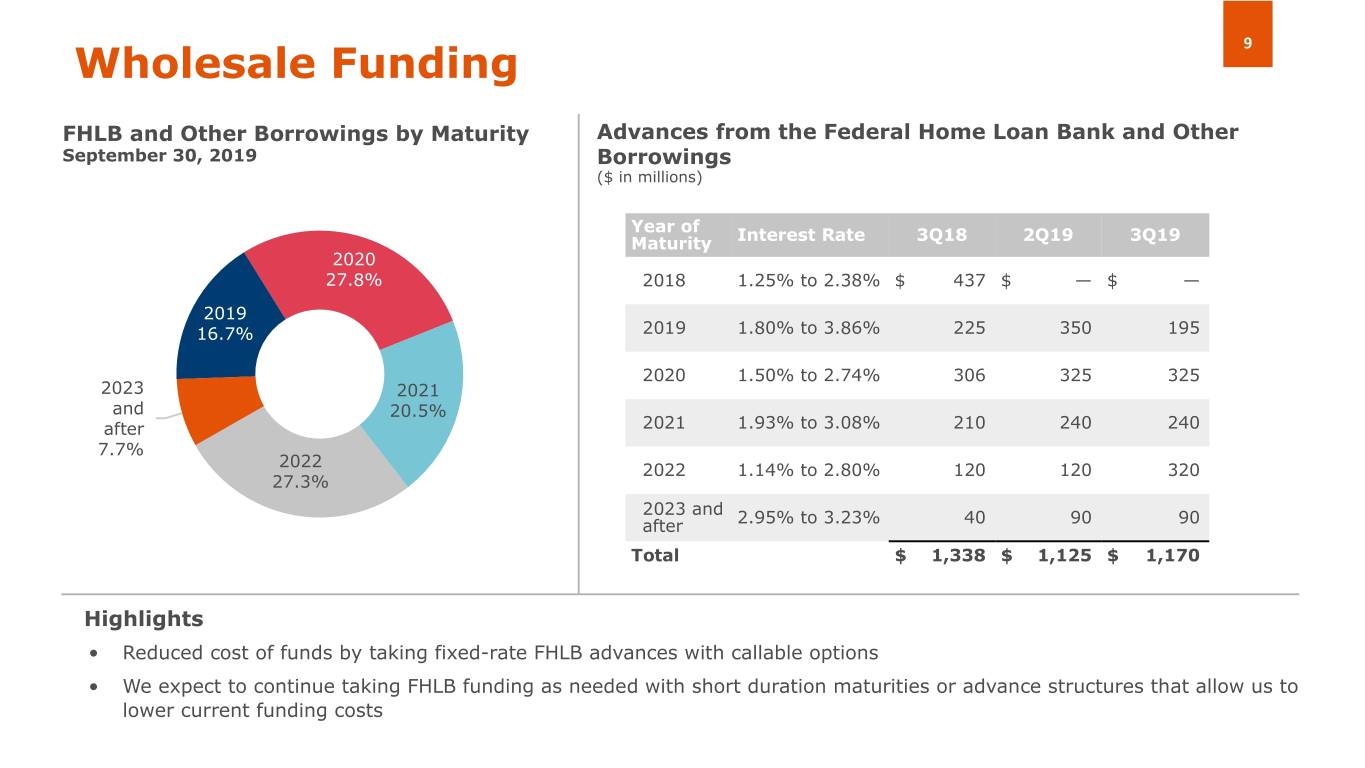
9 Wholesale Funding FHLB and Other Borrowings by Maturity Advances from the Federal Home Loan Bank and Other September 30, 2019 Borrowings ($ in millions) Year of Maturity Interest Rate 3Q18 2Q19 3Q19 2020 27.8% 2018 1.25% to 2.38% $ 437 $ — $ — 2019 16.7% 2019 1.80% to 3.86% 225 350 195 2020 1.50% to 2.74% 306 325 325 2023 2021 and 20.5% after 2021 1.93% to 3.08% 210 240 240 7.7% 2022 2022 1.14% to 2.80% 120 120 320 27.3% 2023 and after 2.95% to 3.23% 40 90 90 Total $ 1,338 $ 1,125 $ 1,170 Highlights • Reduced cost of funds by taking fixed-rate FHLB advances with callable options • We expect to continue taking FHLB funding as needed with short duration maturities or advance structures that allow us to lower current funding costs
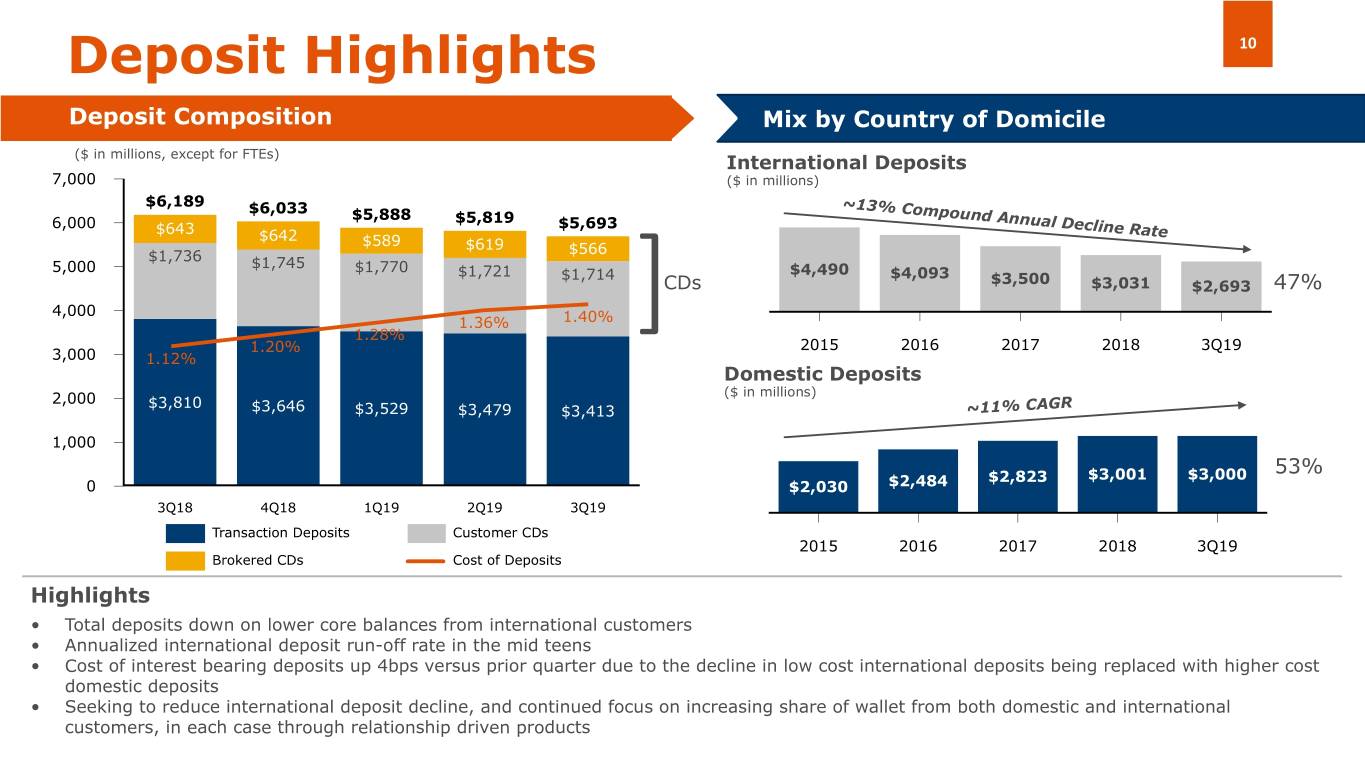
Deposit Highlights 10 Deposit Composition Mix by Country of Domicile ($ in millions, except for FTEs) International Deposits 7,000 ($ in millions) $6,189 ~13% Compound Annual Decline Rate $6,033 $5,888 6,000 $5,819 $5,693 $643 $642 $589 $619 $1,736 $566 5,000 $1,745 $1,770 $4,490 $1,721 $1,714 $4,093 $3,500 CDs $3,031 $2,693 47% 4,000 1.36% 1.40% 1.28% ] 1.20% 2015 2016 2017 2018 3Q19 3,000 1.12% Domestic Deposits ($ in millions) 2,000 $3,810 $3,646 $3,529 $3,479 $3,413 ~11% CAGR 1,000 $2,823 $3,001 $3,000 53% 0 $2,030 $2,484 3Q18 4Q18 1Q19 2Q19 3Q19 Transaction Deposits Customer CDs 2015 2016 2017 2018 3Q19 Brokered CDs Cost of Deposits Highlights • Total deposits down on lower core balances from international customers • Annualized international deposit run-off rate in the mid teens • Cost of interest bearing deposits up 4bps versus prior quarter due to the decline in low cost international deposits being replaced with higher cost domestic deposits • Seeking to reduce international deposit decline, and continued focus on increasing share of wallet from both domestic and international customers, in each case through relationship driven products
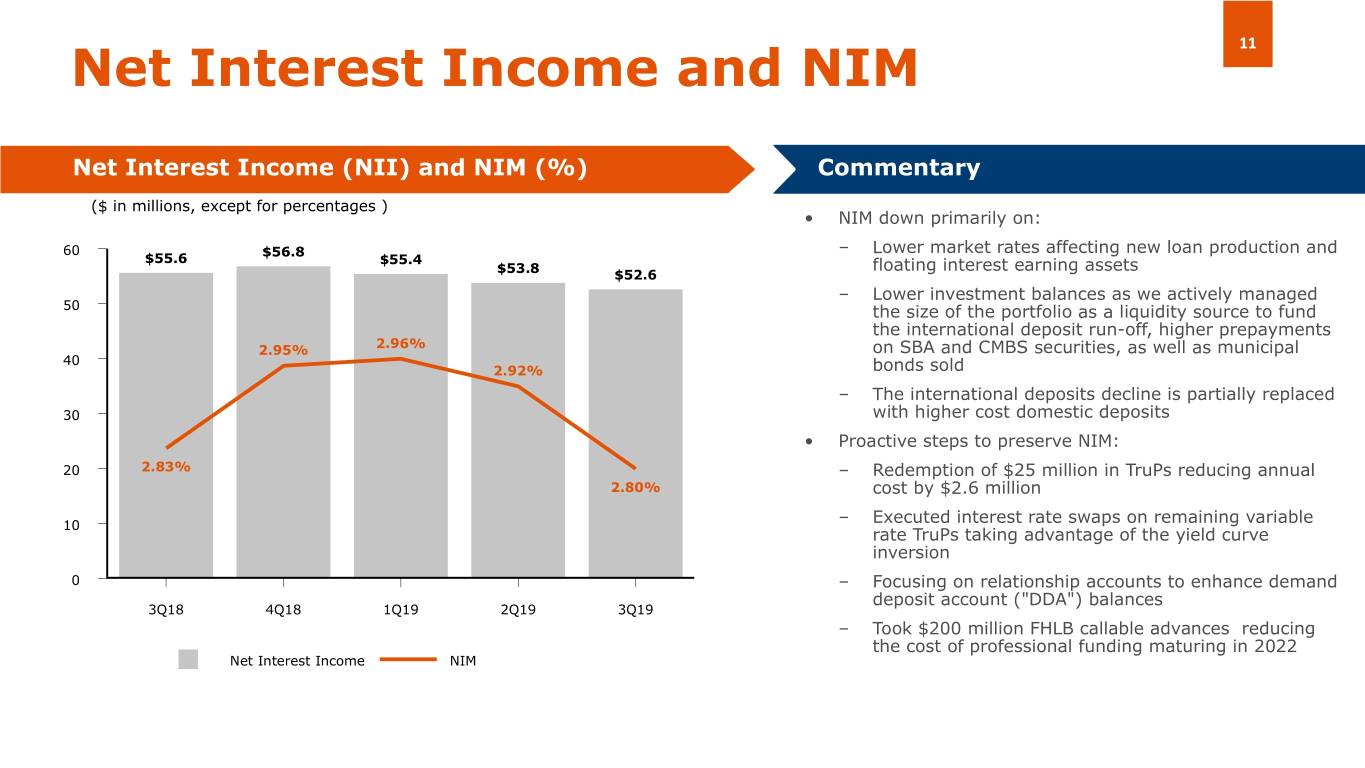
11 Net Interest Income and NIM Net Interest Income (NII) and NIM (%) Commentary ($ in millions, except for percentages ) • NIM down primarily on: 60 $56.8 – Lower market rates affecting new loan production and $55.6 $55.4 floating interest earning assets $53.8 $52.6 – Lower investment balances as we actively managed 50 the size of the portfolio as a liquidity source to fund the international deposit run-off, higher prepayments 2.96% 2.95% on SBA and CMBS securities, as well as municipal 40 2.92% bonds sold – The international deposits decline is partially replaced 30 with higher cost domestic deposits • Proactive steps to preserve NIM: 20 2.83% – Redemption of $25 million in TruPs reducing annual 2.80% cost by $2.6 million 10 – Executed interest rate swaps on remaining variable rate TruPs taking advantage of the yield curve inversion 0 – Focusing on relationship accounts to enhance demand deposit account ("DDA") balances 3Q18 4Q18 1Q19 2Q19 3Q19 – Took $200 million FHLB callable advances reducing the cost of professional funding maturing in 2022 Net Interest Income NIM
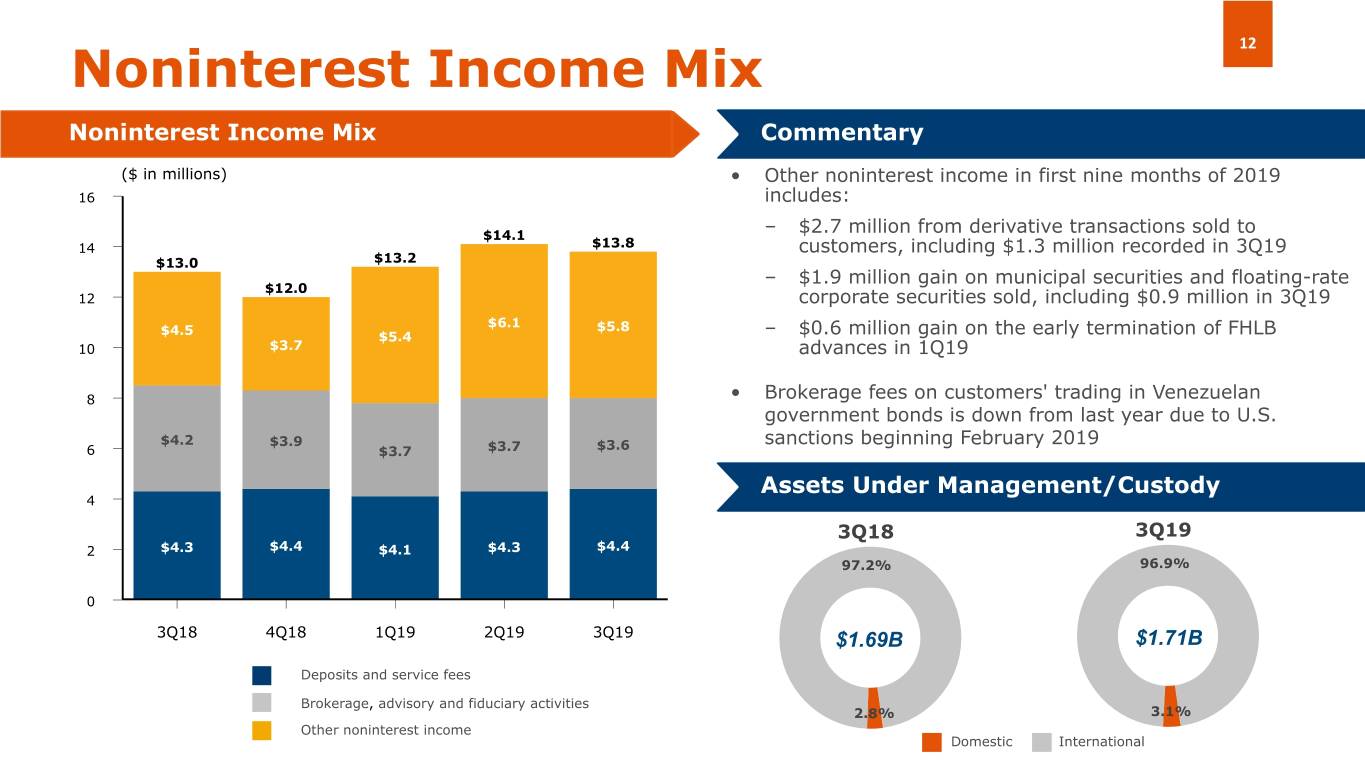
12 Noninterest Income Mix Noninterest Income Mix Commentary ($ in millions) • Other noninterest income in first nine months of 2019 16 includes: $14.1 – $2.7 million from derivative transactions sold to 14 $13.8 customers, including $1.3 million recorded in 3Q19 $13.0 $13.2 – $1.9 million gain on municipal securities and floating-rate $12.0 12 corporate securities sold, including $0.9 million in 3Q19 $6.1 $5.8 $4.5 $5.4 – $0.6 million gain on the early termination of FHLB 10 $3.7 advances in 1Q19 8 • Brokerage fees on customers' trading in Venezuelan government bonds is down from last year due to U.S. $4.2 $3.9 sanctions beginning February 2019 6 $3.7 $3.7 $3.6 Assets Under Management/Custody 4 3Q18 3Q19 2 $4.3 $4.4 $4.1 $4.3 $4.4 97.2% 96.9% 0 3Q18 4Q18 1Q19 2Q19 3Q19 $1.69B $1.71B Deposits and service fees Brokerage, advisory and fiduciary activities 2.8% 3.1% Other noninterest income Domestic International
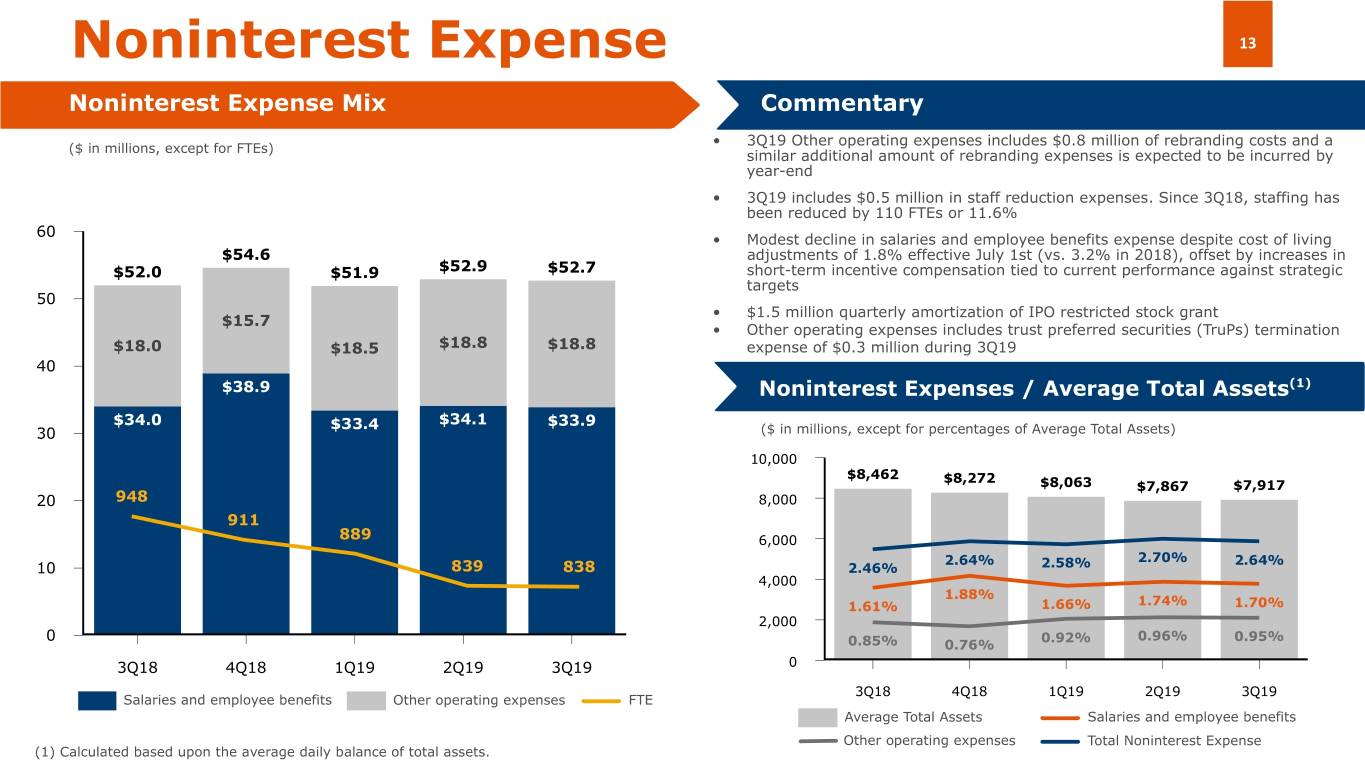
Noninterest Expense 13 Noninterest Expense Mix Commentary • 3Q19 Other operating expenses includes $0.8 million of rebranding costs and a ($ in millions, except for FTEs) similar additional amount of rebranding expenses is expected to be incurred by year-end • 3Q19 includes $0.5 million in staff reduction expenses. Since 3Q18, staffing has been reduced by 110 FTEs or 11.6% 60 • Modest decline in salaries and employee benefits expense despite cost of living $54.6 adjustments of 1.8% effective July 1st (vs. 3.2% in 2018), offset by increases in $52.0 $51.9 $52.9 $52.7 short-term incentive compensation tied to current performance against strategic targets 50 • $1.5 million quarterly amortization of IPO restricted stock grant $15.7 • Other operating expenses includes trust preferred securities (TruPs) termination $18.0 $18.5 $18.8 $18.8 expense of $0.3 million during 3Q19 40 $38.9 Noninterest Expenses / Average Total Assets(1) $34.0 $33.4 $34.1 $33.9 30 ($ in millions, except for percentages of Average Total Assets) 10,000 $8,462 $8,272 $8,063 $7,867 $7,917 20 948 8,000 911 889 6,000 2.71% 2.64% 2.70% 2.64% 10 839 838 2.46% 2.58% 4,000 1.88% 1.69% 1.61% 1.66% 1.74% 1.70% 2,000 1.02% 0 0.92% 0.96% 0.95% 0.85% 0.76% 3Q18 4Q18 1Q19 2Q19 3Q19 0 3Q18 4Q18 1Q19 2Q19 3Q19 Salaries and employee benefits Other operating expenses FTE Average Total Assets Salaries and employee benefits Other operating expenses Total Noninterest Expense (1) Calculated based upon the average daily balance of total assets.
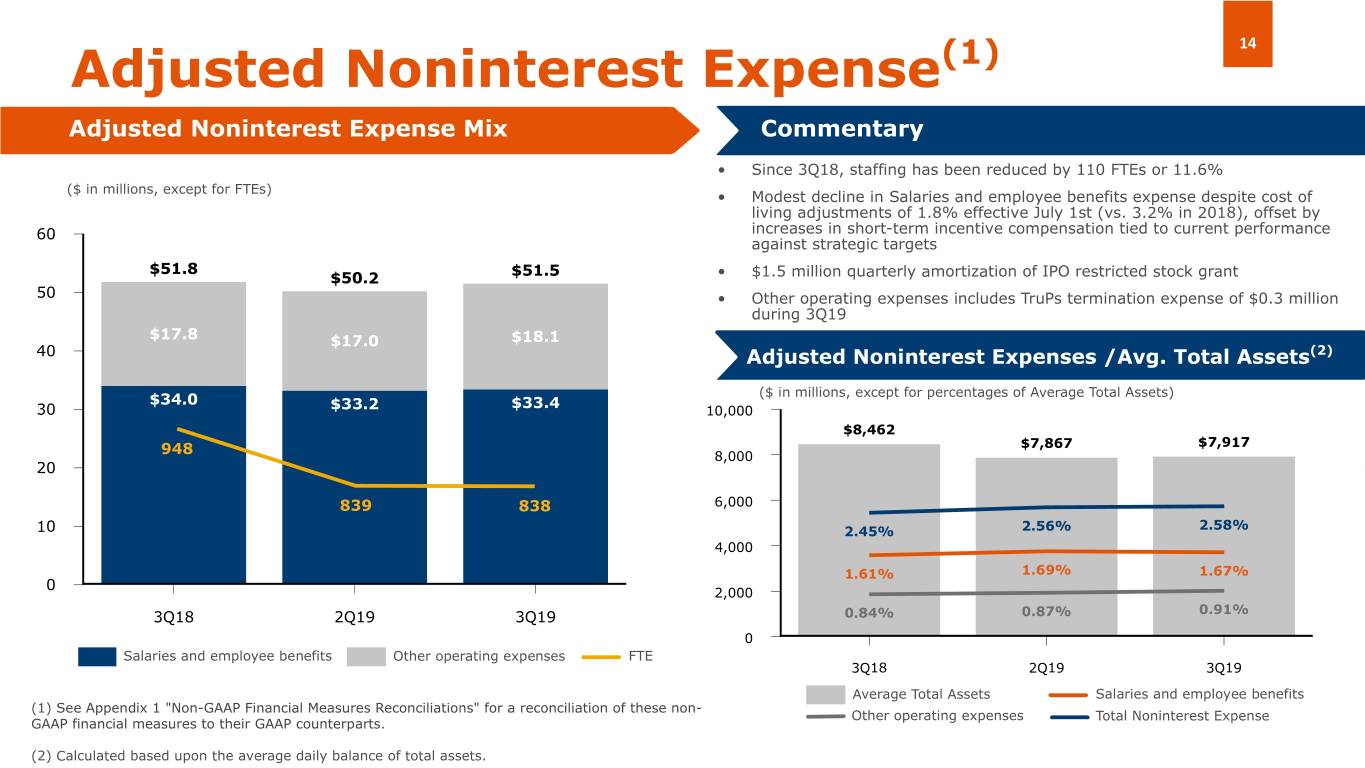
14 Adjusted Noninterest Expense(1) Adjusted Noninterest Expense Mix Commentary • Since 3Q18, staffing has been reduced by 110 FTEs or 11.6% ($ in millions, except for FTEs) • Modest decline in Salaries and employee benefits expense despite cost of living adjustments of 1.8% effective July 1st (vs. 3.2% in 2018), offset by 60 increases in short-term incentive compensation tied to current performance against strategic targets $51.8 $51.5 $50.2 • $1.5 million quarterly amortization of IPO restricted stock grant 50 • Other operating expenses includes TruPs termination expense of $0.3 million during 3Q19 $17.8 $17.0 $18.1 40 Adjusted Noninterest Expenses /Avg. Total Assets(2) ($ in millions, except for percentages of Average Total Assets) $34.0 $33.4 30 $33.2 10,000 $8,462 $7,867 $7,917 948 8,000 20 839 838 6,000 10 2.45% 2.56% 2.58% 4,000 1.61% 1.69% 1.67% 0 2,000 0.91% 3Q18 2Q19 3Q19 0.84% 0.87% 0 Salaries and employee benefits Other operating expenses FTE 3Q18 2Q19 3Q19 Average Total Assets Salaries and employee benefits (1) See Appendix 1 "Non-GAAP Financial Measures Reconciliations" for a reconciliation of these non- Other operating expenses Total Noninterest Expense GAAP financial measures to their GAAP counterparts. (2) Calculated based upon the average daily balance of total assets.
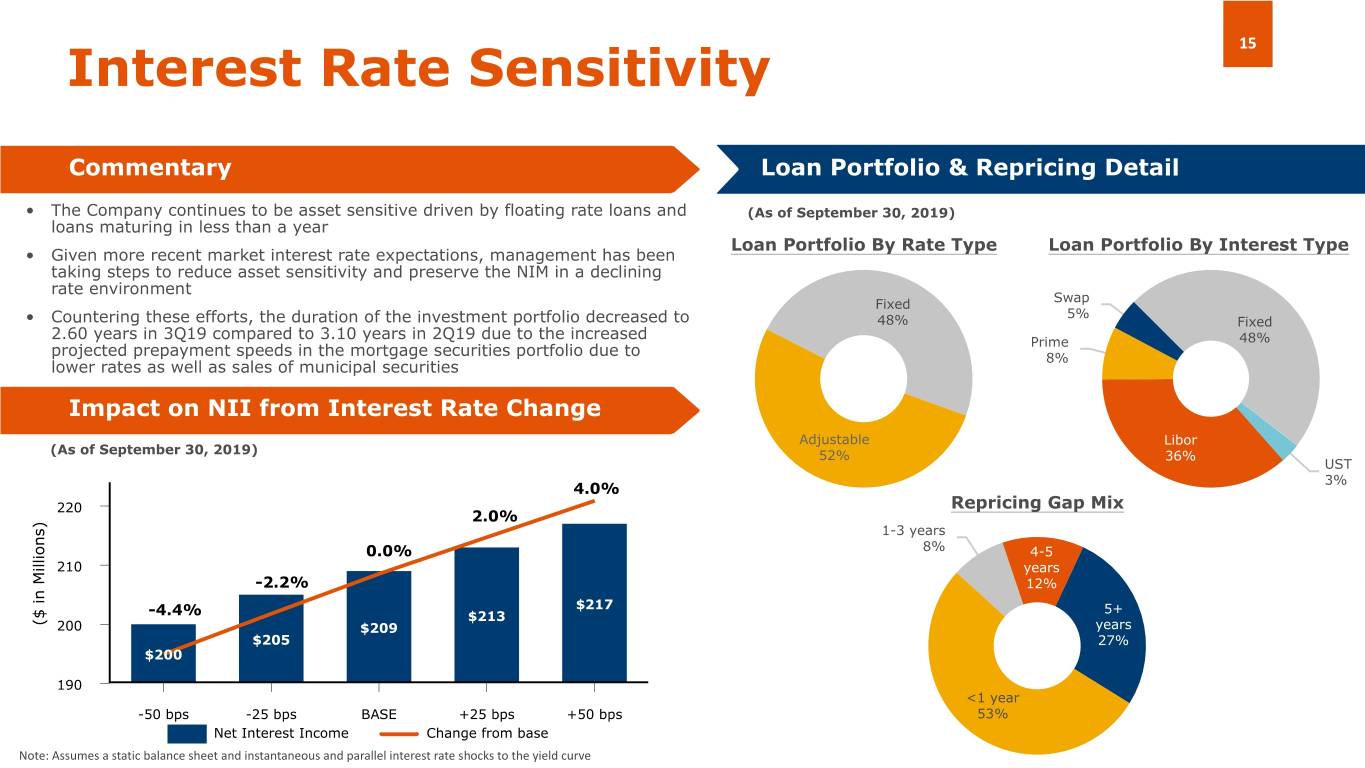
15 Interest Rate Sensitivity Commentary Loan Portfolio & Repricing Detail • The Company continues to be asset sensitive driven by floating rate loans and (As of September 30, 2019) loans maturing in less than a year Loan Portfolio By Rate Type Loan Portfolio By Interest Type • Given more recent market interest rate expectations, management has been taking steps to reduce asset sensitivity and preserve the NIM in a declining rate environment Fixed Swap 5% • Countering these efforts, the duration of the investment portfolio decreased to 48% Fixed 2.60 years in 3Q19 compared to 3.10 years in 2Q19 due to the increased Prime 48% projected prepayment speeds in the mortgage securities portfolio due to 8% lower rates as well as sales of municipal securities Impact on NII from Interest Rate Change Adjustable Libor (As of September 30, 2019) 52% 36% UST 3% 4.0% 220 Repricing Gap Mix 2.0% 1-3 years 0.0% 8% 4-5 210 years -2.2% 12% $217 5+ -4.4% $213 ($ in Millions) 200 $209 years $205 27% $200 190 <1 year -50 bps -25 bps BASE +25 bps +50 bps 53% Net Interest Income Change from base Note: Assumes a static balance sheet and instantaneous and parallel interest rate shocks to the yield curve
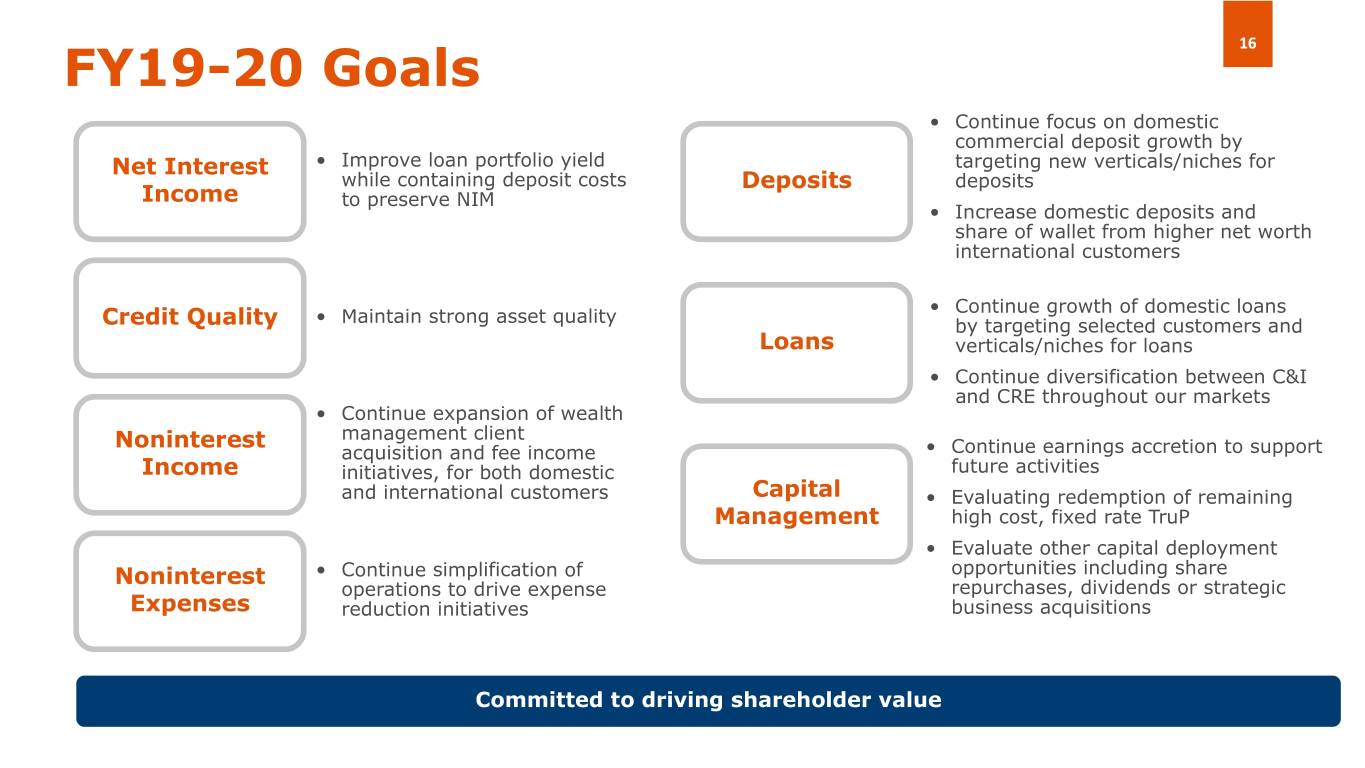
16 FY19-20 Goals • Continue focus on domestic commercial deposit growth by Net Interest • Improve loan portfolio yield targeting new verticals/niches for while containing deposit costs Deposits deposits Income to preserve NIM • Increase domestic deposits and share of wallet from higher net worth international customers • Continue growth of domestic loans • Maintain strong asset quality Credit Quality by targeting selected customers and Loans verticals/niches for loans • Continue diversification between C&I and CRE throughout our markets • Continue expansion of wealth Noninterest management client acquisition and fee income • Continue earnings accretion to support Income initiatives, for both domestic future activities and international customers Capital • Evaluating redemption of remaining Management high cost, fixed rate TruP • Evaluate other capital deployment Noninterest • Continue simplification of opportunities including share operations to drive expense repurchases, dividends or strategic Expenses reduction initiatives business acquisitions Committed to driving shareholder value

Appendices
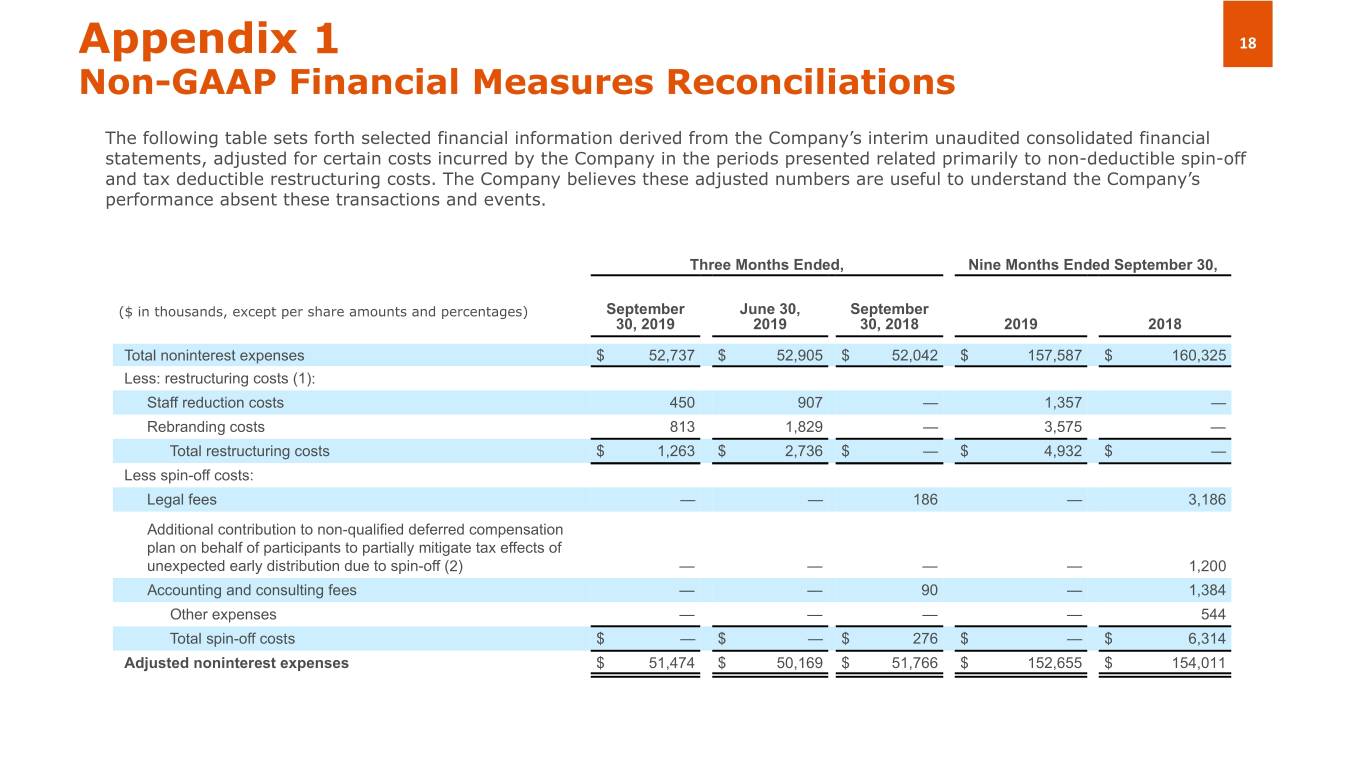
Appendix 1 18 Non-GAAP Financial Measures Reconciliations The following table sets forth selected financial information derived from the Company’s interim unaudited consolidated financial statements, adjusted for certain costs incurred by the Company in the periods presented related primarily to non-deductible spin-off and tax deductible restructuring costs. The Company believes these adjusted numbers are useful to understand the Company’s performance absent these transactions and events. Three Months Ended, Nine Months Ended September 30, ($ in thousands, except per share amounts and percentages) September June 30, September 30, 2019 2019 30, 2018 2019 2018 Total noninterest expenses $ 52,737 $ 52,905 $ 52,042 $ 157,587 $ 160,325 Less: restructuring costs (1): Staff reduction costs 450 907 — 1,357 — Rebranding costs 813 1,829 — 3,575 — Total restructuring costs $ 1,263 $ 2,736 $ — $ 4,932 $ — Less spin-off costs: Legal fees — — 186 — 3,186 Additional contribution to non-qualified deferred compensation plan on behalf of participants to partially mitigate tax effects of unexpected early distribution due to spin-off (2) — — — — 1,200 Accounting and consulting fees — — 90 — 1,384 Other expenses — — — — 544 Total spin-off costs $ — $ — $ 276 $ — $ 6,314 Adjusted noninterest expenses $ 51,474 $ 50,169 $ 51,766 $ 152,655 $ 154,011
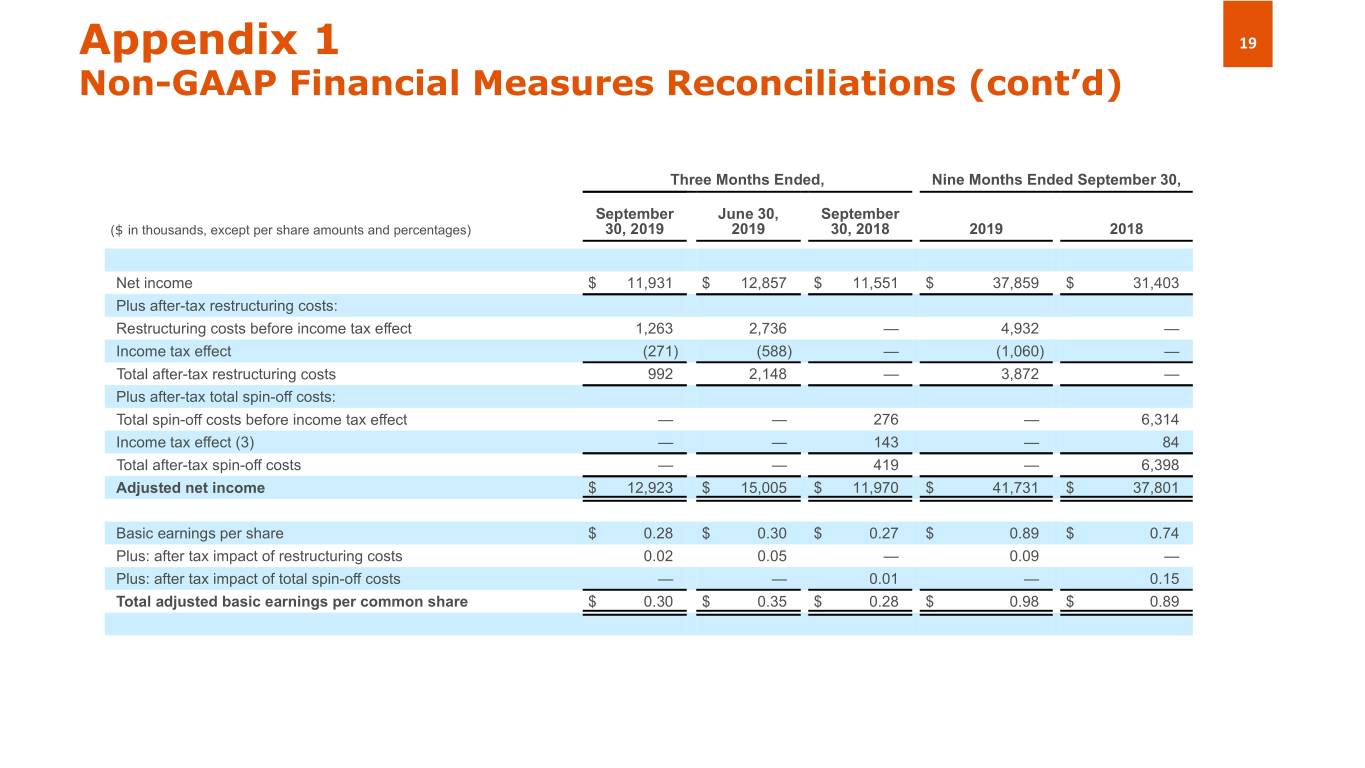
Appendix 1 19 Non-GAAP Financial Measures Reconciliations (cont’d) Three Months Ended, Nine Months Ended September 30, September June 30, September ($ in thousands, except per share amounts and percentages) 30, 2019 2019 30, 2018 2019 2018 Net income $ 11,931 $ 12,857 $ 11,551 $ 37,859 $ 31,403 Plus after-tax restructuring costs: Restructuring costs before income tax effect 1,263 2,736 — 4,932 — Income tax effect (271) (588) — (1,060) — Total after-tax restructuring costs 992 2,148 — 3,872 — Plus after-tax total spin-off costs: Total spin-off costs before income tax effect — — 276 — 6,314 Income tax effect (3) — — 143 — 84 Total after-tax spin-off costs — — 419 — 6,398 Adjusted net income $ 12,923 $ 15,005 $ 11,970 $ 41,731 $ 37,801 Basic earnings per share $ 0.28 $ 0.30 $ 0.27 $ 0.89 $ 0.74 Plus: after tax impact of restructuring costs 0.02 0.05 — 0.09 — Plus: after tax impact of total spin-off costs — — 0.01 — 0.15 Total adjusted basic earnings per common share $ 0.30 $ 0.35 $ 0.28 $ 0.98 $ 0.89
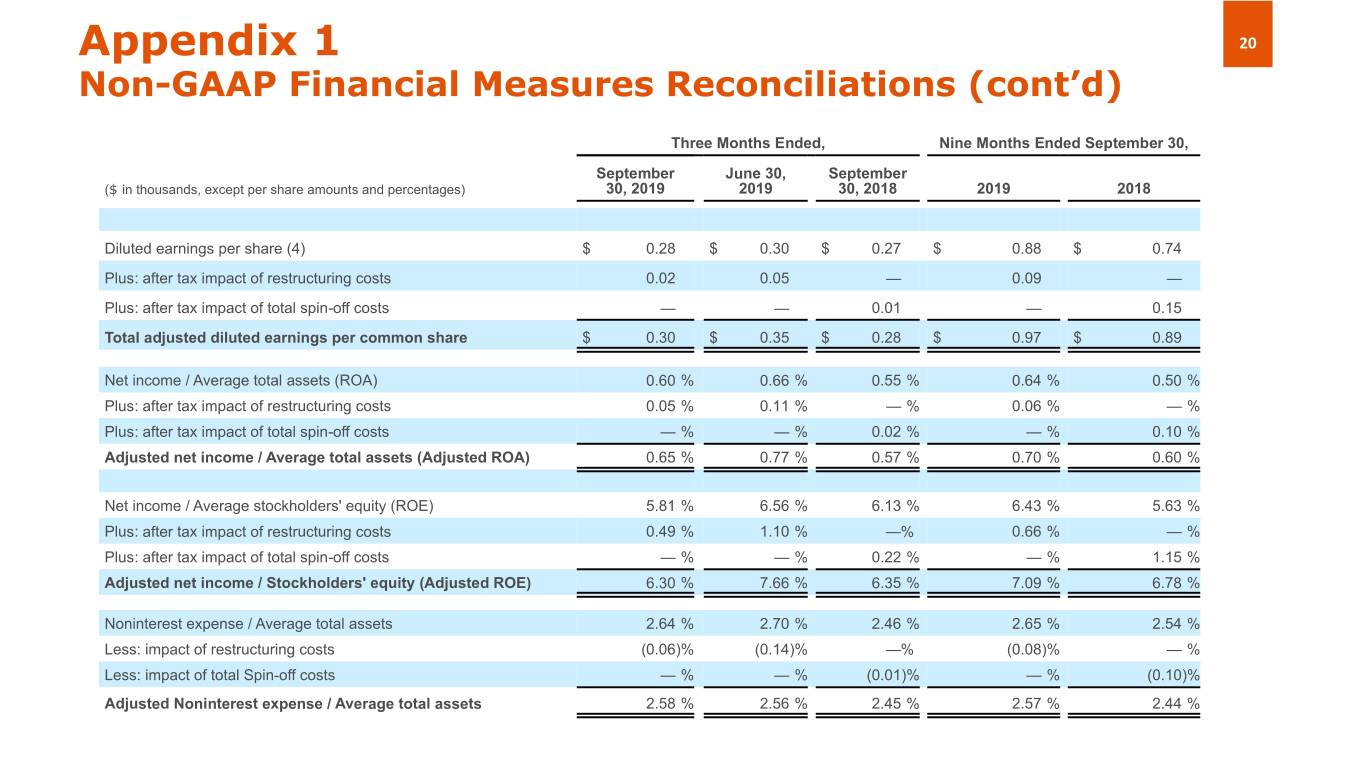
Appendix 1 20 Non-GAAP Financial Measures Reconciliations (cont’d) Three Months Ended, Nine Months Ended September 30, September June 30, September ($ in thousands, except per share amounts and percentages) 30, 2019 2019 30, 2018 2019 2018 Diluted earnings per share (4) $ 0.28 $ 0.30 $ 0.27 $ 0.88 $ 0.74 Plus: after tax impact of restructuring costs 0.02 0.05 — 0.09 — Plus: after tax impact of total spin-off costs — — 0.01 — 0.15 Total adjusted diluted earnings per common share $ 0.30 $ 0.35 $ 0.28 $ 0.97 $ 0.89 Net income / Average total assets (ROA) 0.60 % 0.66 % 0.55 % 0.64 % 0.50 % Plus: after tax impact of restructuring costs 0.05 % 0.11 % — % 0.06 % — % Plus: after tax impact of total spin-off costs — % — % 0.02 % — % 0.10 % Adjusted net income / Average total assets (Adjusted ROA) 0.65 % 0.77 % 0.57 % 0.70 % 0.60 % Net income / Average stockholders' equity (ROE) 5.81 % 6.56 % 6.13 % 6.43 % 5.63 % Plus: after tax impact of restructuring costs 0.49 % 1.10 % —% 0.66 % — % Plus: after tax impact of total spin-off costs — % — % 0.22 % — % 1.15 % Adjusted net income / Stockholders' equity (Adjusted ROE) 6.30 % 7.66 % 6.35 % 7.09 % 6.78 % Noninterest expense / Average total assets 2.64 % 2.70 % 2.46 % 2.65 % 2.54 % Less: impact of restructuring costs (0.06)% (0.14)% —% (0.08)% — % Less: impact of total Spin-off costs — % — % (0.01)% — % (0.10)% Adjusted Noninterest expense / Average total assets 2.58 % 2.56 % 2.45 % 2.57 % 2.44 %
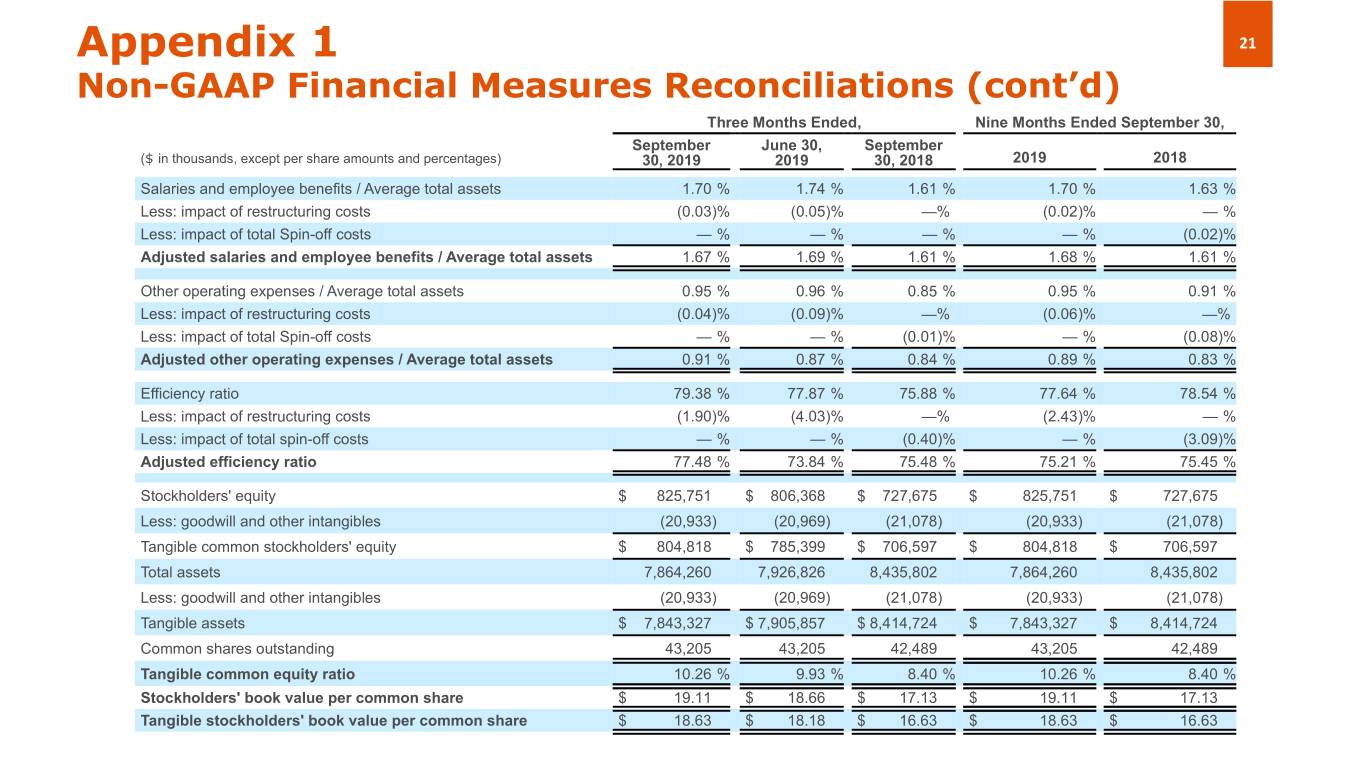
Appendix 1 21 Non-GAAP Financial Measures Reconciliations (cont’d) Three Months Ended, Nine Months Ended September 30, September June 30, September ($ in thousands, except per share amounts and percentages) 30, 2019 2019 30, 2018 2019 2018 Salaries and employee benefits / Average total assets 1.70 % 1.74 % 1.61 % 1.70 % 1.63 % Less: impact of restructuring costs (0.03)% (0.05)% —% (0.02)% — % Less: impact of total Spin-off costs — % — % — % — % (0.02)% Adjusted salaries and employee benefits / Average total assets 1.67 % 1.69 % 1.61 % 1.68 % 1.61 % Other operating expenses / Average total assets 0.95 % 0.96 % 0.85 % 0.95 % 0.91 % Less: impact of restructuring costs (0.04)% (0.09)% —% (0.06)% —% Less: impact of total Spin-off costs — % — % (0.01)% — % (0.08)% Adjusted other operating expenses / Average total assets 0.91 % 0.87 % 0.84 % 0.89 % 0.83 % Efficiency ratio 79.38 % 77.87 % 75.88 % 77.64 % 78.54 % Less: impact of restructuring costs (1.90)% (4.03)% —% (2.43)% — % Less: impact of total spin-off costs — % — % (0.40)% — % (3.09)% Adjusted efficiency ratio 77.48 % 73.84 % 75.48 % 75.21 % 75.45 % Stockholders' equity $ 825,751 $ 806,368 $ 727,675 $ 825,751 $ 727,675 Less: goodwill and other intangibles (20,933) (20,969) (21,078) (20,933) (21,078) Tangible common stockholders' equity $ 804,818 $ 785,399 $ 706,597 $ 804,818 $ 706,597 Total assets 7,864,260 7,926,826 8,435,802 7,864,260 8,435,802 Less: goodwill and other intangibles (20,933) (20,969) (21,078) (20,933) (21,078) Tangible assets $ 7,843,327 $ 7,905,857 $ 8,414,724 $ 7,843,327 $ 8,414,724 Common shares outstanding 43,205 43,205 42,489 43,205 42,489 Tangible common equity ratio 10.26 % 9.93 % 8.40 % 10.26 % 8.40 % Stockholders' book value per common share $ 19.11 $ 18.66 $ 17.13 $ 19.11 $ 17.13 Tangible stockholders' book value per common share $ 18.63 $ 18.18 $ 16.63 $ 18.63 $ 16.63
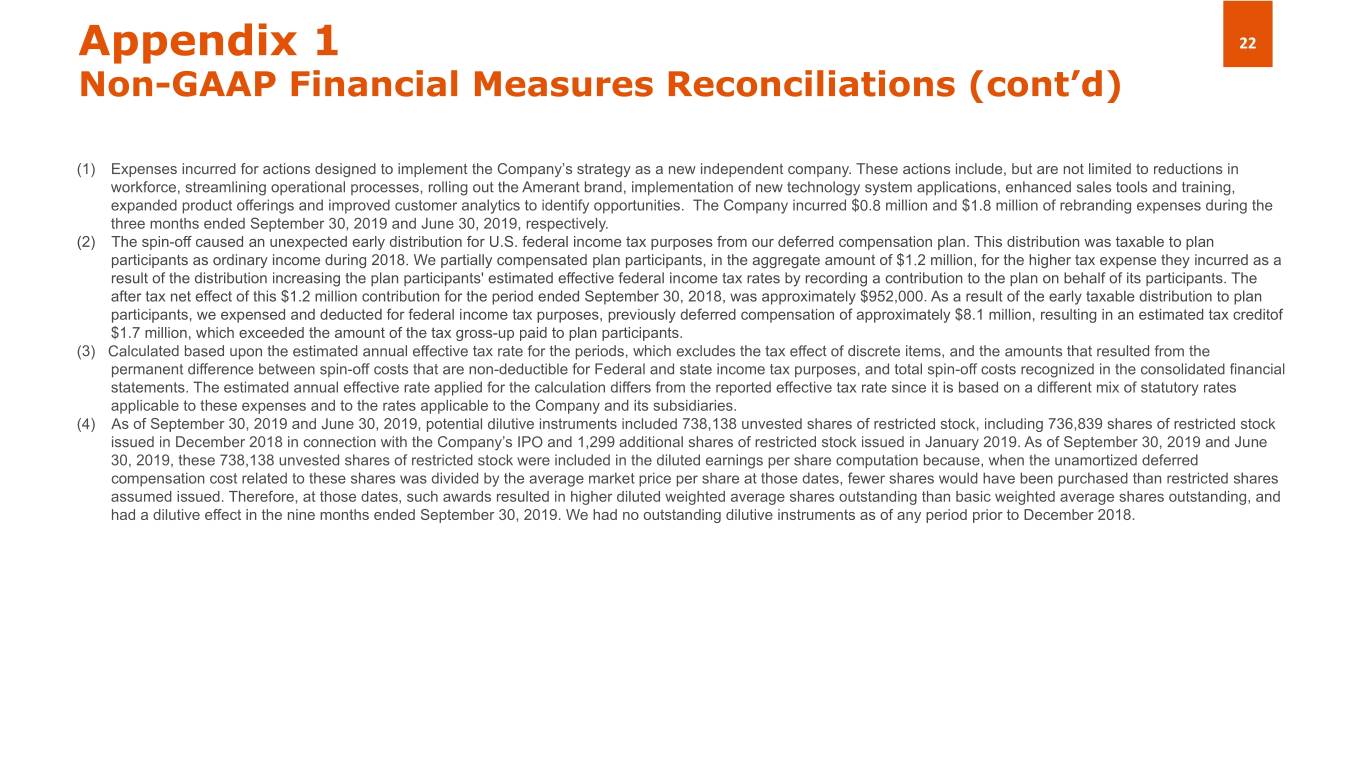
Appendix 1 22 Non-GAAP Financial Measures Reconciliations (cont’d) (1) Expenses incurred for actions designed to implement the Company’s strategy as a new independent company. These actions include, but are not limited to reductions in workforce, streamlining operational processes, rolling out the Amerant brand, implementation of new technology system applications, enhanced sales tools and training, expanded product offerings and improved customer analytics to identify opportunities. The Company incurred $0.8 million and $1.8 million of rebranding expenses during the three months ended September 30, 2019 and June 30, 2019, respectively. (2) The spin-off caused an unexpected early distribution for U.S. federal income tax purposes from our deferred compensation plan. This distribution was taxable to plan participants as ordinary income during 2018. We partially compensated plan participants, in the aggregate amount of $1.2 million, for the higher tax expense they incurred as a result of the distribution increasing the plan participants' estimated effective federal income tax rates by recording a contribution to the plan on behalf of its participants. The after tax net effect of this $1.2 million contribution for the period ended September 30, 2018, was approximately $952,000. As a result of the early taxable distribution to plan participants, we expensed and deducted for federal income tax purposes, previously deferred compensation of approximately $8.1 million, resulting in an estimated tax creditof $1.7 million, which exceeded the amount of the tax gross-up paid to plan participants. (3) Calculated based upon the estimated annual effective tax rate for the periods, which excludes the tax effect of discrete items, and the amounts that resulted from the permanent difference between spin-off costs that are non-deductible for Federal and state income tax purposes, and total spin-off costs recognized in the consolidated financial statements. The estimated annual effective rate applied for the calculation differs from the reported effective tax rate since it is based on a different mix of statutory rates applicable to these expenses and to the rates applicable to the Company and its subsidiaries. (4) As of September 30, 2019 and June 30, 2019, potential dilutive instruments included 738,138 unvested shares of restricted stock, including 736,839 shares of restricted stock issued in December 2018 in connection with the Company’s IPO and 1,299 additional shares of restricted stock issued in January 2019. As of September 30, 2019 and June 30, 2019, these 738,138 unvested shares of restricted stock were included in the diluted earnings per share computation because, when the unamortized deferred compensation cost related to these shares was divided by the average market price per share at those dates, fewer shares would have been purchased than restricted shares assumed issued. Therefore, at those dates, such awards resulted in higher diluted weighted average shares outstanding than basic weighted average shares outstanding, and had a dilutive effect in the nine months ended September 30, 2019. We had no outstanding dilutive instruments as of any period prior to December 2018.

Thank you Investor Relations InvestorRelations@amerantbank.com