
amerantbank.com Investor Update As of June 30, 2021
2 amerantbank.com Forward-Looking Statements This presentation contains “forward-looking statements” within the meaning of the Securities Act of 1933 and the Securities Exchange Act of 1934, including, statements with respect to our objectives, expectations and intentions and other statements that are not historical facts. All statements other than statements of historical fact are statements that could be forward-looking statements. You can identify these forward-looking statements through our use of words such as “may,” “will,” “anticipate,” “assume,” “should,” “indicate,” “would,” “believe,” “contemplate,” “expect,” “estimate,” “continue,” “plan,” “point to,” “project,” “could,” “intend,” “target,” “goals,” “outlooks,” “modeled,” "create" and other similar words and expressions of the future. Forward-looking statements, including those as to our beliefs, plans, objectives, goals, expectations, anticipations, estimates and intentions, involve known and unknown risks, uncertainties and other factors, which may be beyond our control, and which may cause the Company’s actual results, performance, achievements, or financial condition to be materially different from future results, performance, achievements, or financial condition expressed or implied by such forward-looking statements. You should not rely on any forward-looking statements as predictions of future events. You should not expect us to update any forward-looking statements. All written or oral forward-looking statements attributable to us are expressly qualified in their entirety by this cautionary notice, together with those risks and uncertainties described in “Risk factors” in our annual report on Form 10-K for the fiscal year ended December 31, 2020, in our quarterly report on Form 10-Q for the fiscal quarter ended June 30, 2021 and in our other filings with the U.S. Securities and Exchange Commission (the “SEC”), which are available at the SEC’s website www.sec.gov. Interim Financial Information Unaudited financial information as of and for interim periods, including as of and for the three and six month periods ended June 30, 2021 and 2020, may not reflect our results of operations for our fiscal year ending, or financial condition as of December 31, 2021, or any other period of time or date. Non-GAAP Financial Measures The Company supplements its financial results that are determined in accordance with accounting principles generally accepted in the United States of America (“GAAP”) with non-GAAP financial measures, such as "pre-provision net revenue (PPNR)", “Core pre-provision net revenue (Core PPNR)”, “core noninterest income”, “core noninterest expense”, “core net income (loss)”, “core net income (loss) per share (basic and diluted)”, “core return on assets (ROA)”, “core return on equity (ROE)”, and “core efficiency ratio”. This supplemental information is not required by, or are not presented in accordance with GAAP. The Company refers to these financial measures and ratios as “non-GAAP financial measures” and they should not be considered in isolation or as a substitute for the GAAP measures presented herein. We use certain non-GAAP financial measures, including those mentioned above, both to explain our results to shareholders and the investment community and in the internal evaluation and management of our businesses. Our management believes that these non-GAAP financial measures and the information they provide are useful to investors since these measures permit investors to view our performance using the same tools that our management uses to evaluate our past performance and prospects for future performance, especially in light of the additional costs we have incurred in connection with the Company’s restructuring activities that began in 2018 and have continued into 2021, including the effect of non-core banking activities such as the sale of loans and securities, and other non-recurring actions intended to improve customer service and operating performance. While we believe that these non-GAAP financial measures are useful in evaluating our performance, this information should be considered as supplemental and not as a substitute for or superior to the related financial information prepared in accordance with GAAP. Additionally, these non-GAAP financial measures may differ from similar measures presented by other companies. Important Notices and Disclaimers
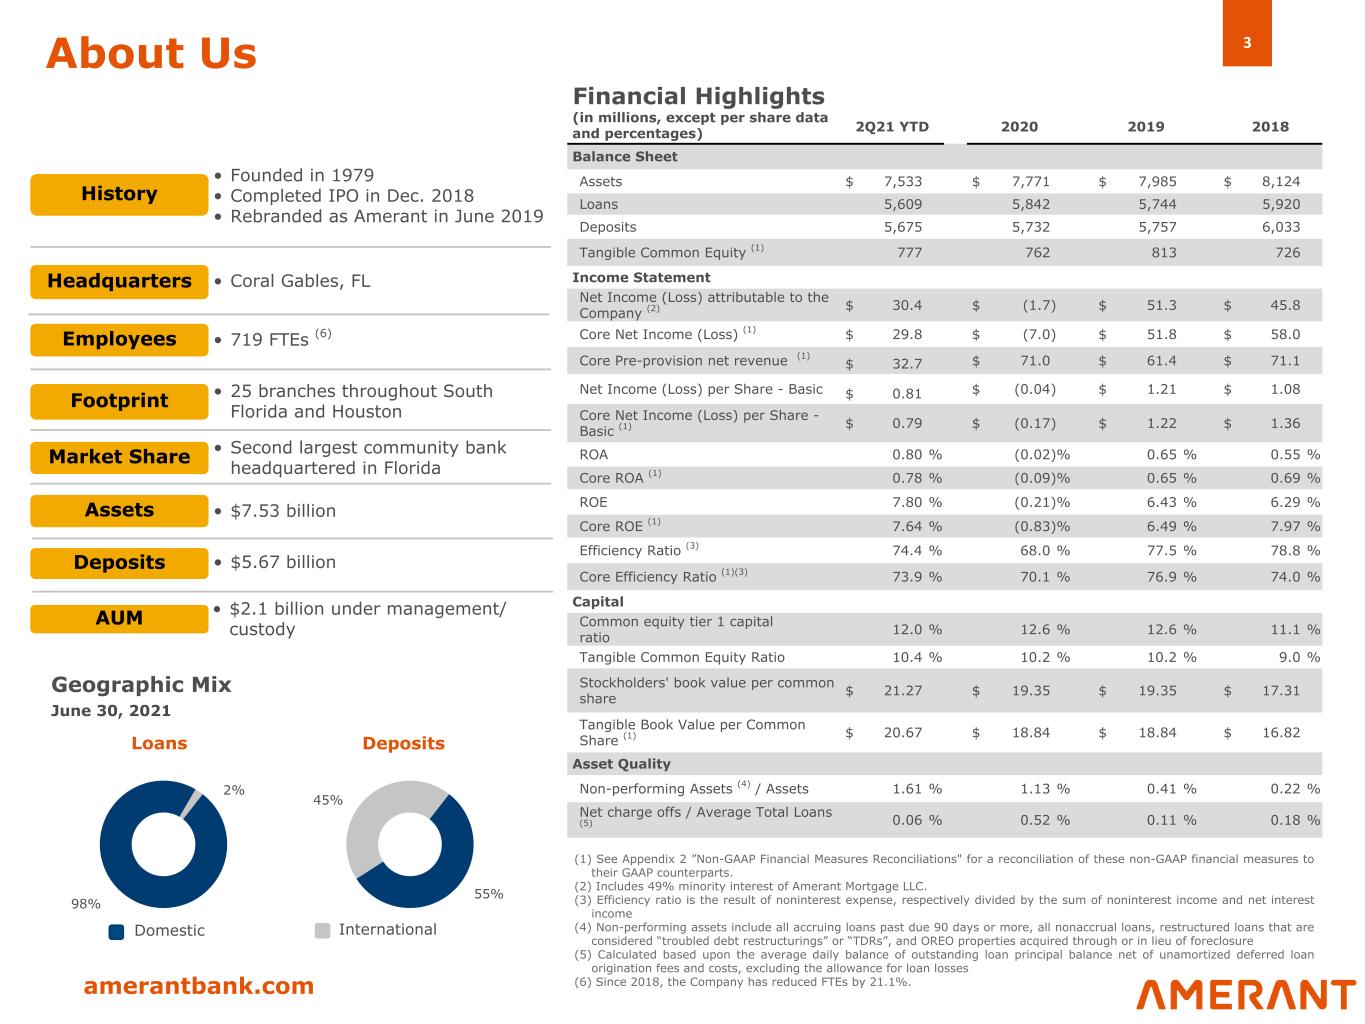
3 amerantbank.com 98% 2% 55% 45% Domestic • Second largest community bank headquartered in Florida About Us • 25 branches throughout South Florida and Houston • $5.67 billion • $7.53 billion • Coral Gables, FL • 719 FTEs (6) • $2.1 billion under management/ custody • Founded in 1979 • Completed IPO in Dec. 2018 • Rebranded as Amerant in June 2019 Footprint Assets Headquarters Employees Loans Deposits Geographic Mix Financial Highlights AUM (1) See Appendix 2 ”Non-GAAP Financial Measures Reconciliations" for a reconciliation of these non-GAAP financial measures to their GAAP counterparts. (2) Includes 49% minority interest of Amerant Mortgage LLC. (3) Efficiency ratio is the result of noninterest expense, respectively divided by the sum of noninterest income and net interest income (4) Non-performing assets include all accruing loans past due 90 days or more, all nonaccrual loans, restructured loans that are considered “troubled debt restructurings” or “TDRs”, and OREO properties acquired through or in lieu of foreclosure (5) Calculated based upon the average daily balance of outstanding loan principal balance net of unamortized deferred loan origination fees and costs, excluding the allowance for loan losses (6) Since 2018, the Company has reduced FTEs by 21.1%. Market Share History Deposits June 30, 2021 (in millions, except per share data and percentages) 2Q21 YTD 2020 2019 2018 Balance Sheet Assets $ 7,533 $ 7,771 $ 7,985 $ 8,124 Loans 5,609 5,842 5,744 5,920 Deposits 5,675 5,732 5,757 6,033 Tangible Common Equity (1) 777 762 813 726 Income Statement Net Income (Loss) attributable to the Company (2) $ 30.4 $ (1.7) $ 51.3 $ 45.8 Core Net Income (Loss) (1) $ 29.8 $ (7.0) $ 51.8 $ 58.0 Core Pre-provision net revenue (1) $ 32.7 $ 71.0 $ 61.4 $ 71.1 Net Income (Loss) per Share - Basic $ 0.81 $ (0.04) $ 1.21 $ 1.08 Core Net Income (Loss) per Share - Basic (1) $ 0.79 $ (0.17) $ 1.22 $ 1.36 ROA 0.80 % (0.02) % 0.65 % 0.55 % Core ROA (1) 0.78 % (0.09) % 0.65 % 0.69 % ROE 7.80 % (0.21) % 6.43 % 6.29 % Core ROE (1) 7.64 % (0.83) % 6.49 % 7.97 % Efficiency Ratio (3) 74.4 % 68.0 % 77.5 % 78.8 % Core Efficiency Ratio (1)(3) 73.9 % 70.1 % 76.9 % 74.0 % Capital Common equity tier 1 capital ratio 12.0 % 12.6 % 12.6 % 11.1 % Tangible Common Equity Ratio 10.4 % 10.2 % 10.2 % 9.0 % Stockholders' book value per common share $ 21.27 $ 19.35 $ 19.35 $ 17.31 Tangible Book Value per Common Share (1) $ 20.67 $ 18.84 $ 18.84 $ 16.82 Asset Quality Non-performing Assets (4) / Assets 1.61 % 1.13 % 0.41 % 0.22 % Net charge offs / Average Total Loans (5) 0.06 % 0.52 % 0.11 % 0.18 % International
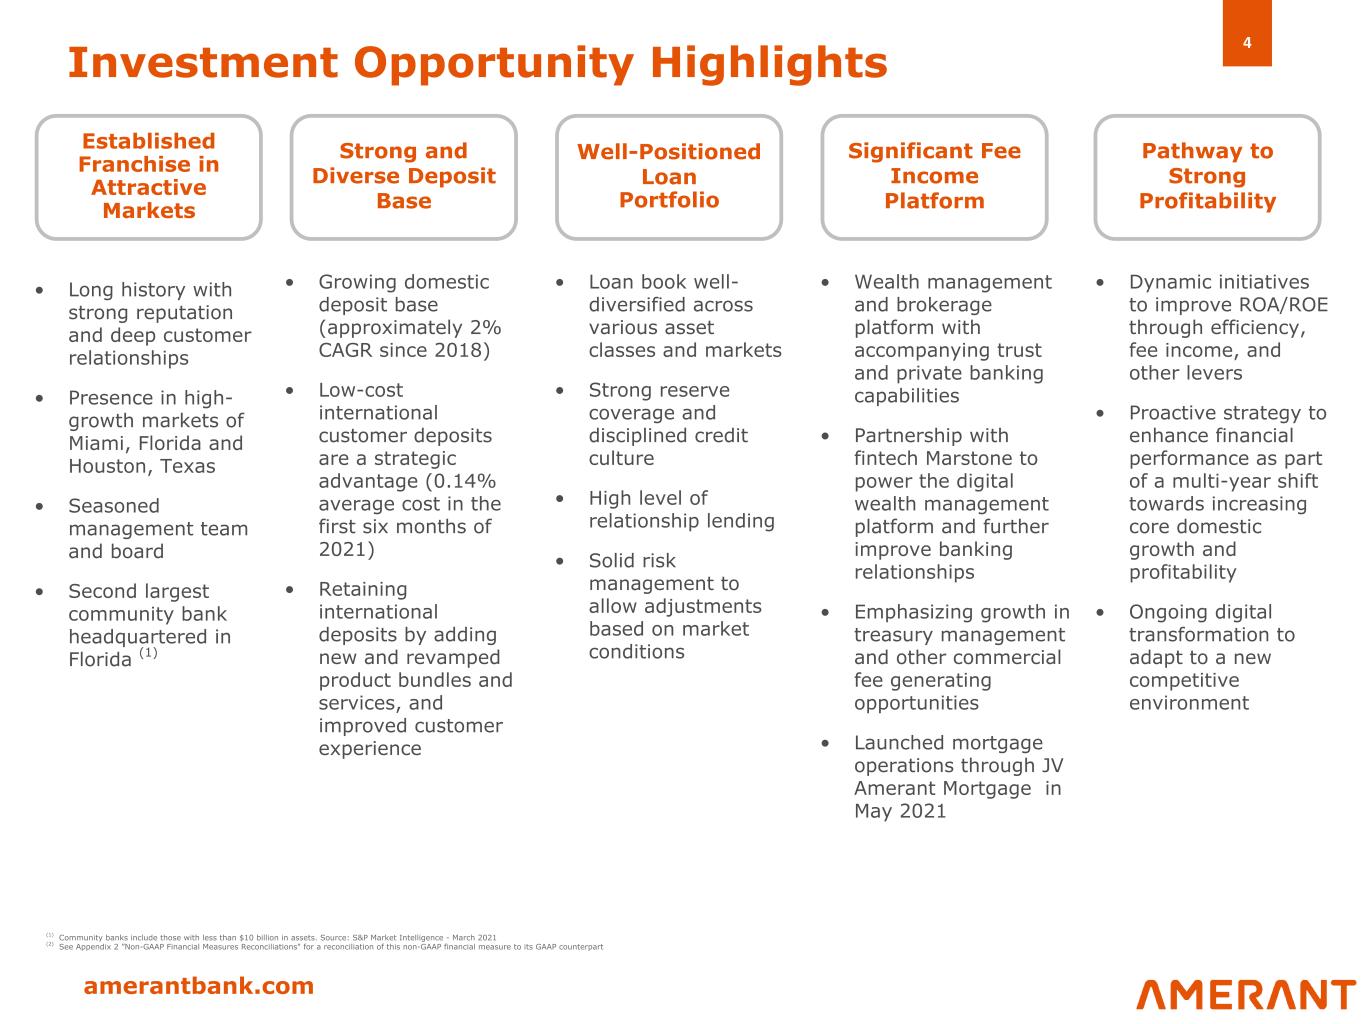
4 amerantbank.com Established Franchise in Attractive Markets Pathway to Strong Profitability Significant Fee Income Platform Well-Positioned Loan Portfolio Strong and Diverse Deposit Base Investment Opportunity Highlights • Long history with strong reputation and deep customer relationships • Presence in high- growth markets of Miami, Florida and Houston, Texas • Seasoned management team and board • Second largest community bank headquartered in Florida (1) • Growing domestic deposit base (approximately 2% CAGR since 2018) • Low-cost international customer deposits are a strategic advantage (0.14% average cost in the first six months of 2021) • Retaining international deposits by adding new and revamped product bundles and services, and improved customer experience • Loan book well- diversified across various asset classes and markets • Strong reserve coverage and disciplined credit culture • High level of relationship lending • Solid risk management to allow adjustments based on market conditions • Wealth management and brokerage platform with accompanying trust and private banking capabilities • Partnership with fintech Marstone to power the digital wealth management platform and further improve banking relationships • Emphasizing growth in treasury management and other commercial fee generating opportunities • Launched mortgage operations through JV Amerant Mortgage in May 2021 • Dynamic initiatives to improve ROA/ROE through efficiency, fee income, and other levers • Proactive strategy to enhance financial performance as part of a multi-year shift towards increasing core domestic growth and profitability • Ongoing digital transformation to adapt to a new competitive environment (1) Community banks include those with less than $10 billion in assets. Source: S&P Market Intelligence - March 2021 (2) See Appendix 2 ”Non-GAAP Financial Measures Reconciliations" for a reconciliation of this non-GAAP financial measure to its GAAP counterpart
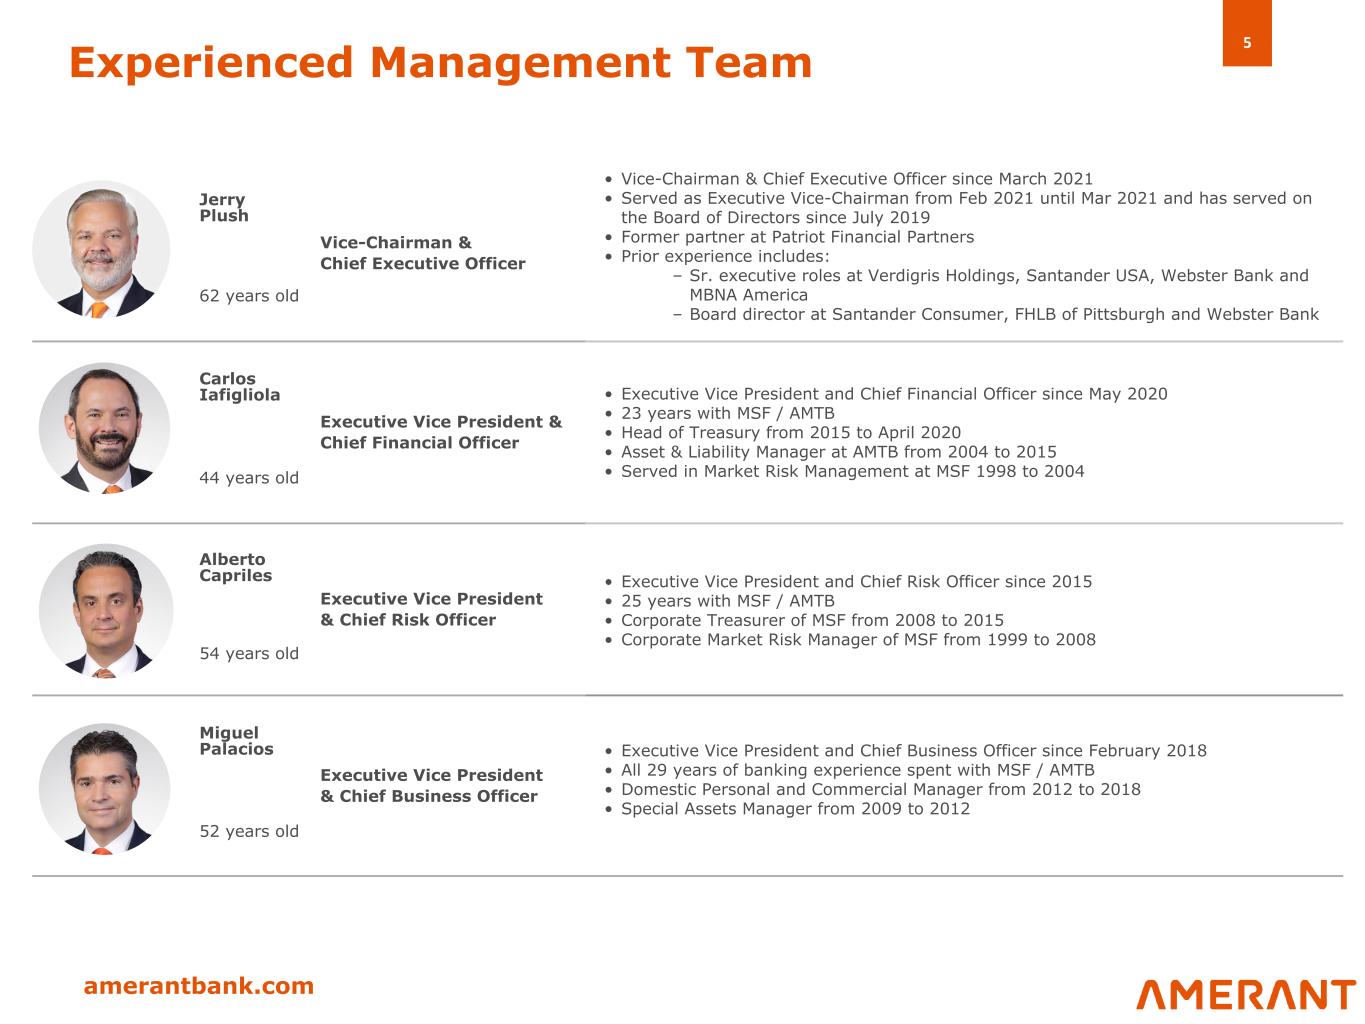
5 amerantbank.com Jerry Plush Vice-Chairman & Chief Executive Officer 62 years old Carlos Iafigliola Executive Vice President & Chief Financial Officer 44 years old Alberto Capriles Executive Vice President & Chief Risk Officer 54 years old Miguel Palacios Executive Vice President & Chief Business Officer 52 years old Experienced Management Team • Executive Vice President and Chief Business Officer since February 2018 • All 29 years of banking experience spent with MSF / AMTB • Domestic Personal and Commercial Manager from 2012 to 2018 • Special Assets Manager from 2009 to 2012 • Executive Vice President and Chief Risk Officer since 2015 • 25 years with MSF / AMTB • Corporate Treasurer of MSF from 2008 to 2015 • Corporate Market Risk Manager of MSF from 1999 to 2008 • Executive Vice President and Chief Financial Officer since May 2020 • 23 years with MSF / AMTB • Head of Treasury from 2015 to April 2020 • Asset & Liability Manager at AMTB from 2004 to 2015 • Served in Market Risk Management at MSF 1998 to 2004 • Vice-Chairman & Chief Executive Officer since March 2021 • Served as Executive Vice-Chairman from Feb 2021 until Mar 2021 and has served on the Board of Directors since July 2019 • Former partner at Patriot Financial Partners • Prior experience includes: – Sr. executive roles at Verdigris Holdings, Santander USA, Webster Bank and MBNA America – Board director at Santander Consumer, FHLB of Pittsburgh and Webster Bank
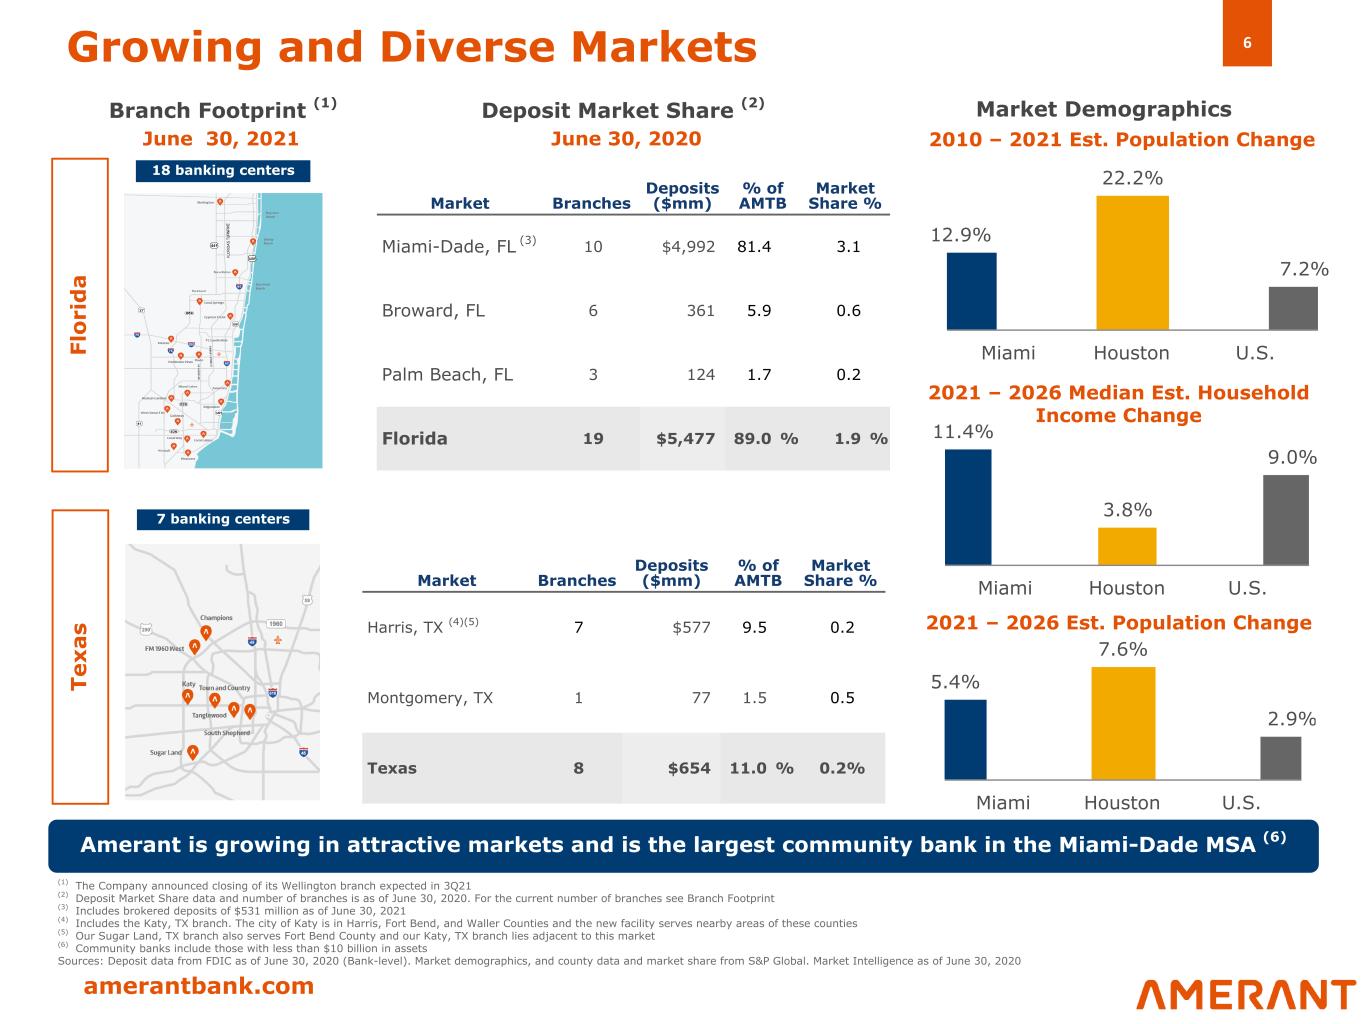
6 amerantbank.com 11.4% 3.8% 9.0% Miami Houston U.S. 5.4% 7.6% 2.9% Miami Houston U.S. Te xa s 12.9% 22.2% 7.2% Miami Houston U.S. June 30, 2020 Growing and Diverse Markets (1) The Company announced closing of its Wellington branch expected in 3Q21 (2) Deposit Market Share data and number of branches is as of June 30, 2020. For the current number of branches see Branch Footprint (3) Includes brokered deposits of $531 million as of June 30, 2021 (4) Includes the Katy, TX branch. The city of Katy is in Harris, Fort Bend, and Waller Counties and the new facility serves nearby areas of these counties (5) Our Sugar Land, TX branch also serves Fort Bend County and our Katy, TX branch lies adjacent to this market (6) Community banks include those with less than $10 billion in assets Sources: Deposit data from FDIC as of June 30, 2020 (Bank-level). Market demographics, and county data and market share from S&P Global. Market Intelligence as of June 30, 2020 Amerant is growing in attractive markets and is the largest community bank in the Miami-Dade MSA (6) Deposit Market Share (2) Market Demographics Market Branches Deposits ($mm) % of AMTB Market Share % Miami-Dade, FL (3) 10 $4,992 81.4 3.1 Broward, FL 6 361 5.9 0.6 Palm Beach, FL 3 124 1.7 0.2 Florida 19 $5,477 89.0 % 1.9 % Market Branches Deposits ($mm) % of AMTB Market Share % Harris, TX (4)(5) 7 $577 9.5 0.2 Montgomery, TX 1 77 1.5 0.5 Texas 8 $654 11.0 % 0.2% Branch Footprint (1) Fl or id a 2010 – 2021 Est. Population Change 2021 – 2026 Median Est. Household Income Change 2021 – 2026 Est. Population Change 7 banking centers 18 banking centers June 30, 2021
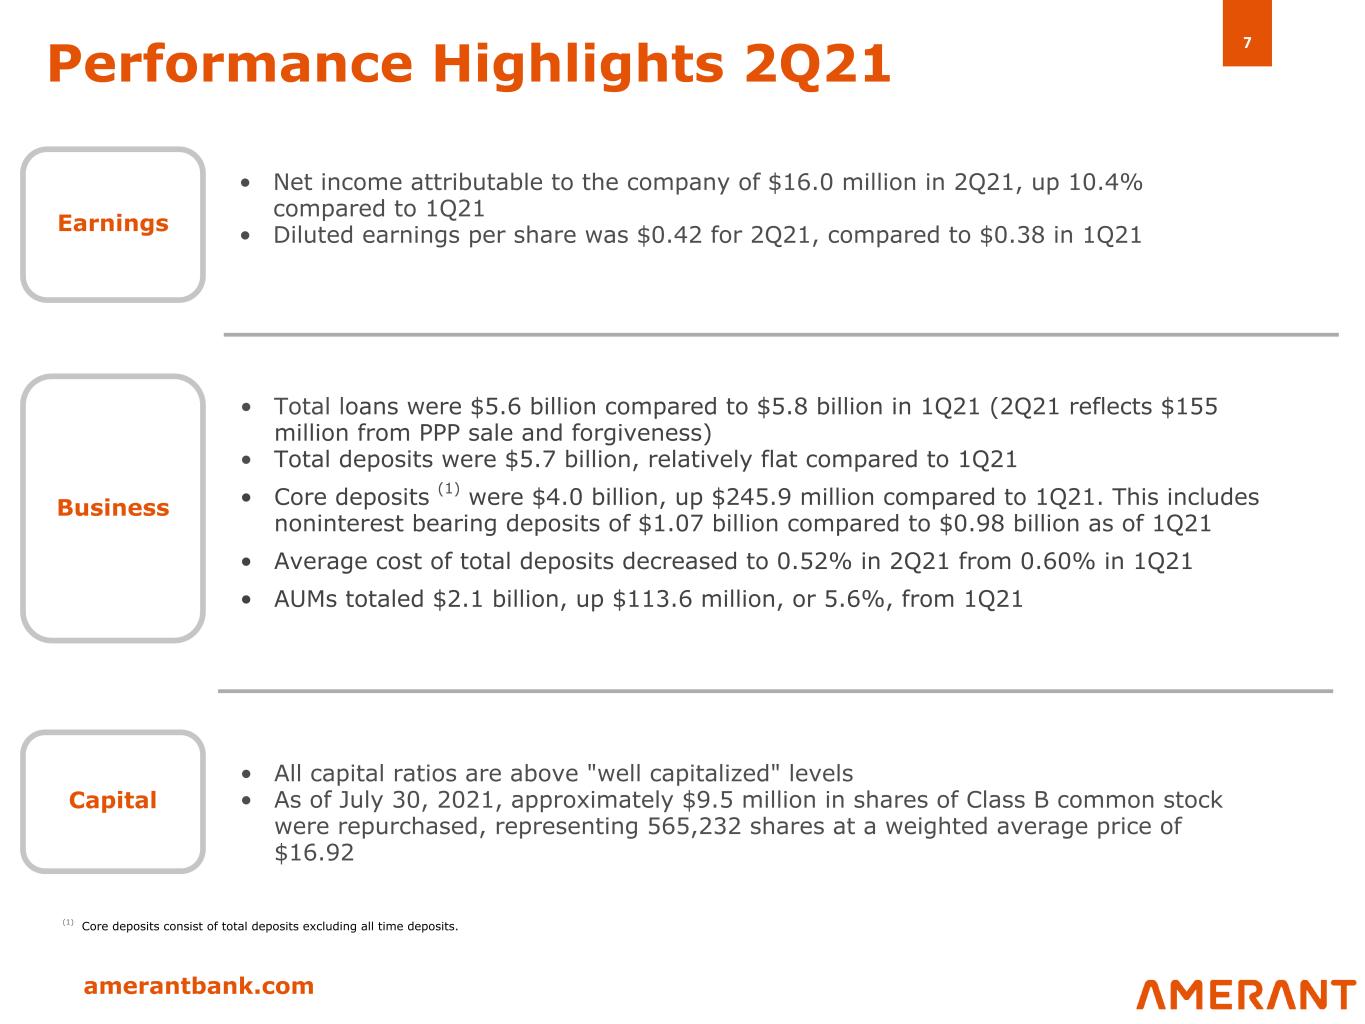
7 amerantbank.com Performance Highlights 2Q21 • All capital ratios are above "well capitalized" levels • As of July 30, 2021, approximately $9.5 million in shares of Class B common stock were repurchased, representing 565,232 shares at a weighted average price of $16.92 Capital Business • Net income attributable to the company of $16.0 million in 2Q21, up 10.4% compared to 1Q21 • Diluted earnings per share was $0.42 for 2Q21, compared to $0.38 in 1Q21 • Total loans were $5.6 billion compared to $5.8 billion in 1Q21 (2Q21 reflects $155 million from PPP sale and forgiveness) • Total deposits were $5.7 billion, relatively flat compared to 1Q21 • Core deposits (1) were $4.0 billion, up $245.9 million compared to 1Q21. This includes noninterest bearing deposits of $1.07 billion compared to $0.98 billion as of 1Q21 • Average cost of total deposits decreased to 0.52% in 2Q21 from 0.60% in 1Q21 • AUMs totaled $2.1 billion, up $113.6 million, or 5.6%, from 1Q21 Earnings (1) Core deposits consist of total deposits excluding all time deposits.
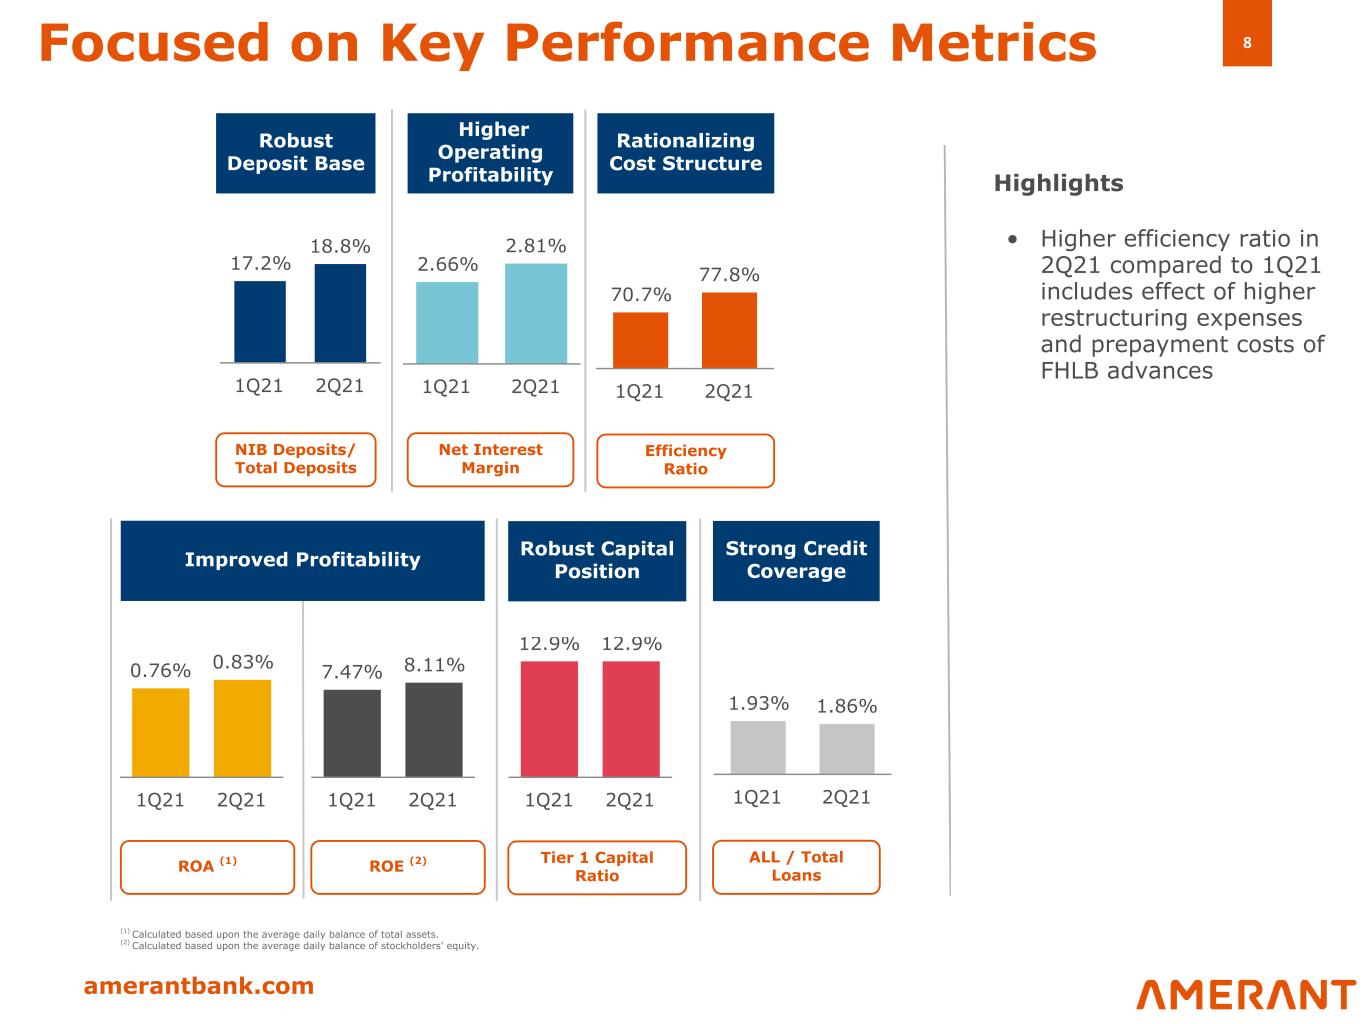
8 amerantbank.com Focused on Key Performance Metrics 70.7% 77.8% 1Q21 2Q21 17.2% 18.8% 1Q21 2Q21 12.9% 12.9% 1Q21 2Q21 2.66% 2.81% 1Q21 2Q21 Robust Deposit Base Robust Capital Position Higher Operating Profitability Rationalizing Cost Structure 1.93% 1.86% 1Q21 2Q21 Strong Credit Coverage 0.76% 0.83% 1Q21 2Q21 Improved Profitability 7.47% 8.11% 1Q21 2Q21 NIB Deposits/ Total Deposits Tier 1 Capital Ratio Net Interest Margin Efficiency Ratio ALL / Total LoansROA (1) ROE (2) • Higher efficiency ratio in 2Q21 compared to 1Q21 includes effect of higher restructuring expenses and prepayment costs of FHLB advances (1) Calculated based upon the average daily balance of total assets. (2) Calculated based upon the average daily balance of stockholders' equity. Highlights

9 amerantbank.com 88.1% 11.9% U.S. Gov't sponsored enterprises 45.5% U.S. Gov't agency 23.8% Municipals 0.2% Corporate debt 30.2% US treasury 0.2% $1,519.8 $1,190.2 $1,194.1 $65.6 $104.7 $93.3 $24.4 $24.0 $24.0 2.38% 2.15% 2.14% 2Q20 1Q21 2Q21 0 500 1,000 1,500 84.8% 15.2% • Effective duration decreased vs. 1Q21 due to higher expected prepayments driven by the decline in long term rates during 2Q21 Investment Portfolio Balances and Yields (1) Available for Sale (AFS) Held to Maturity (HTM) Highlights Fixed vs. Floating Jun. 2020 (2) Jun. 2021 Floating rate Fixed rate Available for Sale Securities by Type June 30, 2021 2.6 yrs Effective Duration ($ in millions) Marketable Equity Securities (1) Excludes Federal Reserve Bank and FHLB stock (2) Hybrid investments are classified based on current rate (fixed or float). The Company revised its classification of securities by rate type in 3Q20. Prior year information has been revised for comparative purposes, resulting in a change from 16.9% (floating) and 83.1% (fixed) as previously reported in 2Q20 Yield 3.0 yrs Effective Duration

10 amerantbank.com 50.2% 50.4% 48.6% 48.5% 48.5% 21.5% 20.5% 20.1% 19.5% 18.1% 16.0% 15.8% 16.2% 16.3% 16.8% 10.1% 10.1% 10.9% 10.9% 11.0% 2.2% 3.2% 4.2% 4.8% 5.5% 3.77% 3.64% 3.76% 3.77% 3.89% 2Q20 3Q20 4Q20 1Q21 2Q21 66.3% 66.5% 66.2% 66.1% 65.5% 17.8% 17.9% 17.8% 18.0% 18.4% 12.9% 12.6% 12.9% 12.9% 13.1% 3.0% 3.0% 3.1% 3.0% 3.0% 2Q20 3Q20 4Q20 1Q21 2Q21 Consumer CRE Commercial and FI & Acceptances Owner Occupied Single Family Residential Loan Portfolio Highlights Loan Composition Geographic Mix (Domestic) • Lower loan balances resulting from high level of prepayments in both CRE and C&I, including forgiveness and sale of PPP loans • PPP loans outstanding at 2Q21 were $23.6 million, or 0.4% of total loans, compared to $164.8 million, or 2.9% of total loans as of 1Q21 • Processed $59.9 million of forgiveness applications and sold $95.1 million of PPP loans during 2Q21 • Consumer loans include $62 million in higher-yielding indirect U.S. consumer loans purchased during 2Q21 Florida Texas New York Average Loan Yield Other (1) (1) Includes international loans, loans held for sale and certain loans based on country of risk.

11 amerantbank.com $119.7 $116.8 $110.9 $110.9 $104.2 2.04% 1.97% 1.90% 1.93% 1.86% 2Q20 3Q20 4Q20 1Q21 2Q21 0.13% 1.41% 0.40% —% 0.12% 2Q20 3Q20 4Q20 1Q21 2Q21 • Credit quality remains sound and reserve coverage is strong; released $5.0 million from the allowance for loan losses in 2Q21 • The quarter-over-quarter increase in NPA to total assets primarily driven by the downgrade of three CRE loans totaling $40.0 million and lower total assets • The majority of NPLs have recent independent third-party collateral valuations supporting current ALL levels. No additional loan loss reserves were deemed necessary as a result of these valuations. Covid-related LLP was $14.8 million as of 2Q21 Net Charge-Offs / Average Total Loans (2) Credit Quality Allowance for Loan Losses ($ in millions) Non-Performing Assets (1) / Total Assets Allowance for Loan Losses / Total NPL Allowance for Loan Losses ALL as a % of Total Loans (1) Non-performing assets include all accruing loans past due 90 days or more, all nonaccrual loans, restructured loans that are considered TDRs, and OREO properties acquired through or in lieu of foreclosure. (2) Annualized and calculated based upon the average daily balance of outstanding loan principal balance net of unamortized deferred loan fees and costs, excluding the allowance for loan losses. During the third quarter of 2020, the Company charged off $19.3 million against the allowance for loan losses as result of the deterioration of one commercial loan relationship. 0.95% 1.08% 1.13% 1.16% 1.61% 2Q20 3Q20 4Q20 1Q21 2Q21 1.6x 1.4x 1.3x 1.2x 0.9x 2Q20 3Q20 4Q20 1Q21 2Q21
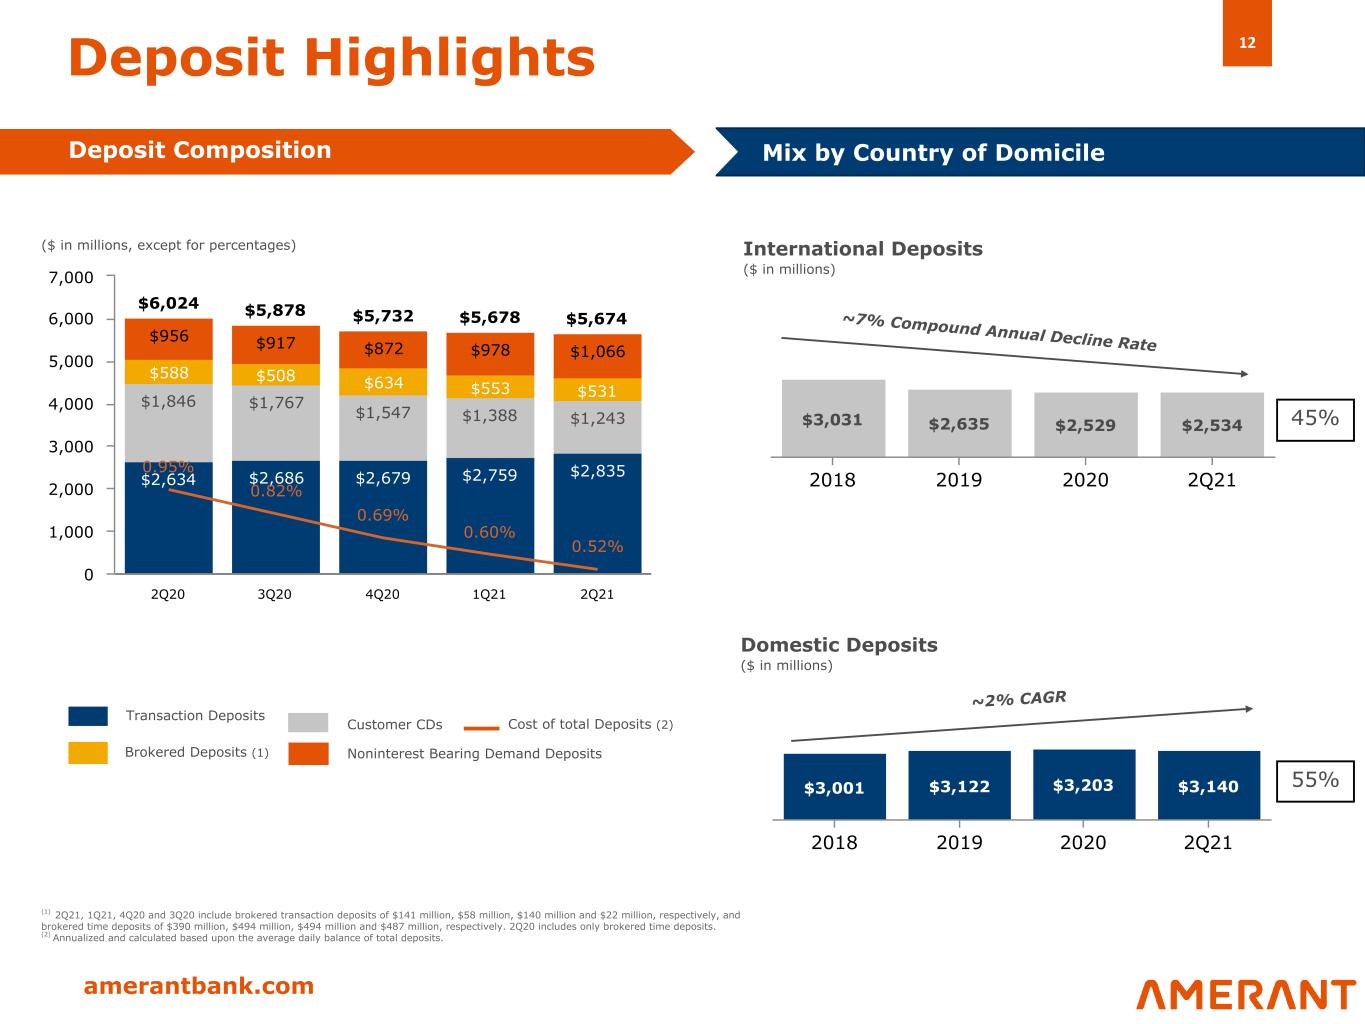
12 amerantbank.com $6,024 $5,878 $5,732 $5,678 $5,674 $2,634 $2,686 $2,679 $2,759 $2,835 $1,846 $1,767 $1,547 $1,388 $1,243 $588 $508 $634 $553 $531 $956 $917 $872 $978 $1,066 0.95% 0.82% 0.69% 0.60% 0.52% 2Q20 3Q20 4Q20 1Q21 2Q21 0 1,000 2,000 3,000 4,000 5,000 6,000 7,000 $3,031 $2,635 $2,529 $2,534 2018 2019 2020 2Q21 $3,001 $3,122 $3,203 $3,140 2018 2019 2020 2Q21 ~2% CAGR Domestic Deposits ($ in millions) ~7% Compound Annual Decline Rate Deposit Highlights Deposit Composition 55% International Deposits ($ in millions) Mix by Country of Domicile Transaction Deposits Customer CDs Brokered Deposits (1) Cost of total Deposits (2) ($ in millions, except for percentages) 45% (1) 2Q21, 1Q21, 4Q20 and 3Q20 include brokered transaction deposits of $141 million, $58 million, $140 million and $22 million, respectively, and brokered time deposits of $390 million, $494 million, $494 million and $487 million, respectively. 2Q20 includes only brokered time deposits. (2) Annualized and calculated based upon the average daily balance of total deposits. Noninterest Bearing Demand Deposits

13 amerantbank.com $46.3 $45.4 $48.7 $47.6 $50.0 2.44% 2.39% 2.61% 2.66% 2.81% Net Interest Income NIM 2Q20 3Q20 4Q20 1Q21 2Q21 0 10 20 30 40 50 60 NII increased in 2Q21 primarily due to: • Higher average loan yields • Lower overall cost of customer deposits • Reduced customer and brokered CD volumes • Lower cost and volumes on FHLB Advances – Repaid $235 million – Modified rate on $285 million fixed-rate advances NII offset in 2Q21 primarily by: • Lower average loan volumes due to higher prepayments and lower loan production Net Interest Income and NIM Net Interest Income (NII) and NIM (%) Commentary ($ in millions, except for percentages)
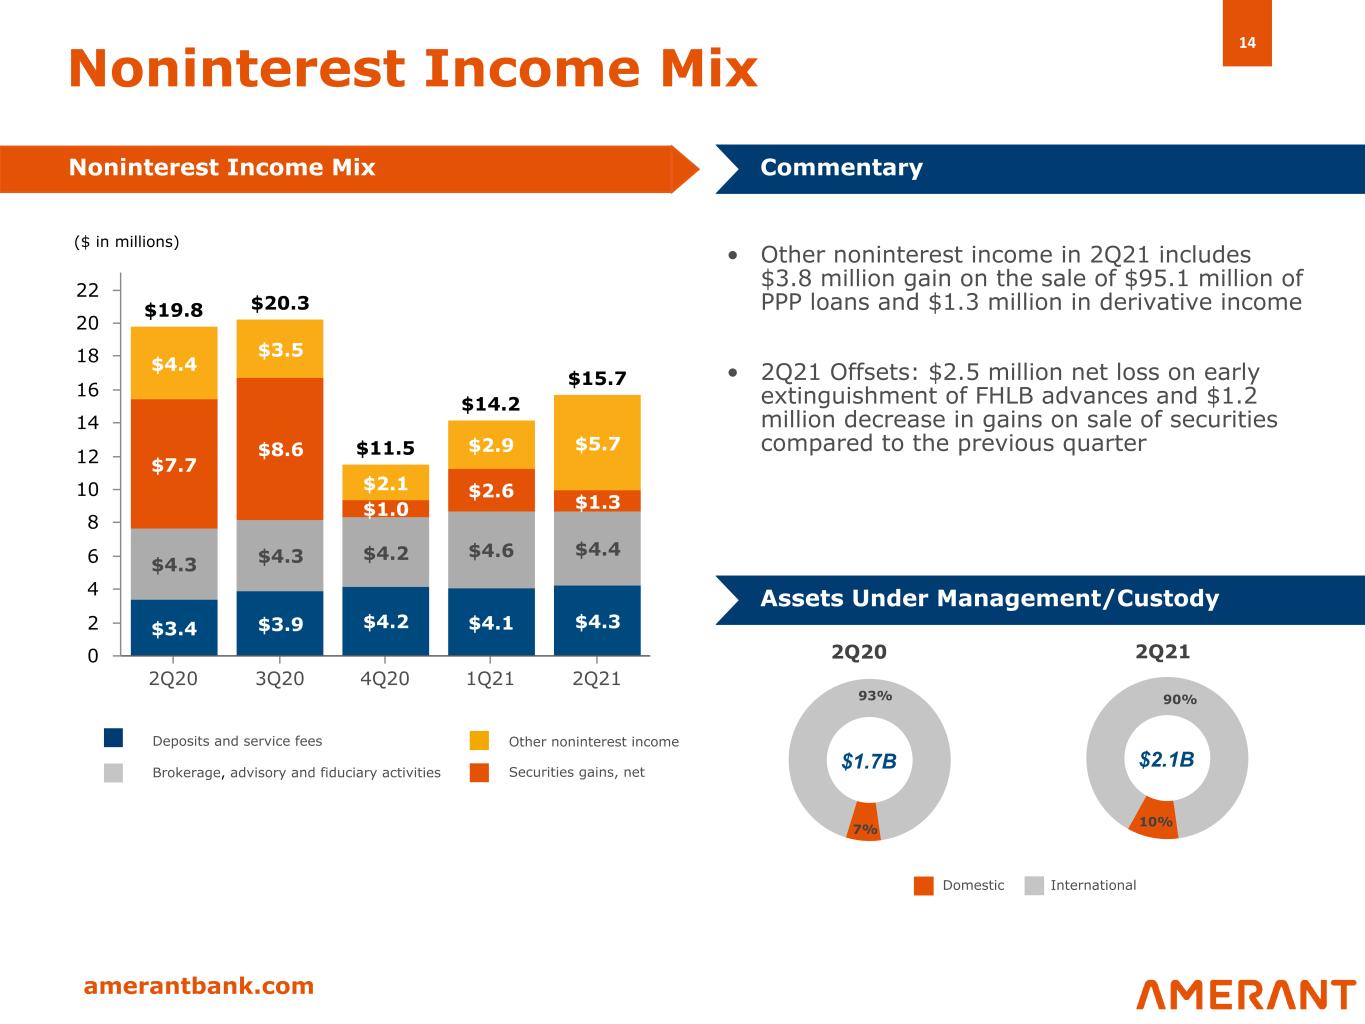
14 amerantbank.com $19.8 $20.3 $11.5 $14.2 $15.7 $3.4 $3.9 $4.2 $4.1 $4.3 $4.3 $4.3 $4.2 $4.6 $4.4 $7.7 $8.6 $1.0 $2.6 $1.3 $4.4 $3.5 $2.1 $2.9 $5.7 2Q20 3Q20 4Q20 1Q21 2Q21 0 2 4 6 8 10 12 14 16 18 20 22 7% 93% 10% 90% Noninterest Income Mix Noninterest Income Mix Commentary • Other noninterest income in 2Q21 includes $3.8 million gain on the sale of $95.1 million of PPP loans and $1.3 million in derivative income • 2Q21 Offsets: $2.5 million net loss on early extinguishment of FHLB advances and $1.2 million decrease in gains on sale of securities compared to the previous quarter Assets Under Management/Custody Deposits and service fees Brokerage, advisory and fiduciary activities Other noninterest income $2.1B Domestic International 2Q212Q20 $1.7B ($ in millions) Securities gains, net

15 amerantbank.com Increase in noninterest expense in 2Q21 primarily due to: • Higher salaries and employee benefits due to increased severance costs • Higher recruitment fees and addition of 49 new FTEs, primarily for business lines including Amerant Mortgage • Increased advertising expenses (primarily HELOC Campaign) $36.7 $45.5 $51.6 $43.6 $51.1 $21.6 $28.3 $32.3 $26.4 $30.8$15.1 $17.2 $19.3 $17.2 $20.3 825 807 713 731 719 2Q20 3Q20 4Q20 1Q21 2Q21 10 20 30 40 50 60 Noninterest Expense Noninterest Expense Mix Commentary Other operating expenses Salaries and employee benefits FTE ($ in millions, except for FTEs) FTEs by company 2Q20 3Q20 4Q20 1Q21 2Q21 Amerant Bank and other subsidiaries 825 807 709 721 681 Amerant Mortgage — — 4 10 38 TOTAL 825 807 713 731 719
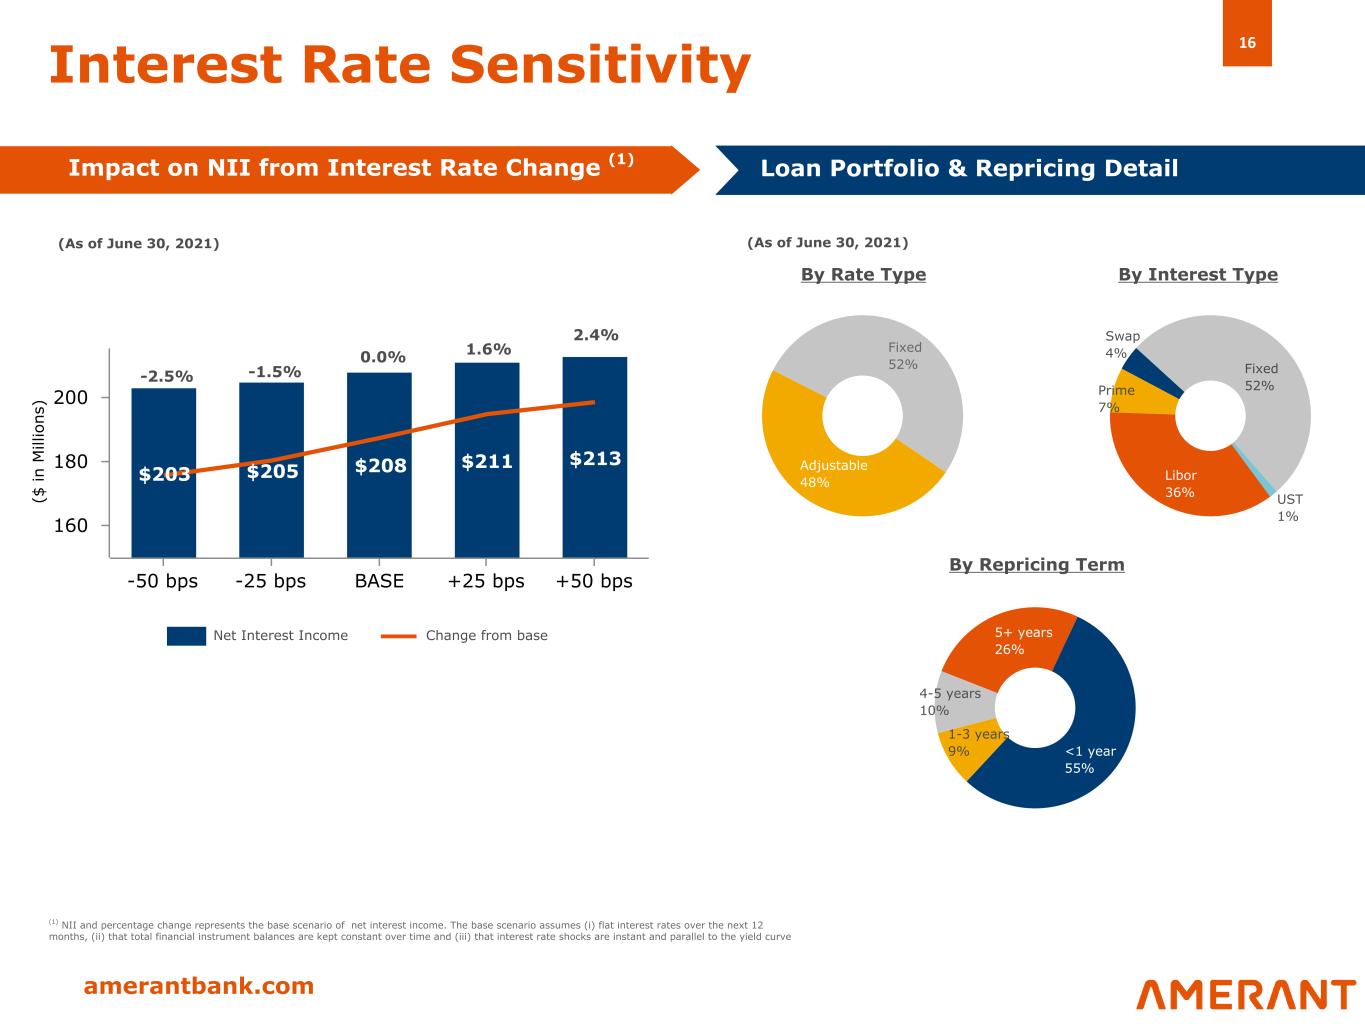
16 amerantbank.com $203 $205 $208 $211 $213 -50 bps -25 bps BASE +25 bps +50 bps 160 180 200 (As of June 30, 2021) Fixed 52% Adjustable 48% Interest Rate Sensitivity By Interest TypeBy Rate Type By Repricing Term (1) NII and percentage change represents the base scenario of net interest income. The base scenario assumes (i) flat interest rates over the next 12 months, (ii) that total financial instrument balances are kept constant over time and (iii) that interest rate shocks are instant and parallel to the yield curve Loan Portfolio & Repricing Detail Impact on NII from Interest Rate Change (1) Net Interest Income Change from base <1 year 55% 1-3 years 9% 4-5 years 10% 5+ years 26% -2.5% -1.5% 0.0% 2.4% 1.6% ($ in M ill io ns ) (As of June 30, 2021) Swap 4% Fixed 52% UST 1% Libor 36% Prime 7%
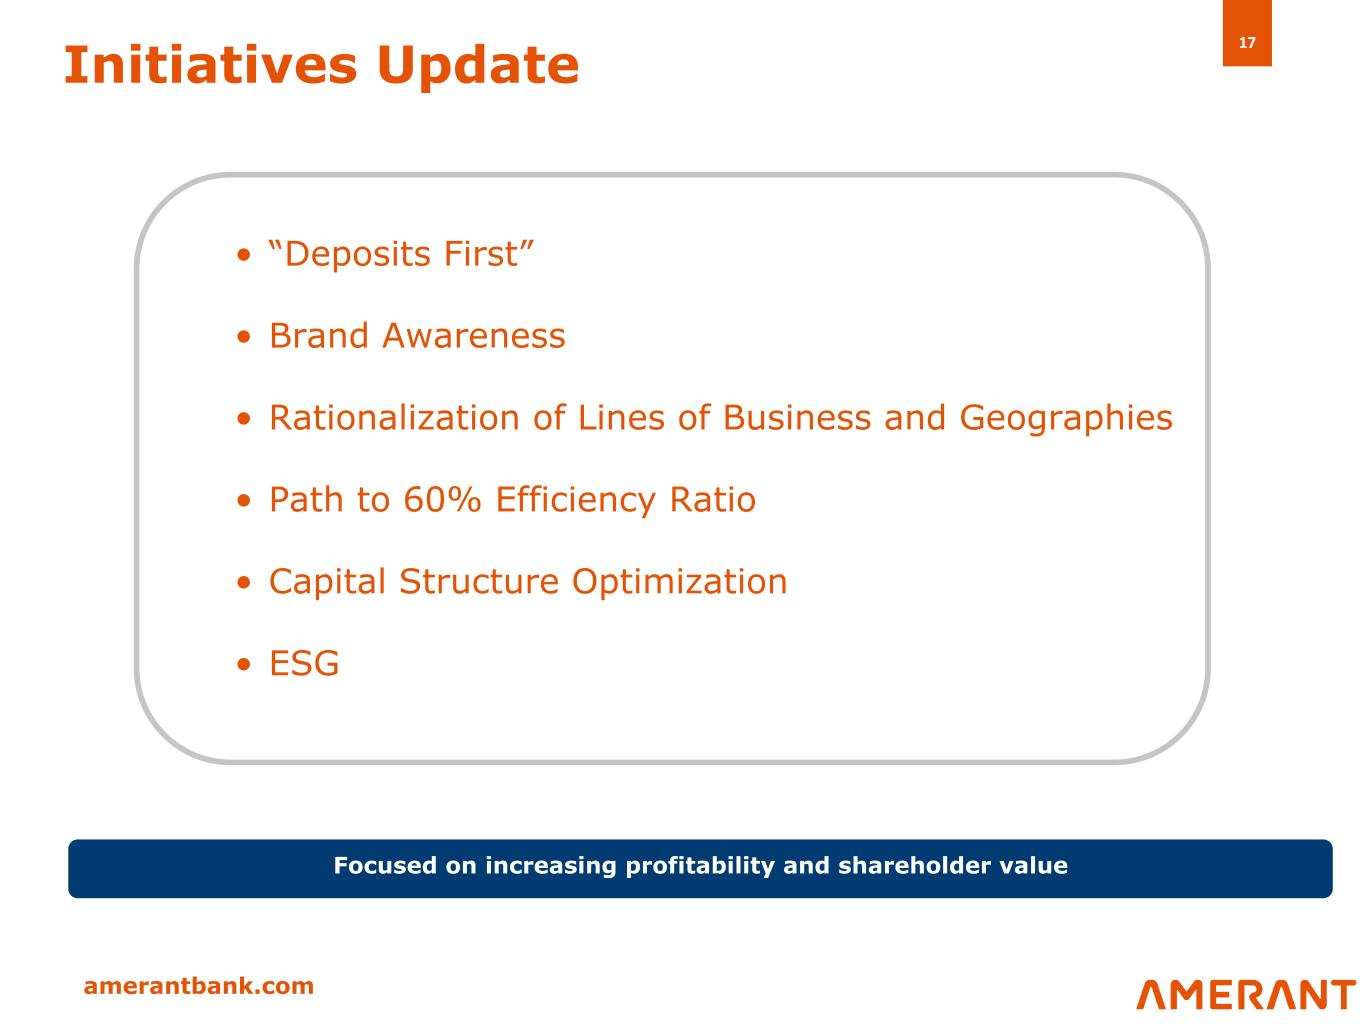
17 amerantbank.com Initiatives Update • “Deposits First” • Brand Awareness • Rationalization of Lines of Business and Geographies • Path to 60% Efficiency Ratio • Capital Structure Optimization • ESG Focused on increasing profitability and shareholder value

amerantbank.com Supplemental Loan Portfolio Information

19 amerantbank.com Deferrals & Forbearance Update • 4 customers remaining totaling $54MM or 1.0% of total loans vs. 21.4% at 6/5/20 peak • All in CRE NY: 2 CRE retail $41MM, 1 CRE office with ground floor retail $8MM and 1 multifamily $5MM • Decrease compared to Q1 2021 due to 2 CRE multifamily $7.1MM, forbearance expired and payment resumed as scheduled • All requests are secured with RE collateral (Wavg. LTV 83%) • Have received 98.9% of payments due for loans that have resumed their regular payments Relief Requests Summary Continue to monitor credit quality and effectively reduce loans under deferral and/or forbearance CRE requests as % of their respective portfolio:

20 amerantbank.com Loan portfolio by industry • Diversified portfolio - highest sector concentration, other than real estate, at 10.2% of total loans • 77% of total loans secured by real estate • Main concentrations: CRE or Commercial Real Estate / Wholesale - Food / Retail - Gas stations / Services – Healthcare, Repair and Maintenance Highlights (1) Consists mainly of finance facilities granted to non-bank financial companies. (2) Comprised mostly of construction and real estate related services and equipment rental and leasing activities (3) Food wholesalers represented approximately 43% (4) Gasoline stations represented approximately 63% (5) Healthcare represented approximately 64% (6) Other repair and maintenance services represented 61% (7) Primarily residential, consumer loans, and cash secured loans and loans belonging to industrial sectors not included in the above sectors, which do not individually represent more than 1 percent of the total loans portfolio (8) Not all unfunded commitments are unilaterally available to borrowers. For example, certain revolving loans and asset based lending loans require borrowers to provide additional collateral to access the full amount of the commitment ($ in millions) Real Estate Non-Real Estate Total % Total Loans Unfunded Commitments(8) Financial Sector (1) $ 5 $ 58 $ 63 1.1 % 2 4 $ 10 Construction and Real Estate & Leasing: Commercial real estate loans 2,719 — 2,719 48.6 % 190 Other real estate related services and equipment leasing (2) 56 54 110 2.0 % 23 Total construction and real estate & leasing 2,775 54 2,829 50.6 % 213 Manufacturing: Foodstuffs, Apparel 73 29 102 1.8 % 5 Metals, Computer, Transportation and Other 16 112 128 2.3 % 25 Chemicals, Oil, Plastics, Cement and Wood/Paper 24 25 49 0.9 % 5 Total Manufacturing 113 166 279 5.0 % 35 Wholesale (3) 166 402 568 10.2 % 121 Retail Trade (4) 259 99 358 6.4 % 51 Services: Communication, Transportation, Health and Other (5) 257 100 357 6.4 % 38 Accommodation, Restaurants, Entertainment and other services (6) 81 63 144 2.6 % 26 Electricity, Gas, Water, Supply and Sewage Services 6 13 19 0.4 % 6 Total Services 344 176 520 9.4 % 70 Primary Products: Agriculture, Livestock, Fishing and Forestry — 1 1 — % — Mining — 6 6 0.1 % 1 Total Primary Products — 7 7 0.1 % 1 Other Loans (7) 617 342 959 17.2 % 221 Total Loans $ 4,279 $ 1,304 $ 5,583 100.0 % $ 721 (Jun 30, 2021)
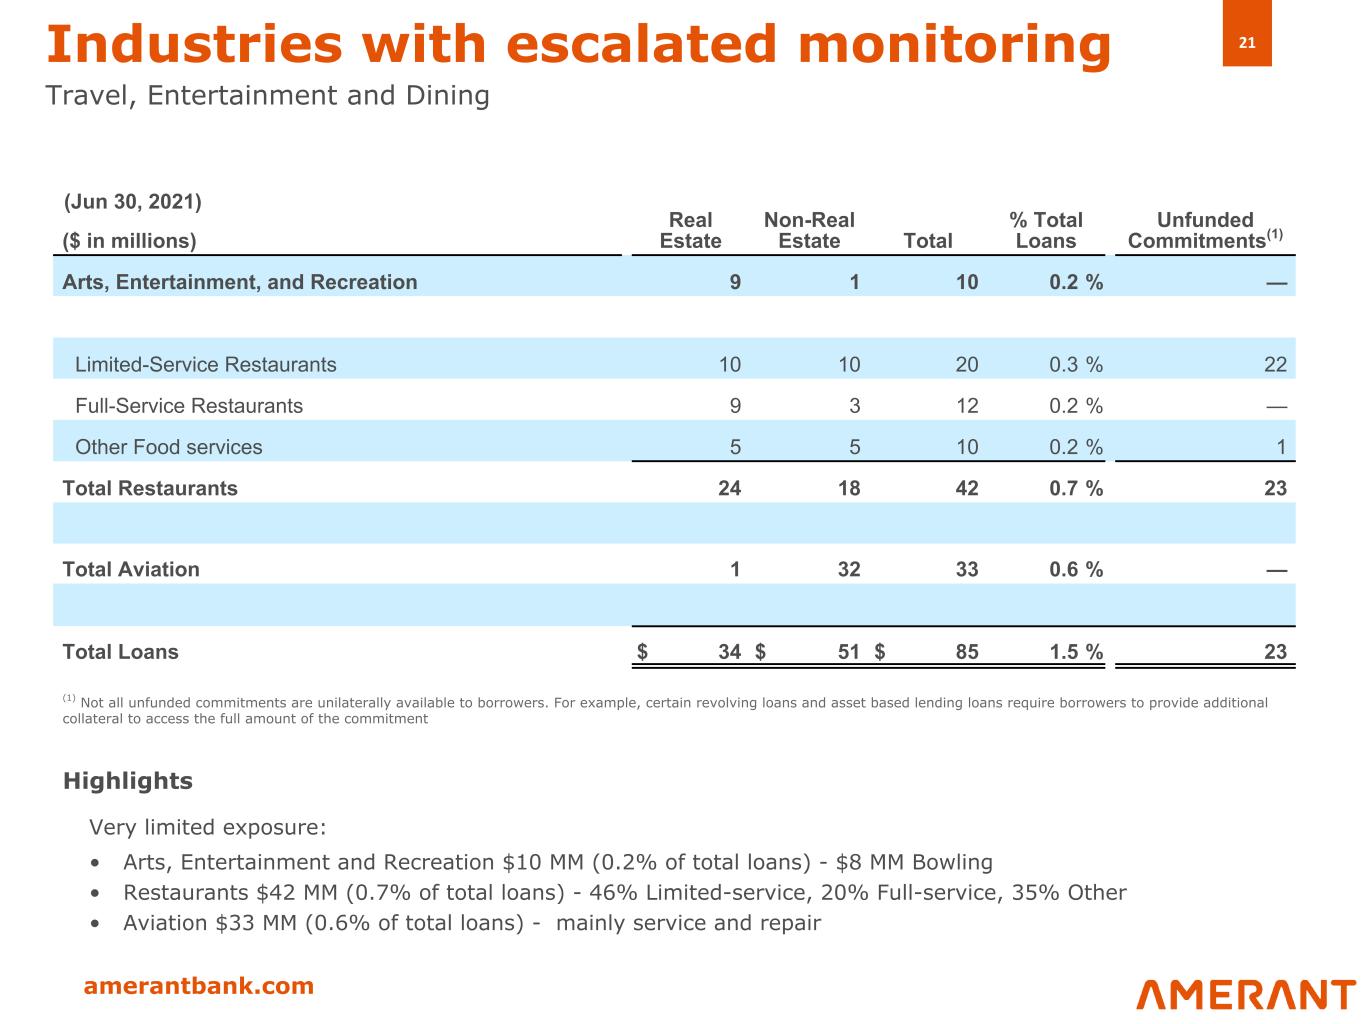
21 amerantbank.com Industries with escalated monitoring Travel, Entertainment and Dining Very limited exposure: • Arts, Entertainment and Recreation $10 MM (0.2% of total loans) - $8 MM Bowling • Restaurants $42 MM (0.7% of total loans) - 46% Limited-service, 20% Full-service, 35% Other • Aviation $33 MM (0.6% of total loans) - mainly service and repair Highlights (1) Not all unfunded commitments are unilaterally available to borrowers. For example, certain revolving loans and asset based lending loans require borrowers to provide additional collateral to access the full amount of the commitment ($ in millions) Real Estate Non-Real Estate Total % Total Loans Unfunded Commitments(1) Arts, Entertainment, and Recreation 9 1 10 0.2 % — Limited-Service Restaurants 10 10 20 0.3 % 22 Full-Service Restaurants 9 3 12 0.2 % — Other Food services 5 5 10 0.2 % 1 Total Restaurants 24 18 42 0.7 % 23 Total Aviation 1 32 33 0.6 % — Total Loans $ 34 $ 51 $ 85 1.5 % 23 (Jun 30, 2021)
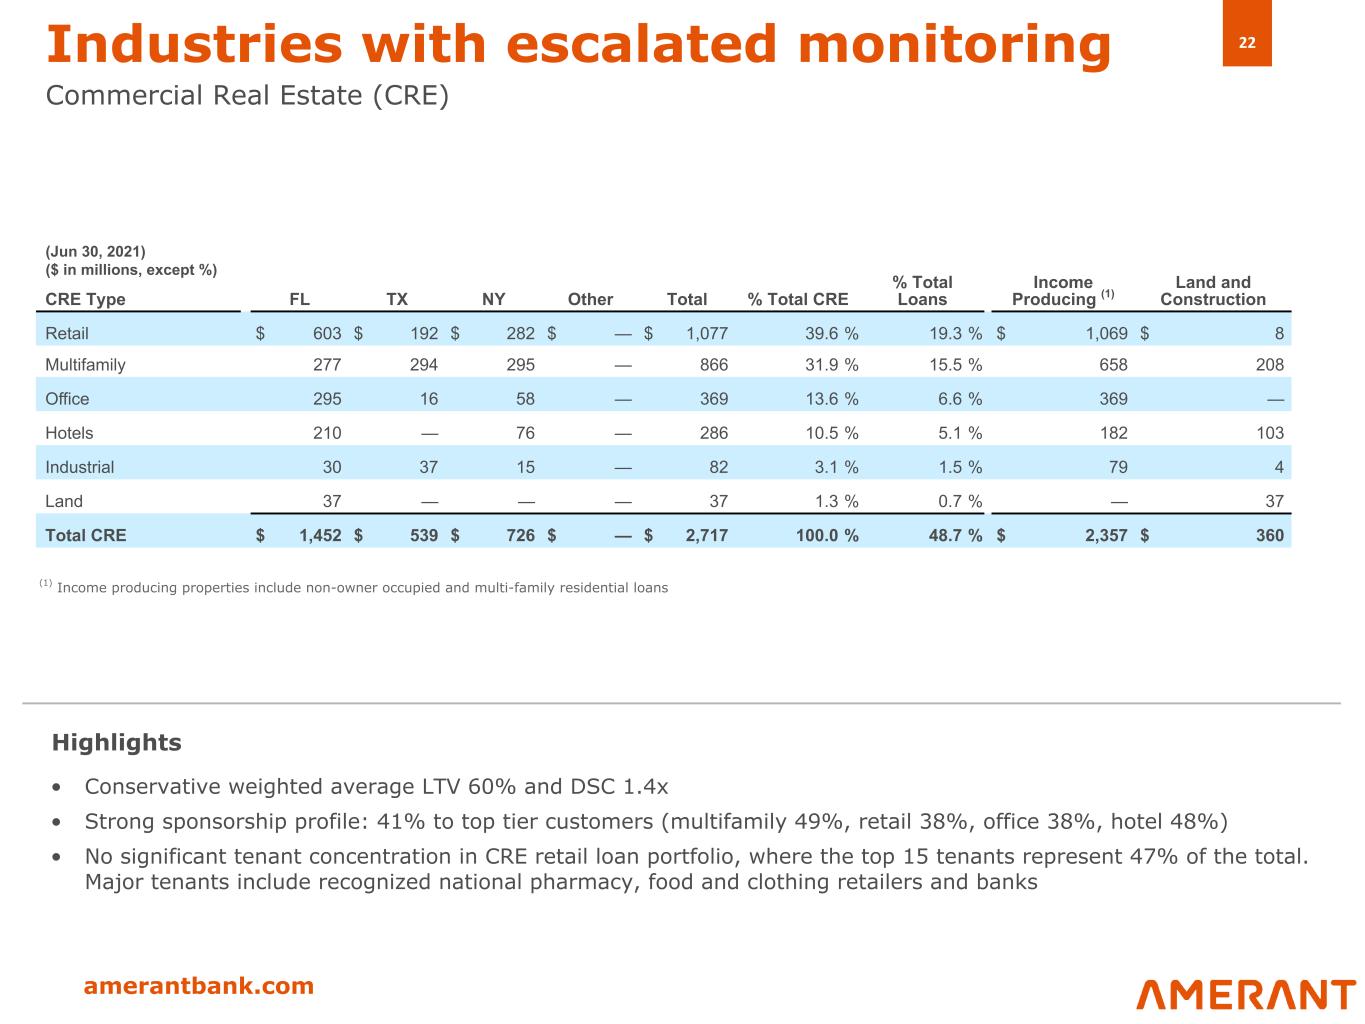
22 amerantbank.com Industries with escalated monitoring Commercial Real Estate (CRE) CRE Type FL TX NY Other Total % Total CRE % Total Loans Income Producing (1) Land and Construction Retail $ 603 $ 192 $ 282 $ — $ 1,077 39.6 % 19.3 % $ 1,069 $ 8 Multifamily 277 294 295 — 866 31.9 % 15.5 % 658 208 Office 295 16 58 — 369 13.6 % 6.6 % 369 — Hotels 210 — 76 — 286 10.5 % 5.1 % 182 103 Industrial 30 37 15 — 82 3.1 % 1.5 % 79 4 Land 37 — — — 37 1.3 % 0.7 % — 37 Total CRE $ 1,452 $ 539 $ 726 $ — $ 2,717 100.0 % 48.7 % $ 2,357 $ 360 • Conservative weighted average LTV 60% and DSC 1.4x • Strong sponsorship profile: 41% to top tier customers (multifamily 49%, retail 38%, office 38%, hotel 48%) • No significant tenant concentration in CRE retail loan portfolio, where the top 15 tenants represent 47% of the total. Major tenants include recognized national pharmacy, food and clothing retailers and banks Highlights (Jun 30, 2021) ($ in millions, except %) (1) Income producing properties include non-owner occupied and multi-family residential loans
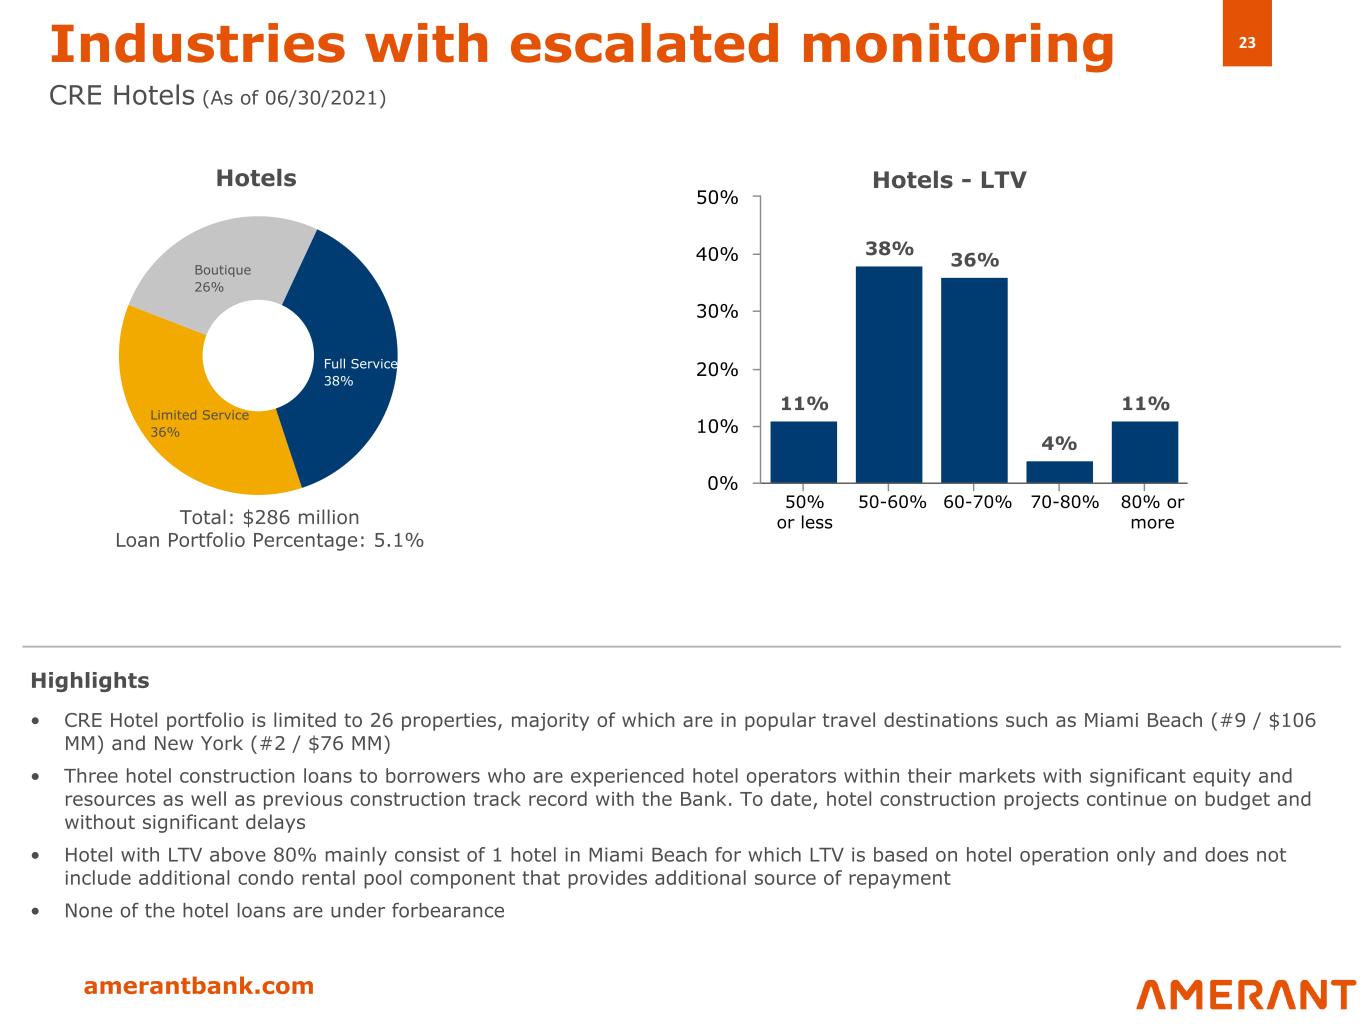
23 amerantbank.com Industries with escalated monitoring CRE Hotels (As of 06/30/2021) • CRE Hotel portfolio is limited to 26 properties, majority of which are in popular travel destinations such as Miami Beach (#9 / $106 MM) and New York (#2 / $76 MM) • Three hotel construction loans to borrowers who are experienced hotel operators within their markets with significant equity and resources as well as previous construction track record with the Bank. To date, hotel construction projects continue on budget and without significant delays • Hotel with LTV above 80% mainly consist of 1 hotel in Miami Beach for which LTV is based on hotel operation only and does not include additional condo rental pool component that provides additional source of repayment • None of the hotel loans are under forbearance Highlights Full Service 38% Limited Service 36% Boutique 26% Hotels 11% 38% 36% 4% 11% 0% 10% 20% 30% 40% 50% 50% or less 50-60% 60-70% 70-80% 80% or more Hotels - LTV Total: $286 million Loan Portfolio Percentage: 5.1%
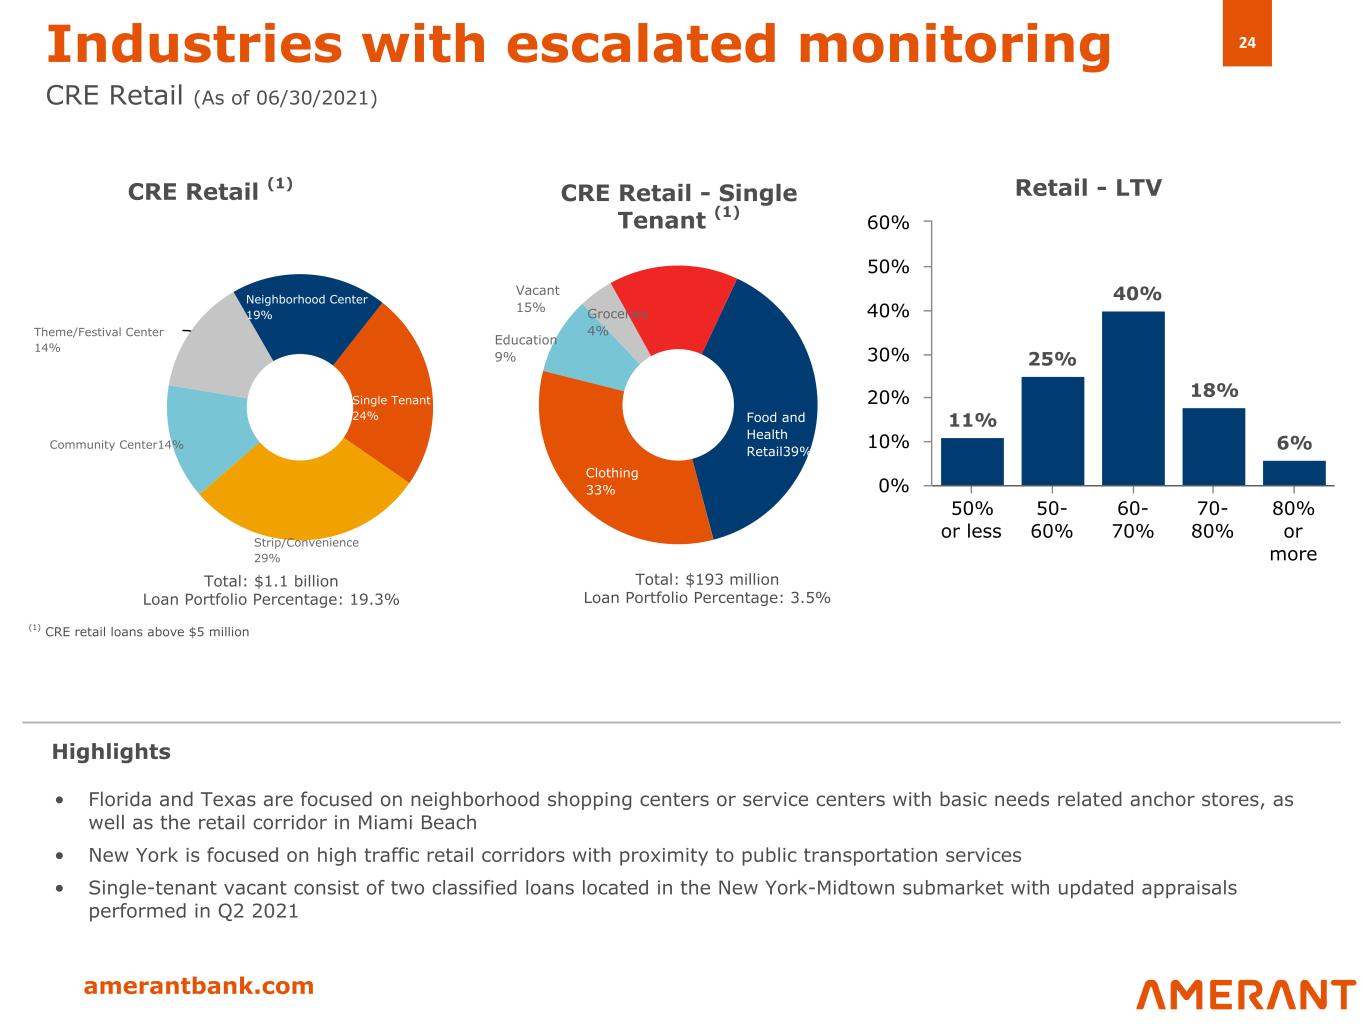
24 amerantbank.com 11% 25% 40% 18% 6% 50% or less 50- 60% 60- 70% 70- 80% 80% or more 0% 10% 20% 30% 40% 50% 60% Industries with escalated monitoring CRE Retail (As of 06/30/2021) • Florida and Texas are focused on neighborhood shopping centers or service centers with basic needs related anchor stores, as well as the retail corridor in Miami Beach • New York is focused on high traffic retail corridors with proximity to public transportation services • Single-tenant vacant consist of two classified loans located in the New York-Midtown submarket with updated appraisals performed in Q2 2021 Highlights CRE Retail (1) Retail - LTV Food and Health Retail39% Clothing 33% Education 9% Groceries 4% Vacant 15% CRE Retail - Single Tenant (1) (1) CRE retail loans above $5 million Total: $1.1 billion Loan Portfolio Percentage: 19.3% Total: $193 million Loan Portfolio Percentage: 3.5% Neighborhood Center 19% Single Tenant 24% Strip/Convenience 29% Community Center14% Theme/Festival Center 14%

amerantbank.com Appendices
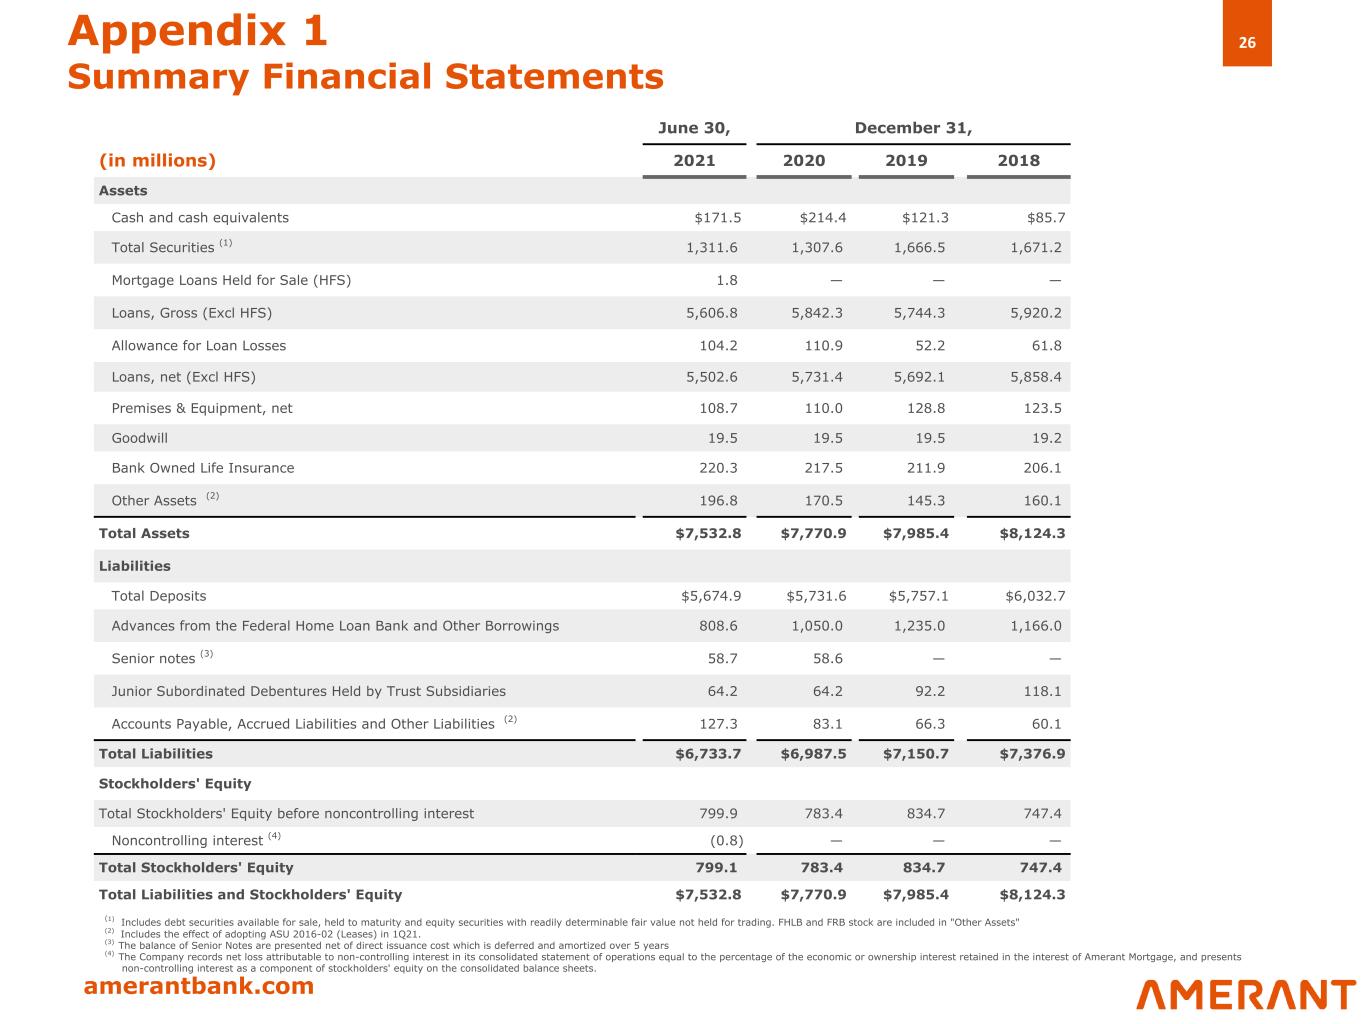
26 amerantbank.com Appendix 1 Summary Financial Statements (1) Includes debt securities available for sale, held to maturity and equity securities with readily determinable fair value not held for trading. FHLB and FRB stock are included in "Other Assets" (2) Includes the effect of adopting ASU 2016-02 (Leases) in 1Q21. (3) The balance of Senior Notes are presented net of direct issuance cost which is deferred and amortized over 5 years (4) The Company records net loss attributable to non-controlling interest in its consolidated statement of operations equal to the percentage of the economic or ownership interest retained in the interest of Amerant Mortgage, and presents non-controlling interest as a component of stockholders' equity on the consolidated balance sheets. June 30, December 31, (in millions) 2021 2020 2019 2018 Assets Cash and cash equivalents $171.5 $214.4 $121.3 $85.7 Total Securities (1) 1,311.6 1,307.6 1,666.5 1,671.2 Mortgage Loans Held for Sale (HFS) 1.8 — — — Loans, Gross (Excl HFS) 5,606.8 5,842.3 5,744.3 5,920.2 Allowance for Loan Losses 104.2 110.9 52.2 61.8 Loans, net (Excl HFS) 5,502.6 5,731.4 5,692.1 5,858.4 Premises & Equipment, net 108.7 110.0 128.8 123.5 Goodwill 19.5 19.5 19.5 19.2 Bank Owned Life Insurance 220.3 217.5 211.9 206.1 Other Assets (2) 196.8 170.5 145.3 160.1 Total Assets $7,532.8 $7,770.9 $7,985.4 $8,124.3 Liabilities Total Deposits $5,674.9 $5,731.6 $5,757.1 $6,032.7 Advances from the Federal Home Loan Bank and Other Borrowings 808.6 1,050.0 1,235.0 1,166.0 Senior notes (3) 58.7 58.6 — — Junior Subordinated Debentures Held by Trust Subsidiaries 64.2 64.2 92.2 118.1 Accounts Payable, Accrued Liabilities and Other Liabilities (2) 127.3 83.1 66.3 60.1 Total Liabilities $6,733.7 $6,987.5 $7,150.7 $7,376.9 Stockholders' Equity Total Stockholders' Equity before noncontrolling interest 799.9 783.4 834.7 747.4 Noncontrolling interest (4) (0.8) — — — Total Stockholders' Equity 799.1 783.4 834.7 747.4 Total Liabilities and Stockholders' Equity $7,532.8 $7,770.9 $7,985.4 $8,124.3
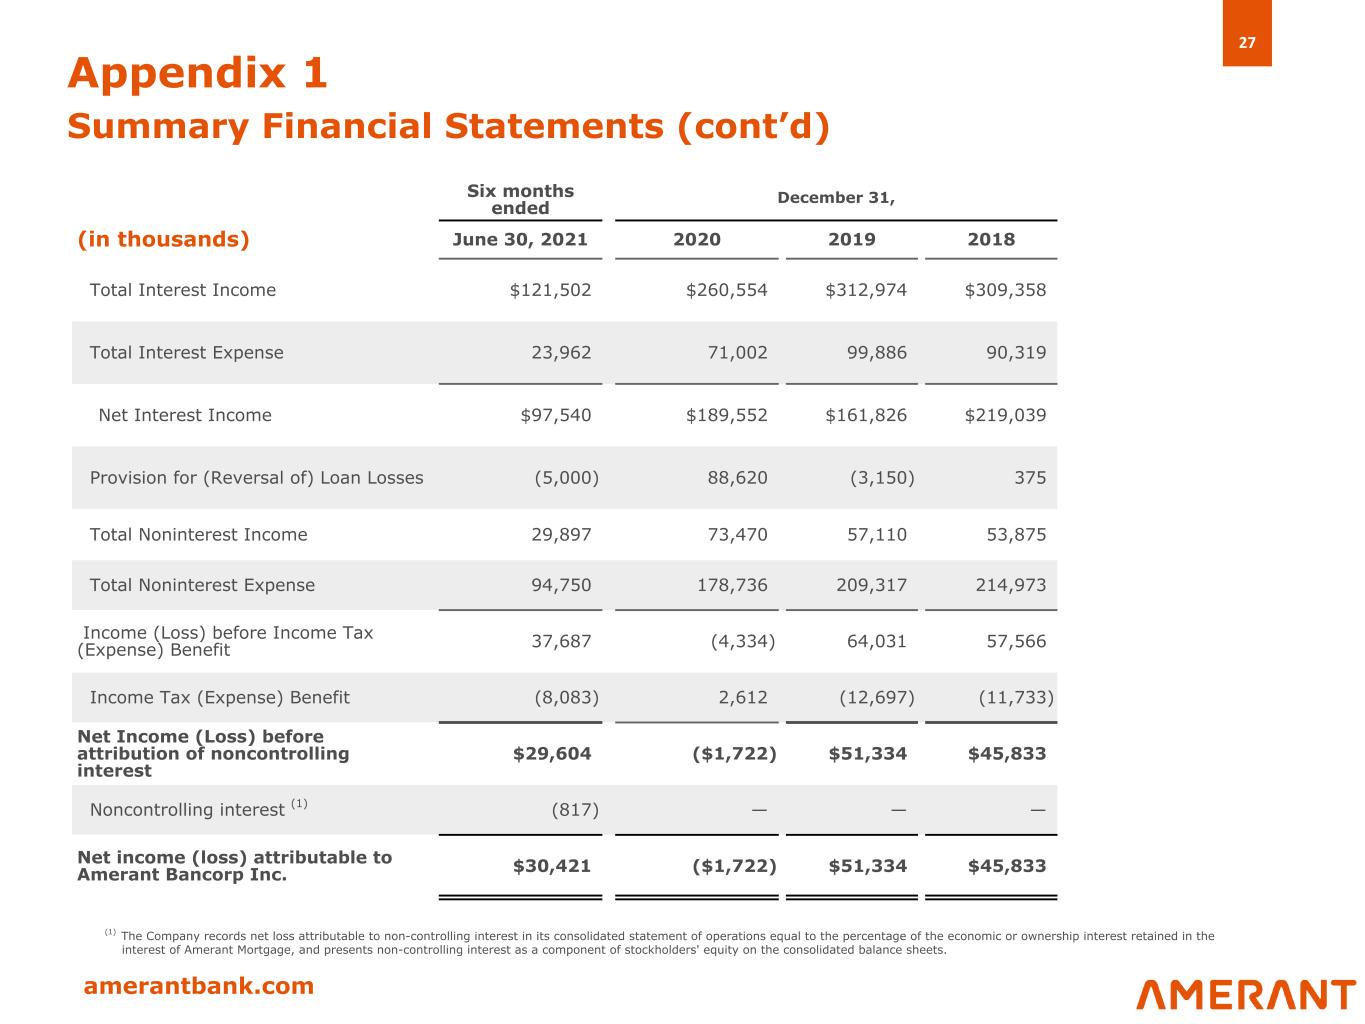
27 amerantbank.com Appendix 1 Summary Financial Statements (cont’d) Six months ended December 31, (in thousands) June 30, 2021 2020 2019 2018 Total Interest Income $121,502 $260,554 $312,974 $309,358 Total Interest Expense 23,962 71,002 99,886 90,319 Net Interest Income $97,540 $189,552 $161,826 $219,039 Provision for (Reversal of) Loan Losses (5,000) 88,620 (3,150) 375 Total Noninterest Income 29,897 73,470 57,110 53,875 Total Noninterest Expense 94,750 178,736 209,317 214,973 Income (Loss) before Income Tax (Expense) Benefit 37,687 (4,334) 64,031 57,566 Income Tax (Expense) Benefit (8,083) 2,612 (12,697) (11,733) Net Income (Loss) before attribution of noncontrolling interest $29,604 ($1,722) $51,334 $45,833 Noncontrolling interest (1) (817) — — — Net income (loss) attributable to Amerant Bancorp Inc. $30,421 ($1,722) $51,334 $45,833 (1) The Company records net loss attributable to non-controlling interest in its consolidated statement of operations equal to the percentage of the economic or ownership interest retained in the interest of Amerant Mortgage, and presents non-controlling interest as a component of stockholders' equity on the consolidated balance sheets.
28 amerantbank.com Explanation of Certain Non-GAAP Financial Measures This Presentation contains certain adjusted financial information, and their effects on noninterest income, noninterest expense, income taxes, net income, Core pre-provision net revenue, ROA and ROE and certain other financial ratios. These adjustments include: • the $1.7 million loss on the sale of the Beacon operations center during the fourth quarter of 2020 • the $2.8 million net gain on the sale of vacant Beacon land during the fourth quarter of 2019, • spin-off expenses totaling $6.7 million in 2018, beginning in the fourth quarter of 2017 and continuing to the fourth quarter of 2018, • the $6.4 million, $5.0 million, $11.9 million and $4.4 million in restructuring expenses in 2018, 2019, 2020 and the first half of 2021, respectively, related to staff reduction costs, legal and strategic advisory costs, rebranding costs, digital transformation costs, branch closure expenses and lease impairment charge • the effect of non-core banking activities such as the sale of loans and securities, and other non-recurring actions intended to improve customer service and operating performance The Company uses certain non-GAAP financial measures, within the meaning of SEC Regulation G, which are included in this Presentation to explain our results and which are used in our internal evaluation and management of the Company’s businesses. The Company’s management believes these non-GAAP financial measures and the information they provide are useful to investors since these measures permit investors to view the Company’s performance using the same tools that management uses to evaluate the Company’s past performance and prospects for future performance. The Company believes these are especially useful in light of the effects of our spin-off and related restructuring expenses, as well as the sale of the Beacon operations center in the fourth quarter of 2020, the sale of the vacant Beacon land in the fourth quarter of 2019 and the effect of non-core banking activities such as the sale of loans and securities, and other non-recurring actions intended to improve customer service and operating performance. These as-adjusted measures are not in accordance with generally accepted accounting principles (“GAAP”). This Appendix 2 reconciles these adjustments to reported results. Appendix 2 Non-GAAP Financial Measures Reconciliations
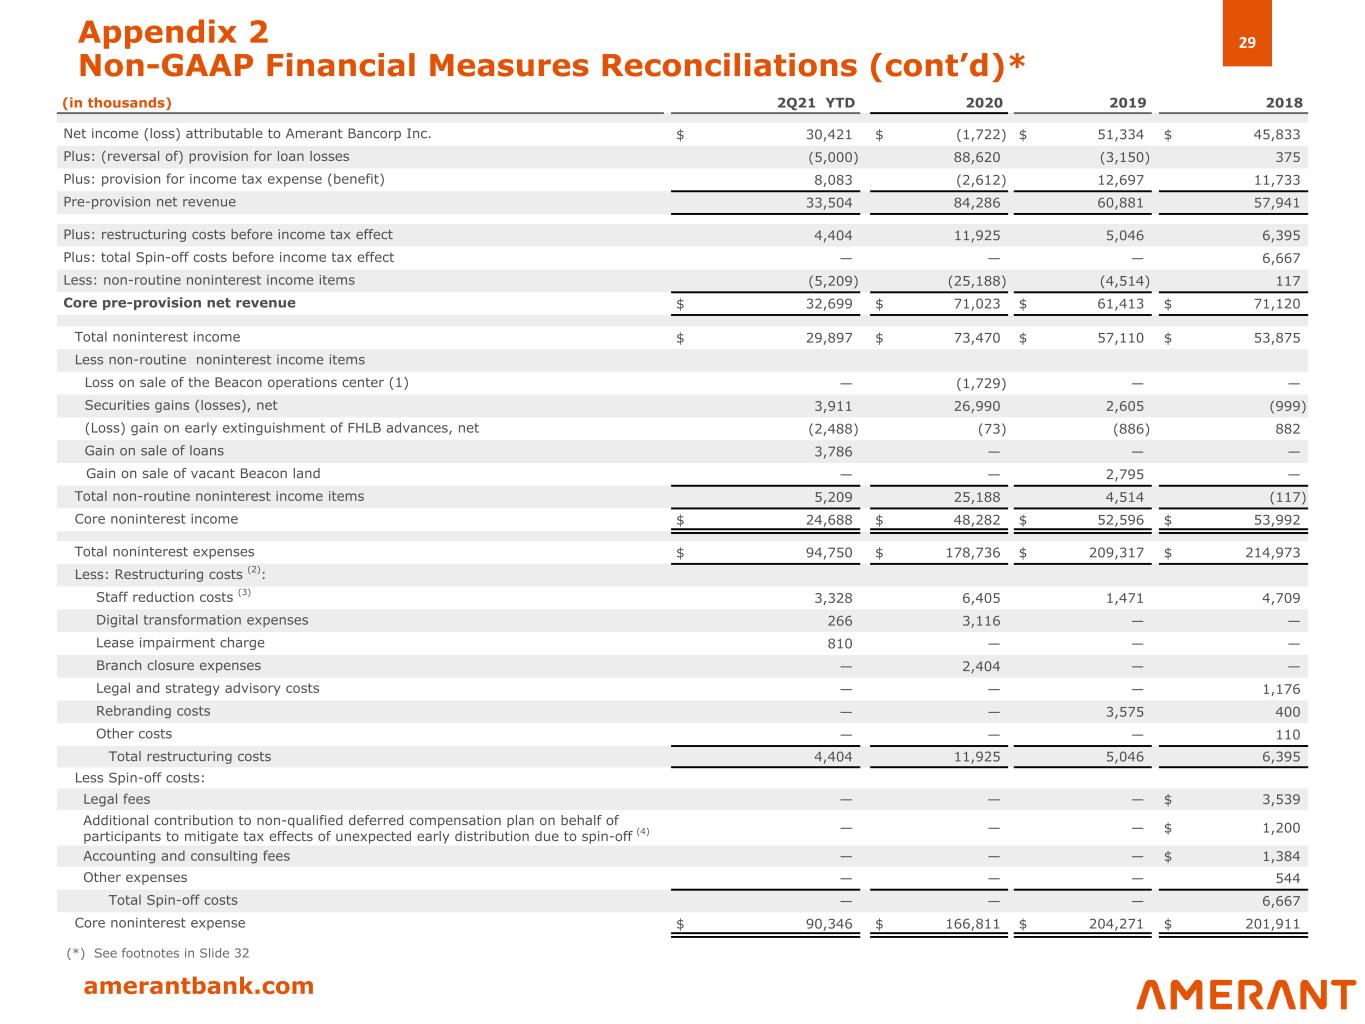
29 amerantbank.com (in thousands) 2Q21 YTD 2020 2019 2018 Net income (loss) attributable to Amerant Bancorp Inc. $ 30,421 $ (1,722) $ 51,334 $ 45,833 Plus: (reversal of) provision for loan losses (5,000) 88,620 (3,150) 375 Plus: provision for income tax expense (benefit) 8,083 (2,612) 12,697 11,733 Pre-provision net revenue 33,504 84,286 60,881 57,941 Plus: restructuring costs before income tax effect 4,404 11,925 5,046 6,395 Plus: total Spin-off costs before income tax effect — — — 6,667 Less: non-routine noninterest income items (5,209) (25,188) (4,514) 117 Core pre-provision net revenue $ 32,699 $ 71,023 $ 61,413 $ 71,120 Total noninterest income $ 29,897 $ 73,470 $ 57,110 $ 53,875 Less non-routine noninterest income items Loss on sale of the Beacon operations center (1) — (1,729) — — Securities gains (losses), net 3,911 26,990 2,605 (999) (Loss) gain on early extinguishment of FHLB advances, net (2,488) (73) (886) 882 Gain on sale of loans 3,786 — — — Gain on sale of vacant Beacon land — — 2,795 — Total non-routine noninterest income items 5,209 25,188 4,514 (117) Core noninterest income $ 24,688 $ 48,282 $ 52,596 $ 53,992 Total noninterest expenses $ 94,750 $ 178,736 $ 209,317 $ 214,973 Less: Restructuring costs (2): Staff reduction costs (3) 3,328 6,405 1,471 4,709 Digital transformation expenses 266 3,116 — — Lease impairment charge 810 — — — Branch closure expenses — 2,404 — — Legal and strategy advisory costs — — — 1,176 Rebranding costs — — 3,575 400 Other costs — — — 110 Total restructuring costs 4,404 11,925 5,046 6,395 Less Spin-off costs: Legal fees — — — $ 3,539 Additional contribution to non-qualified deferred compensation plan on behalf of participants to mitigate tax effects of unexpected early distribution due to spin-off (4) — — — $ 1,200 Accounting and consulting fees — — — $ 1,384 Other expenses — — — 544 Total Spin-off costs — — — 6,667 Core noninterest expense $ 90,346 $ 166,811 $ 204,271 $ 201,911 Appendix 2 Non-GAAP Financial Measures Reconciliations (cont’d)* (*) See footnotes in Slide 32
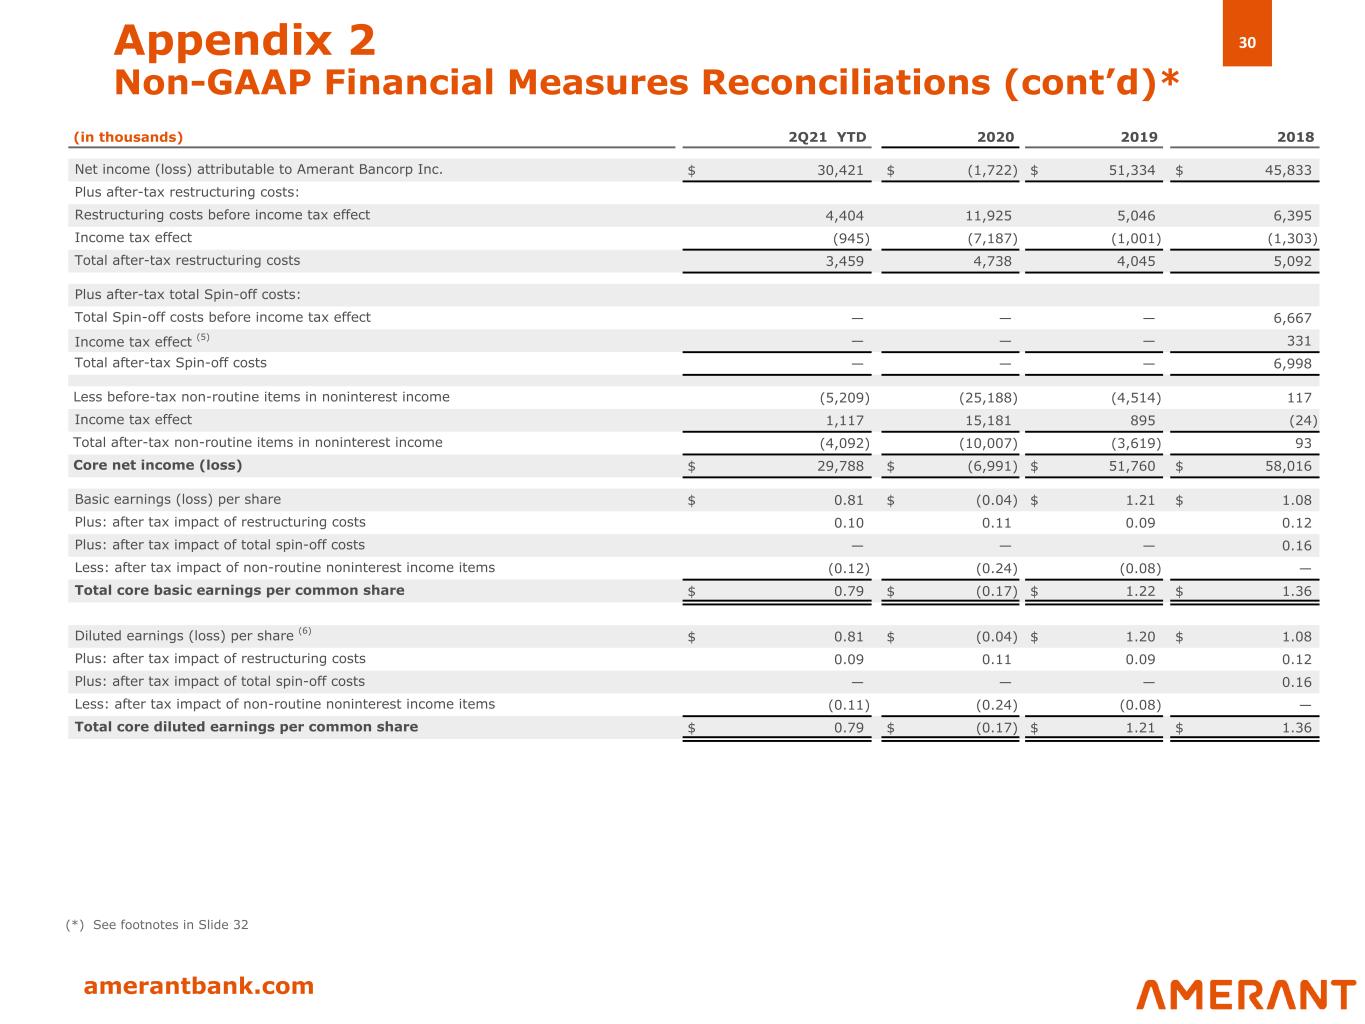
30 amerantbank.com (in thousands) 2Q21 YTD 2020 2019 2018 Net income (loss) attributable to Amerant Bancorp Inc. $ 30,421 $ (1,722) $ 51,334 $ 45,833 Plus after-tax restructuring costs: Restructuring costs before income tax effect 4,404 11,925 5,046 6,395 Income tax effect (945) (7,187) (1,001) (1,303) Total after-tax restructuring costs 3,459 4,738 4,045 5,092 Plus after-tax total Spin-off costs: Total Spin-off costs before income tax effect — — — 6,667 Income tax effect (5) — — — 331 Total after-tax Spin-off costs — — — 6,998 Less before-tax non-routine items in noninterest income (5,209) (25,188) (4,514) 117 Income tax effect 1,117 15,181 895 (24) Total after-tax non-routine items in noninterest income (4,092) (10,007) (3,619) 93 Core net income (loss) $ 29,788 $ (6,991) $ 51,760 $ 58,016 Basic earnings (loss) per share $ 0.81 $ (0.04) $ 1.21 $ 1.08 Plus: after tax impact of restructuring costs 0.10 0.11 0.09 0.12 Plus: after tax impact of total spin-off costs — — — 0.16 Less: after tax impact of non-routine noninterest income items (0.12) (0.24) (0.08) — Total core basic earnings per common share $ 0.79 $ (0.17) $ 1.22 $ 1.36 Diluted earnings (loss) per share (6) $ 0.81 $ (0.04) $ 1.20 $ 1.08 Plus: after tax impact of restructuring costs 0.09 0.11 0.09 0.12 Plus: after tax impact of total spin-off costs — — — 0.16 Less: after tax impact of non-routine noninterest income items (0.11) (0.24) (0.08) — Total core diluted earnings per common share $ 0.79 $ (0.17) $ 1.21 $ 1.36 Appendix 2 Non-GAAP Financial Measures Reconciliations (cont’d)* (*) See footnotes in Slide 32
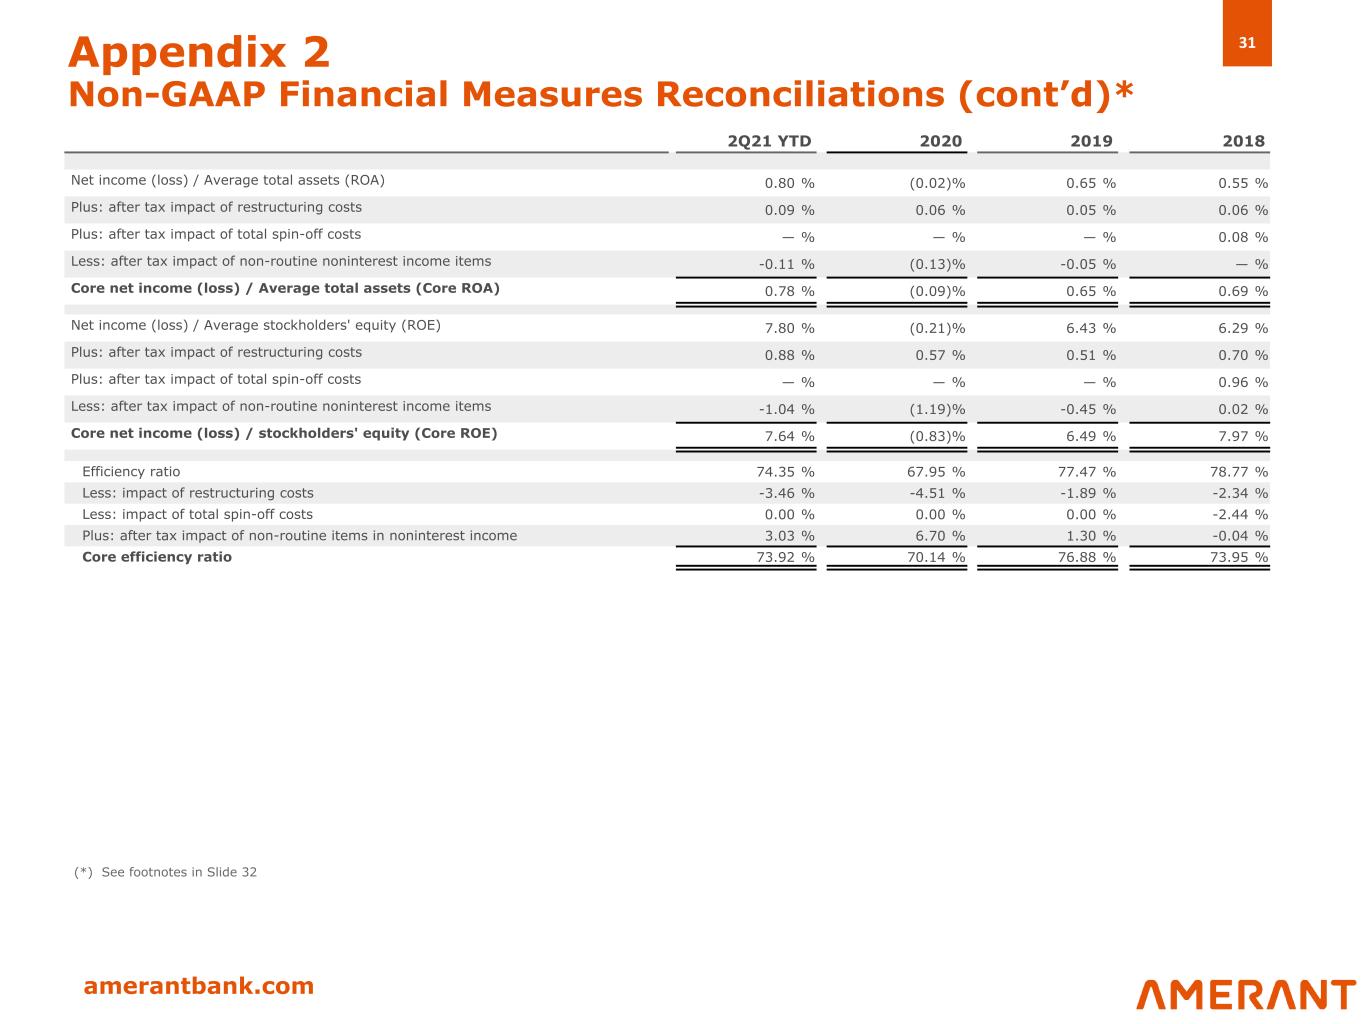
31 amerantbank.com Appendix 2 Non-GAAP Financial Measures Reconciliations (cont’d)* 2Q21 YTD 2020 2019 2018 Net income (loss) / Average total assets (ROA) 0.80 % (0.02) % 0.65 % 0.55 % Plus: after tax impact of restructuring costs 0.09 % 0.06 % 0.05 % 0.06 % Plus: after tax impact of total spin-off costs — % — % — % 0.08 % Less: after tax impact of non-routine noninterest income items -0.11 % (0.13) % -0.05 % — % Core net income (loss) / Average total assets (Core ROA) 0.78 % (0.09) % 0.65 % 0.69 % Net income (loss) / Average stockholders' equity (ROE) 7.80 % (0.21) % 6.43 % 6.29 % Plus: after tax impact of restructuring costs 0.88 % 0.57 % 0.51 % 0.70 % Plus: after tax impact of total spin-off costs — % — % — % 0.96 % Less: after tax impact of non-routine noninterest income items -1.04 % (1.19) % -0.45 % 0.02 % Core net income (loss) / stockholders' equity (Core ROE) 7.64 % (0.83) % 6.49 % 7.97 % Efficiency ratio 74.35 % 67.95 % 77.47 % 78.77 % Less: impact of restructuring costs -3.46 % -4.51 % -1.89 % -2.34 % Less: impact of total spin-off costs 0.00 % 0.00 % 0.00 % -2.44 % Plus: after tax impact of non-routine items in noninterest income 3.03 % 6.70 % 1.30 % -0.04 % Core efficiency ratio 73.92 % 70.14 % 76.88 % 73.95 % (*) See footnotes in Slide 32
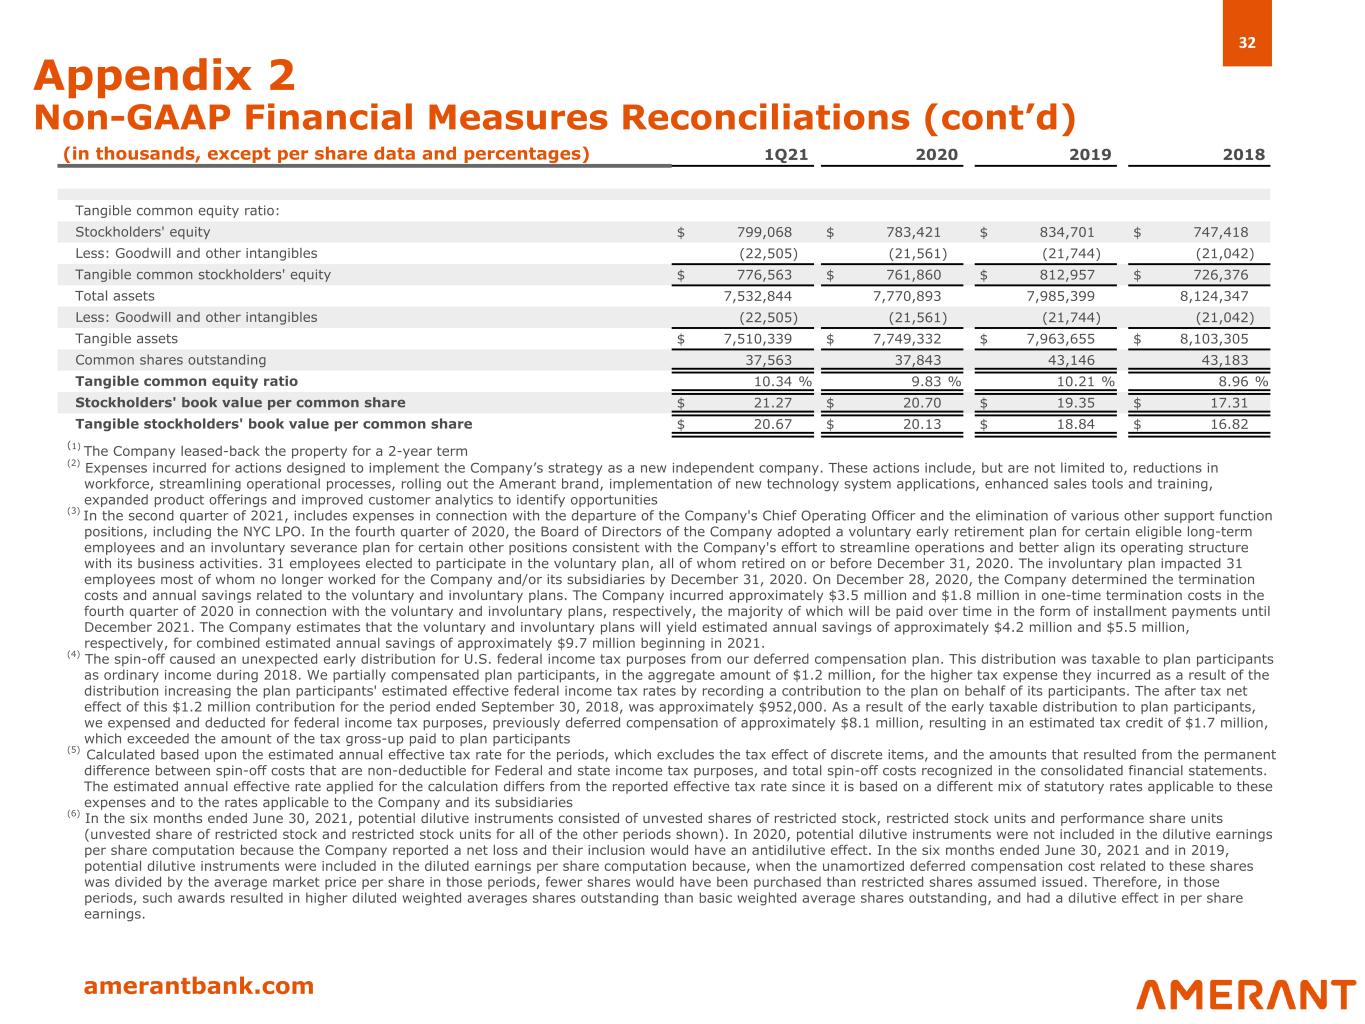
32 amerantbank.com Appendix 2 Non-GAAP Financial Measures Reconciliations (cont’d) (in thousands, except per share data and percentages) 1Q21 2020 2019 2018 Tangible common equity ratio: Stockholders' equity $ 799,068 $ 783,421 $ 834,701 $ 747,418 Less: Goodwill and other intangibles (22,505) (21,561) (21,744) (21,042) Tangible common stockholders' equity $ 776,563 $ 761,860 $ 812,957 $ 726,376 Total assets 7,532,844 7,770,893 7,985,399 8,124,347 Less: Goodwill and other intangibles (22,505) (21,561) (21,744) (21,042) Tangible assets $ 7,510,339 $ 7,749,332 $ 7,963,655 $ 8,103,305 Common shares outstanding 37,563 37,843 43,146 43,183 Tangible common equity ratio 10.34 % 9.83 % 10.21 % 8.96 % Stockholders' book value per common share $ 21.27 $ 20.70 $ 19.35 $ 17.31 Tangible stockholders' book value per common share $ 20.67 $ 20.13 $ 18.84 $ 16.82 (1) The Company leased-back the property for a 2-year term (2) Expenses incurred for actions designed to implement the Company’s strategy as a new independent company. These actions include, but are not limited to, reductions in workforce, streamlining operational processes, rolling out the Amerant brand, implementation of new technology system applications, enhanced sales tools and training, expanded product offerings and improved customer analytics to identify opportunities (3) In the second quarter of 2021, includes expenses in connection with the departure of the Company's Chief Operating Officer and the elimination of various other support function positions, including the NYC LPO. In the fourth quarter of 2020, the Board of Directors of the Company adopted a voluntary early retirement plan for certain eligible long-term employees and an involuntary severance plan for certain other positions consistent with the Company's effort to streamline operations and better align its operating structure with its business activities. 31 employees elected to participate in the voluntary plan, all of whom retired on or before December 31, 2020. The involuntary plan impacted 31 employees most of whom no longer worked for the Company and/or its subsidiaries by December 31, 2020. On December 28, 2020, the Company determined the termination costs and annual savings related to the voluntary and involuntary plans. The Company incurred approximately $3.5 million and $1.8 million in one-time termination costs in the fourth quarter of 2020 in connection with the voluntary and involuntary plans, respectively, the majority of which will be paid over time in the form of installment payments until December 2021. The Company estimates that the voluntary and involuntary plans will yield estimated annual savings of approximately $4.2 million and $5.5 million, respectively, for combined estimated annual savings of approximately $9.7 million beginning in 2021. (4) The spin-off caused an unexpected early distribution for U.S. federal income tax purposes from our deferred compensation plan. This distribution was taxable to plan participants as ordinary income during 2018. We partially compensated plan participants, in the aggregate amount of $1.2 million, for the higher tax expense they incurred as a result of the distribution increasing the plan participants' estimated effective federal income tax rates by recording a contribution to the plan on behalf of its participants. The after tax net effect of this $1.2 million contribution for the period ended September 30, 2018, was approximately $952,000. As a result of the early taxable distribution to plan participants, we expensed and deducted for federal income tax purposes, previously deferred compensation of approximately $8.1 million, resulting in an estimated tax credit of $1.7 million, which exceeded the amount of the tax gross-up paid to plan participants (5) Calculated based upon the estimated annual effective tax rate for the periods, which excludes the tax effect of discrete items, and the amounts that resulted from the permanent difference between spin-off costs that are non-deductible for Federal and state income tax purposes, and total spin-off costs recognized in the consolidated financial statements. The estimated annual effective rate applied for the calculation differs from the reported effective tax rate since it is based on a different mix of statutory rates applicable to these expenses and to the rates applicable to the Company and its subsidiaries (6) In the six months ended June 30, 2021, potential dilutive instruments consisted of unvested shares of restricted stock, restricted stock units and performance share units (unvested share of restricted stock and restricted stock units for all of the other periods shown). In 2020, potential dilutive instruments were not included in the dilutive earnings per share computation because the Company reported a net loss and their inclusion would have an antidilutive effect. In the six months ended June 30, 2021 and in 2019, potential dilutive instruments were included in the diluted earnings per share computation because, when the unamortized deferred compensation cost related to these shares was divided by the average market price per share in those periods, fewer shares would have been purchased than restricted shares assumed issued. Therefore, in those periods, such awards resulted in higher diluted weighted averages shares outstanding than basic weighted average shares outstanding, and had a dilutive effect in per share earnings.

amerantbank.com Thank you