
Earnings Call January 20, 2022 Fourth Quarter 2021
2 Forward-Looking Statements This presentation contains “forward-looking statements” including statements regarding our outsourcing agreement with FIS, and the Company's ability to achieve savings and greater operational efficiencies, as well as statements with respect to the Company’s objectives, expectations and intentions and other statements that are not historical facts. All statements other than statements of historical fact are statements that could be forward-looking statements. You can identify these forward-looking statements through our use of words such as “may,” “will,” “anticipate,” “assume,” “should,” “indicate,” “would,” “believe,” “contemplate,” “expect,” “estimate,” “continue,” “plan,” “point to,” “project,” “could,” “intend,” “target,” “goals,” “outlooks,” “modeled,” “dedicated,” “create,” and other similar words and expressions of the future. Forward-looking statements, including those relating to our outsourcing relationship with FIS, as well as other statements as to our beliefs, plans, objectives, goals, expectations, anticipations, estimates and intentions, involve known and unknown risks, uncertainties and other factors, which may be beyond our control, and which may cause the Company’s actual results, performance, achievements, or financial condition to be materially different from future results, performance, achievements, or financial condition expressed or implied by such forward-looking statements. You should not rely on any forward-looking statements as predictions of future events. You should not expect us to update any forward-looking statements, except as required by law. All written or oral forward-looking statements attributable to us are expressly qualified in their entirety by this cautionary notice, together with those risks and uncertainties described in “Risk factors” in our annual report on Form 10-K for the fiscal year ended December 31, 2020, in our quarterly report on Form 10-Q for the quarter ended June 30, 2021 and in our other filings with the U.S. Securities and Exchange Commission (the “SEC”), which are available at the SEC’s website www.sec.gov. Interim Financial Information Unaudited financial information as of and for interim periods, including the three and twelve month periods ended December 31, 2021 and the three month period ended December 31, 2020, may not reflect our results of operations for our fiscal year ended, or financial condition as of December 31, 2021, or any other period of time or date. Non-GAAP Financial Measures The Company supplements its financial results that are determined in accordance with accounting principles generally accepted in the United States of America (“GAAP”) with non- GAAP financial measures, such as “pre-provision net revenue (PPNR)”, “core pre-provision net revenue (Core PPNR)”, “core net income (loss)”, “core net income (loss) per share (basic and diluted)”, “core return on assets (Core ROA)”, “core return on equity (Core ROE)", "core efficiency ratio”, and “tangible stockholders’ equity (book value) per common share”. This supplemental information is not required by, or is not presented in accordance with GAAP. The Company refers to these financial measures and ratios as “non-GAAP financial measures” and they should not be considered in isolation or as a substitute for the GAAP measures presented herein. We use certain non-GAAP financial measures, including those mentioned above, both to explain our results to shareholders and the investment community and in the internal evaluation and management of our businesses. Our management believes that these non-GAAP financial measures and the information they provide are useful to investors since these measures permit investors to view our performance using the same tools that our management uses to evaluate our past performance and prospects for future performance, especially in light of the additional costs we have incurred in connection with the Company’s restructuring activities that began in 2018 and continued in 2021, including the effect of non-core banking activities such as the sale of loans and securities, the sale of our corporate headquarters in the fourth quarter of 2021, and other non-recurring actions intended to improve customer service and operating performance. While we believe that these non-GAAP financial measures are useful in evaluating our performance, this information should be considered as supplemental and not as a substitute for or superior to the related financial information prepared in accordance with GAAP. Additionally, these non-GAAP financial measures may differ from similar measures presented by other companies. Exhibit 2 reconciles these non-GAAP financial measures to reported results. Important Notices and Disclaimers
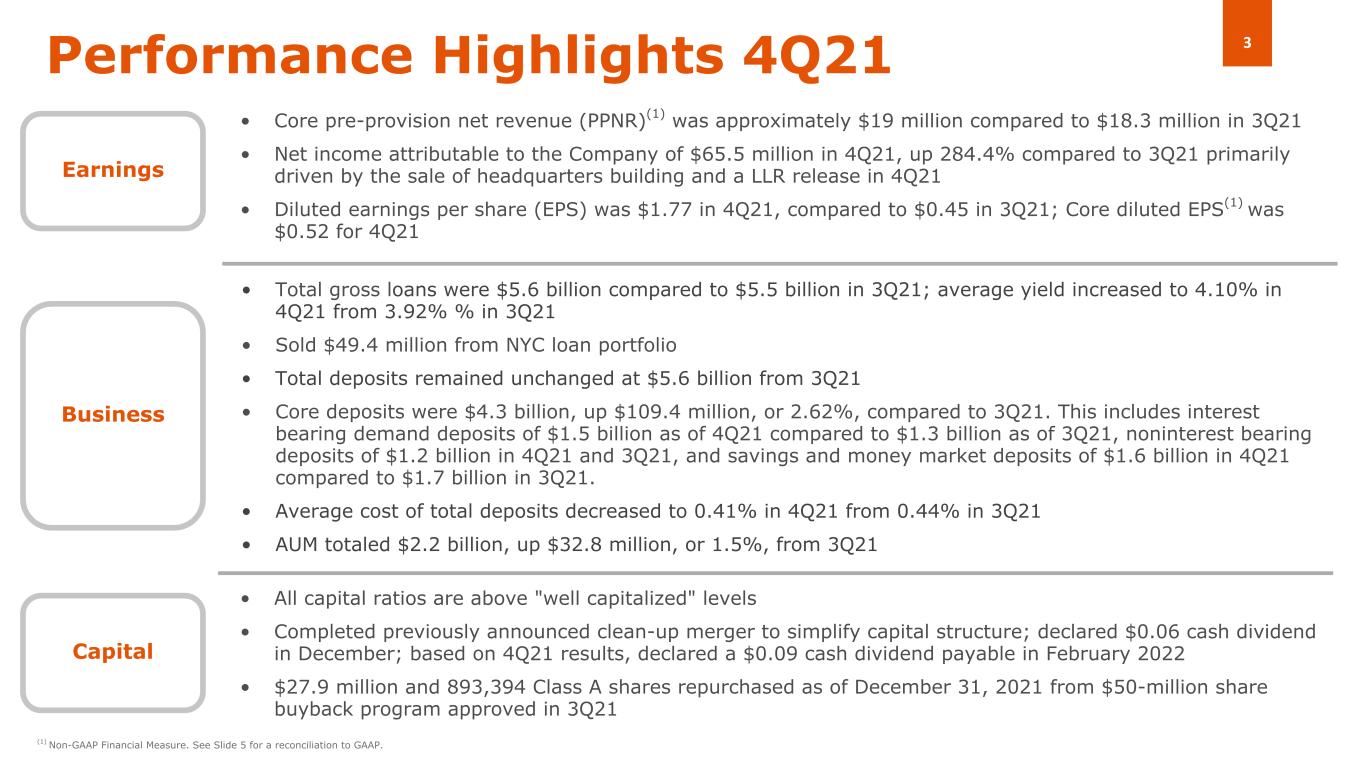
3 • All capital ratios are above "well capitalized" levels • Completed previously announced clean-up merger to simplify capital structure; declared $0.06 cash dividend in December; based on 4Q21 results, declared a $0.09 cash dividend payable in February 2022 • $27.9 million and 893,394 Class A shares repurchased as of December 31, 2021 from $50-million share buyback program approved in 3Q21 Performance Highlights 4Q21 Capital Business • Core pre-provision net revenue (PPNR)(1) was approximately $19 million compared to $18.3 million in 3Q21 • Net income attributable to the Company of $65.5 million in 4Q21, up 284.4% compared to 3Q21 primarily driven by the sale of headquarters building and a LLR release in 4Q21 • Diluted earnings per share (EPS) was $1.77 in 4Q21, compared to $0.45 in 3Q21; Core diluted EPS(1) was $0.52 for 4Q21 • Total gross loans were $5.6 billion compared to $5.5 billion in 3Q21; average yield increased to 4.10% in 4Q21 from 3.92% % in 3Q21 • Sold $49.4 million from NYC loan portfolio • Total deposits remained unchanged at $5.6 billion from 3Q21 • Core deposits were $4.3 billion, up $109.4 million, or 2.62%, compared to 3Q21. This includes interest bearing demand deposits of $1.5 billion as of 4Q21 compared to $1.3 billion as of 3Q21, noninterest bearing deposits of $1.2 billion in 4Q21 and 3Q21, and savings and money market deposits of $1.6 billion in 4Q21 compared to $1.7 billion in 3Q21. • Average cost of total deposits decreased to 0.41% in 4Q21 from 0.44% in 3Q21 • AUM totaled $2.2 billion, up $32.8 million, or 1.5%, from 3Q21 Earnings (1) Non-GAAP Financial Measure. See Slide 5 for a reconciliation to GAAP.
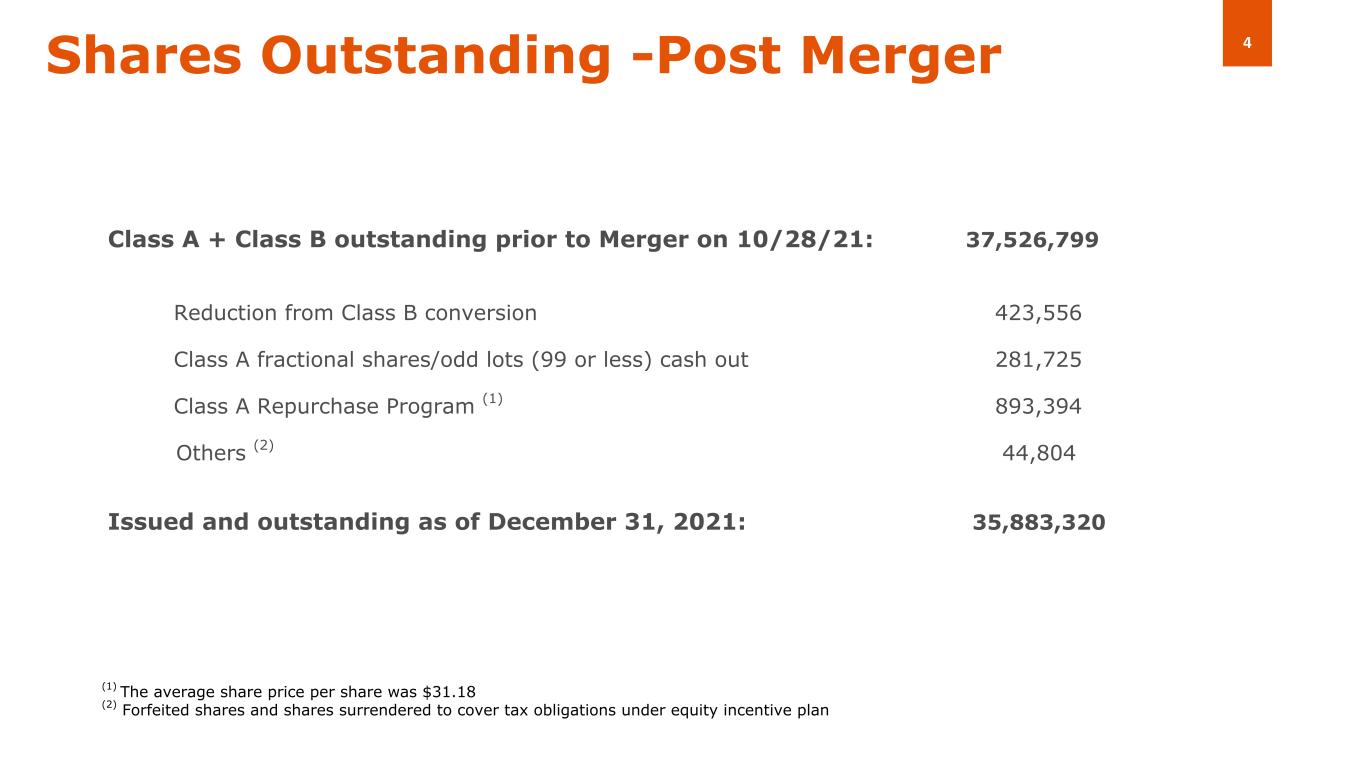
4Shares Outstanding -Post Merger Class A + Class B outstanding prior to Merger on 10/28/21: 37,526,799 Reduction from Class B conversion 423,556 Class A fractional shares/odd lots (99 or less) cash out 281,725 Class A Repurchase Program (1) 893,394 Others (2) 44,804 Issued and outstanding as of December 31, 2021: 35,883,320 (1) The average share price per share was $31.18 (2) Forfeited shares and shares surrendered to cover tax obligations under equity incentive plan
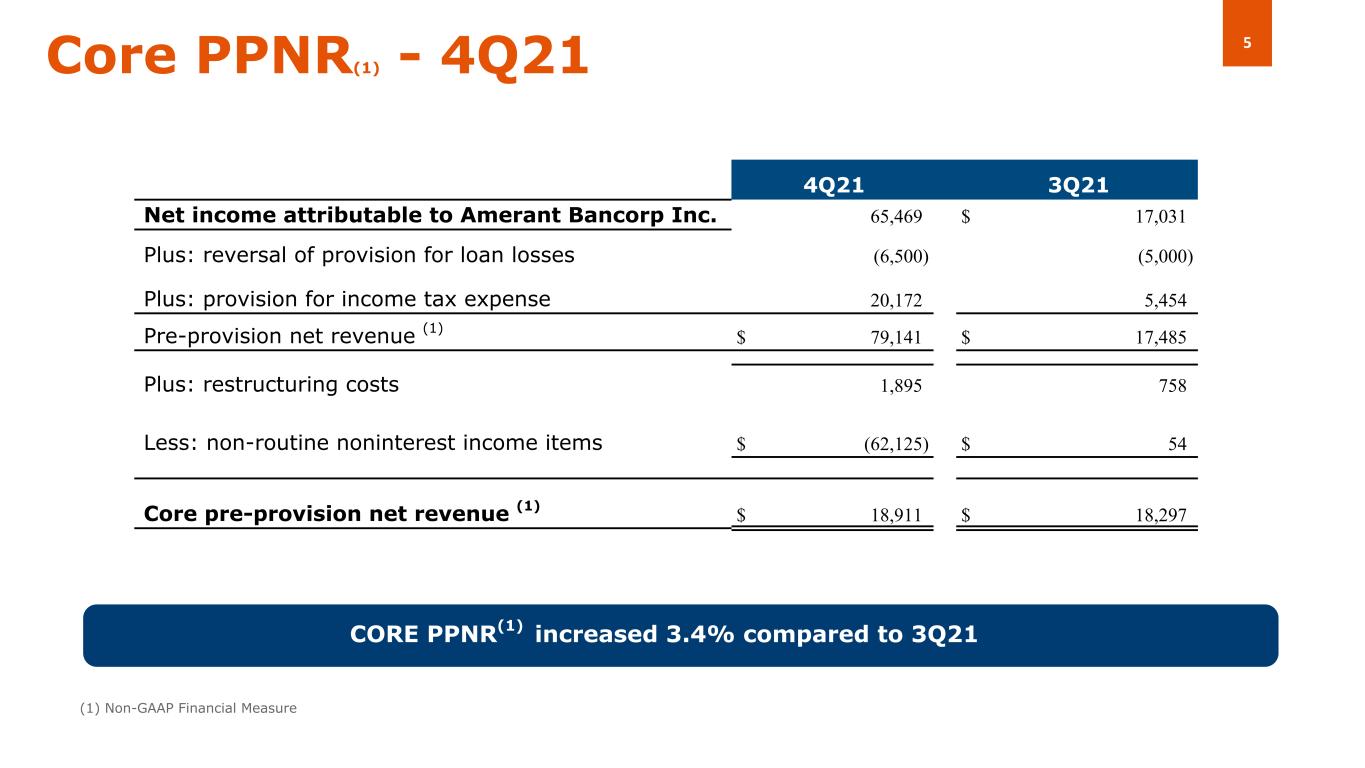
5Core PPNR(1) - 4Q21 CORE PPNR(1) increased 3.4% compared to 3Q21 (1) Non-GAAP Financial Measure (( 4Q21 3Q21 Net income attributable to Amerant Bancorp Inc. 65,469 $ 17,031 Plus: reversal of provision for loan losses (6,500) (5,000) Plus: provision for income tax expense 20,172 5,454 Pre-provision net revenue (1) $ 79,141 $ 17,485 Plus: restructuring costs 1,895 758 Less: non-routine noninterest income items $ (62,125) $ 54 Core pre-provision net revenue (1) $ 18,911 $ 18,297
6Key Actions - 4Q21 Several key actions of note, among others: – Focus on reducing non performing loans resulted in significant decline to $49.8 million as of December 31, 2021, compared to $82.7 million as of September 30, 2021 – Closed Wellington branch in October 2021; signed lease and announced new downtown Miami branch, expected to open 4Q22 – New hires (FTEs) included: – Amerant Mortgage: 20 FTEs; added wholesale team – Head of procurement – Head of loan syndication desk – Marketing: 4 FTEs; focused on digital efforts – Private Client Group: 6 FTEs based in south FL; focus on large private banking relationships including professionals, law practitioners and medical offices, among others – Executed agreement to become a strategic investor in the JAM FINTOP Blockchain Fund – Subsidiary Amerant Bank entered into a new multi-year outsourcing agreement with financial technology leader FIS® to assume full responsibility over a significant number of its support functions and staff, including certain back-office operations; estimated annual savings of approximately $12 million, while achieving greater operational efficiencies and delivering advanced solutions and services to its customers – Amerant’s new "Imagine a Bank" campaign was launched during 4Q21 and a significant expansion to the campaign went live on January 3, 2022, including two high impact boards in the downtown Miami area delivering more than 125 million impressions in the South Florida market. Continue to leverage our partnership with the Atlantic Division leading Florida Panthers to also drive brand awareness
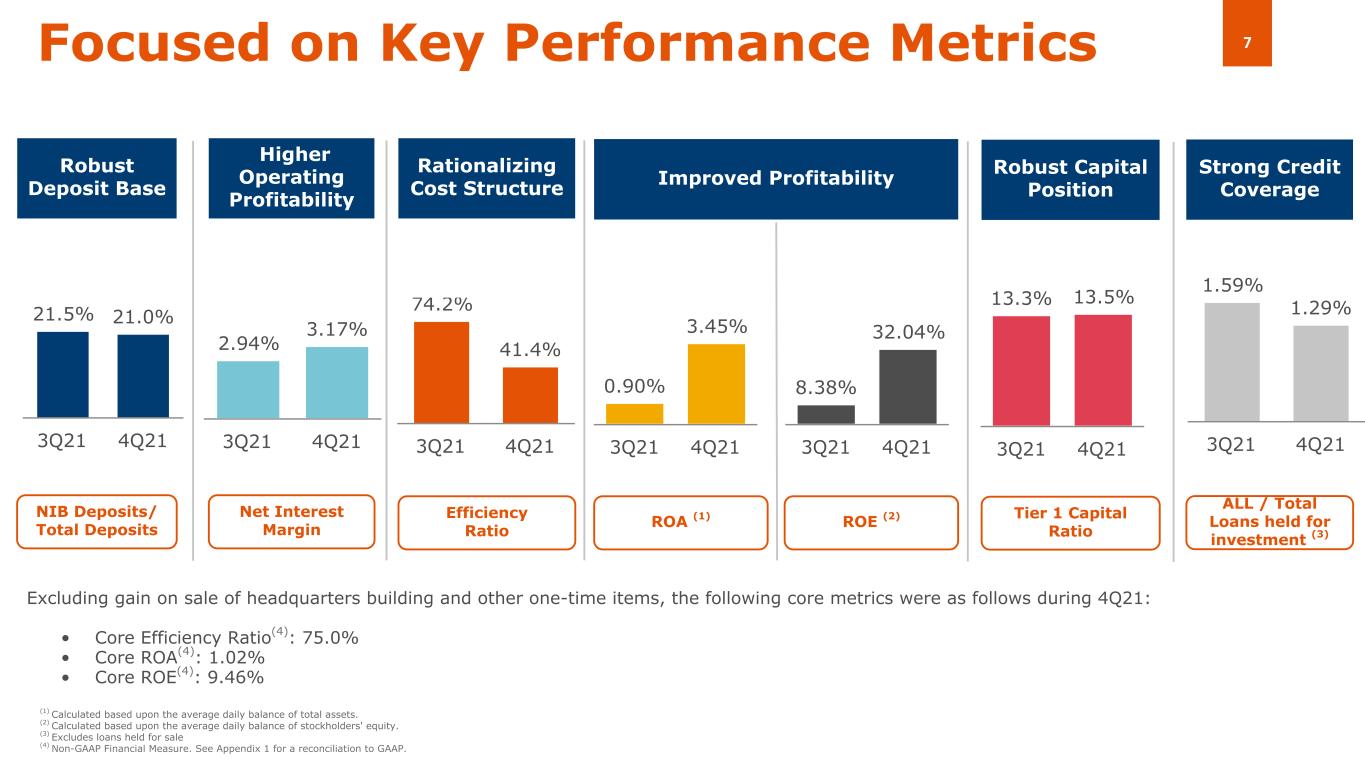
7 74.2% 41.4% 3Q21 4Q21 21.5% 21.0% 3Q21 4Q21 13.3% 13.5% 3Q21 4Q21 2.94% 3.17% 3Q21 4Q21 Focused on Key Performance Metrics Robust Deposit Base Robust Capital Position Higher Operating Profitability Rationalizing Cost Structure (1) Calculated based upon the average daily balance of total assets. (2) Calculated based upon the average daily balance of stockholders' equity. (3) Excludes loans held for sale (4) Non-GAAP Financial Measure. See Appendix 1 for a reconciliation to GAAP. 1.59% 1.29% 3Q21 4Q21 Strong Credit Coverage 0.90% 3.45% 3Q21 4Q21 Improved Profitability 8.38% 32.04% 3Q21 4Q21 NIB Deposits/ Total Deposits Tier 1 Capital Ratio Net Interest Margin Efficiency Ratio ALL / Total Loans held for investment (3) ROA (1) ROE (2) Excluding gain on sale of headquarters building and other one-time items, the following core metrics were as follows during 4Q21: • Core Efficiency Ratio(4): 75.0% • Core ROA(4): 1.02% • Core ROE(4): 9.46%
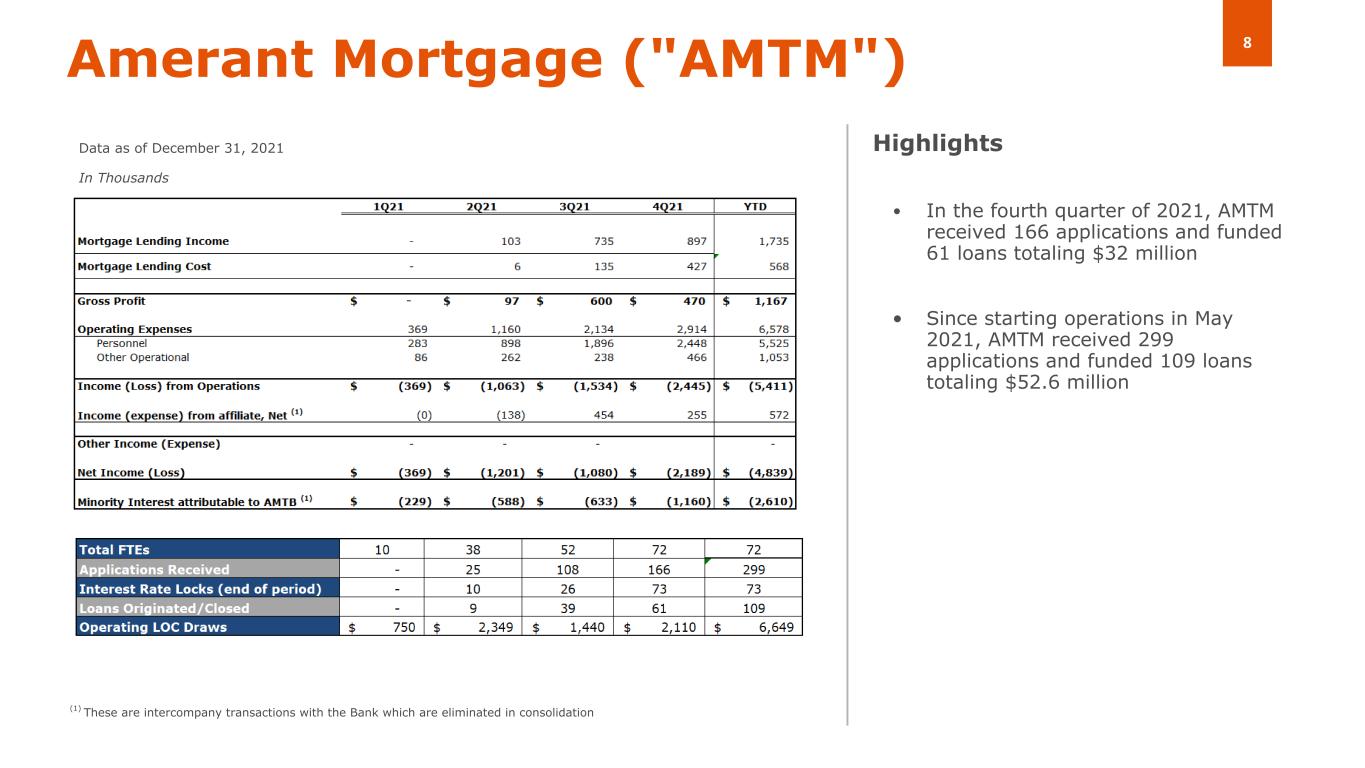
8Amerant Mortgage ("AMTM") • In the fourth quarter of 2021, AMTM received 166 applications and funded 61 loans totaling $32 million • Since starting operations in May 2021, AMTM received 299 applications and funded 109 loans totaling $52.6 million Data as of December 31, 2021 In Thousands Highlights (1) These are intercompany transactions with the Bank which are eliminated in consolidation
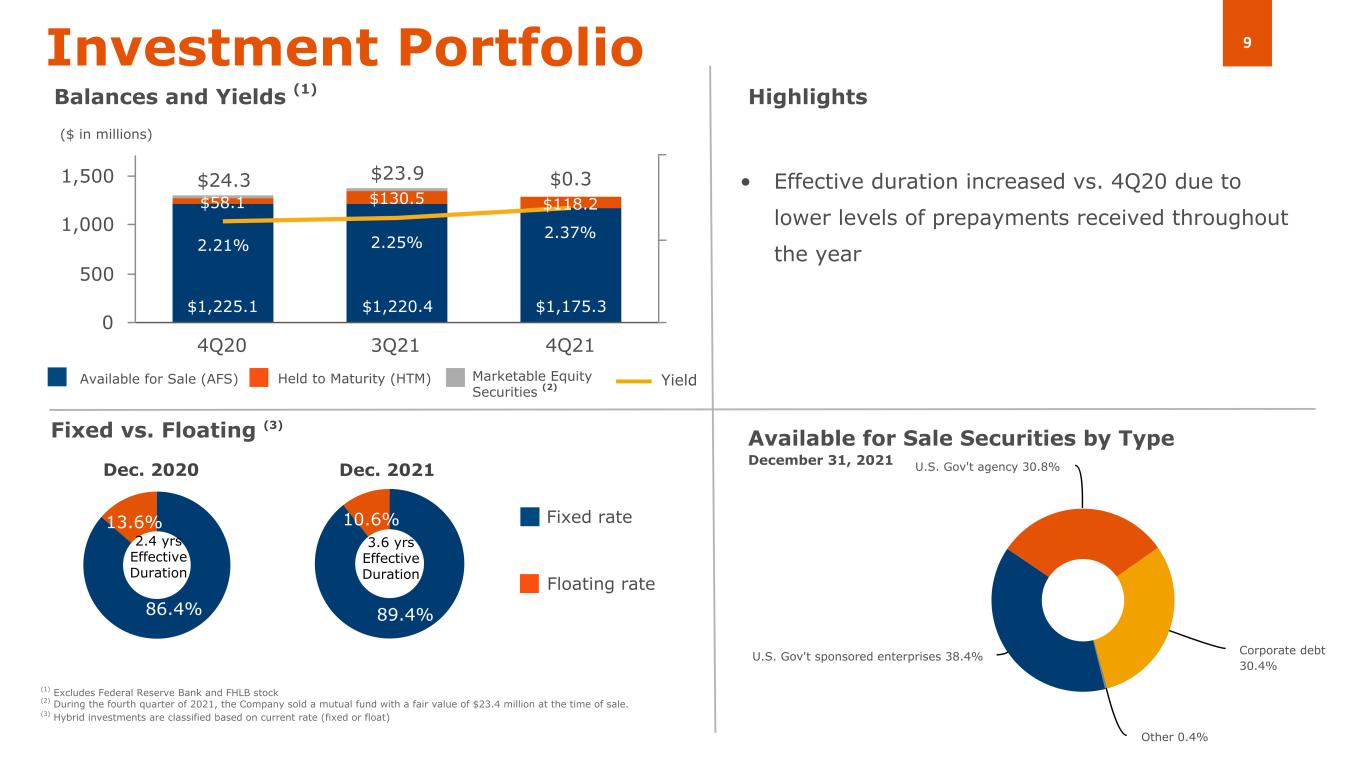
9 89.4% 10.6% U.S. Gov't sponsored enterprises 38.4% U.S. Gov't agency 30.8% Corporate debt 30.4% Other 0.4% $1,225.1 $1,220.4 $1,175.3 $58.1 $130.5 $118.2 $24.3 $23.9 $0.3 2.21% 2.25% 2.37% 4Q20 3Q21 4Q21 0 500 1,000 1,500 86.4% 13.6% • Effective duration increased vs. 4Q20 due to lower levels of prepayments received throughout the year Investment Portfolio Balances and Yields (1) Available for Sale (AFS) Held to Maturity (HTM) Highlights Fixed vs. Floating (3) Dec. 2020 Dec. 2021 Floating rate Fixed rate Available for Sale Securities by Type December 31, 2021 2.4 yrs Effective Duration ($ in millions) Marketable Equity Securities (2) (1) Excludes Federal Reserve Bank and FHLB stock (2) During the fourth quarter of 2021, the Company sold a mutual fund with a fair value of $23.4 million at the time of sale. (3) Hybrid investments are classified based on current rate (fixed or float) Yield 3.6 yrs Effective Duration
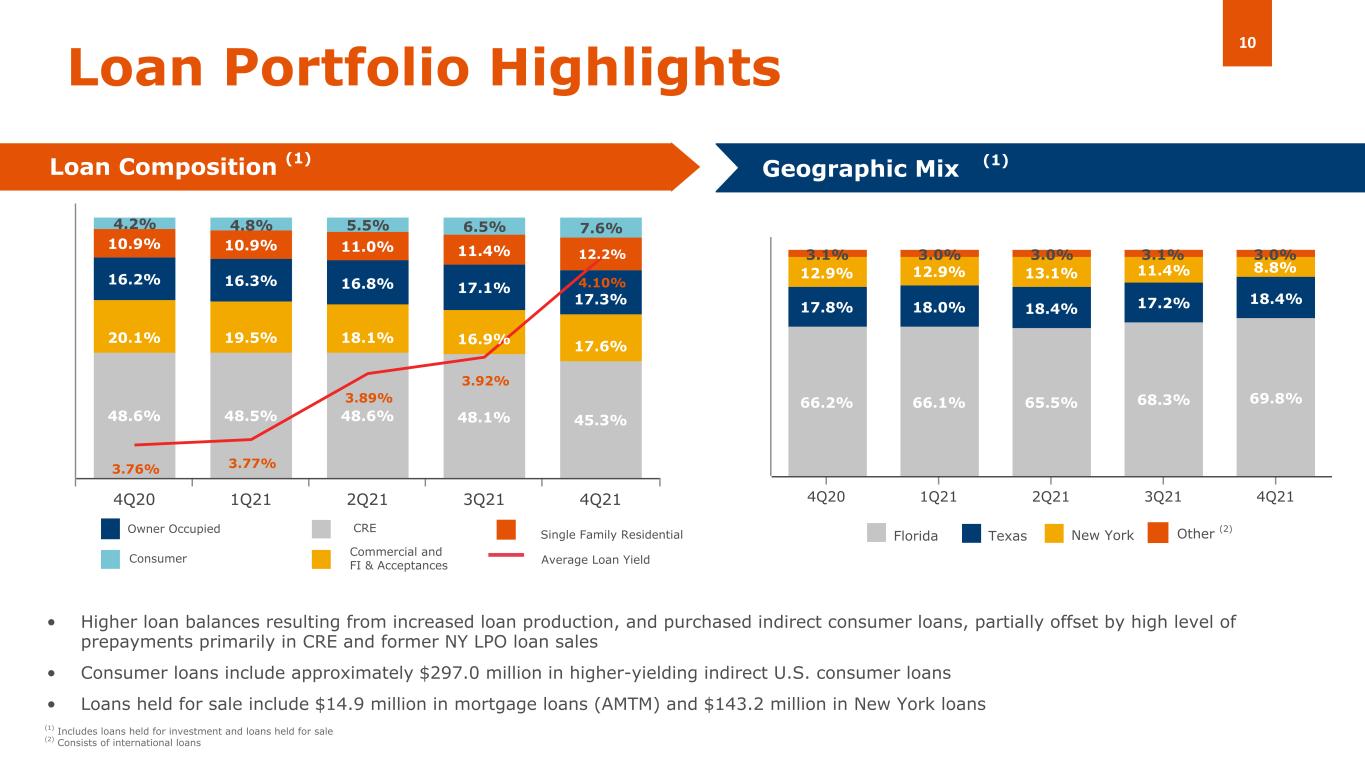
10 48.6% 48.5% 48.6% 48.1% 45.3% 20.1% 19.5% 18.1% 16.9% 17.6% 16.2% 16.3% 16.8% 17.1% 17.3% 10.9% 10.9% 11.0% 11.4% 12.2% 4.2% 4.8% 5.5% 6.5% 7.6% 3.76% 3.77% 3.89% 3.92% 4.10% 4Q20 1Q21 2Q21 3Q21 4Q21 66.2% 66.1% 65.5% 68.3% 69.8% 17.8% 18.0% 18.4% 17.2% 18.4% 12.9% 12.9% 13.1% 11.4% 8.8% 3.1% 3.0% 3.0% 3.1% 3.0% 4Q20 1Q21 2Q21 3Q21 4Q21 Consumer CRE Commercial and FI & Acceptances Owner Occupied Single Family Residential Loan Portfolio Highlights Loan Composition (1) Geographic Mix (Domestic) • Higher loan balances resulting from increased loan production, and purchased indirect consumer loans, partially offset by high level of prepayments primarily in CRE and former NY LPO loan sales • Consumer loans include approximately $297.0 million in higher-yielding indirect U.S. consumer loans • Loans held for sale include $14.9 million in mortgage loans (AMTM) and $143.2 million in New York loans (1) Florida Texas New York Average Loan Yield Other (2) (1) Includes loans held for investment and loans held for sale (2) Consists of international loans
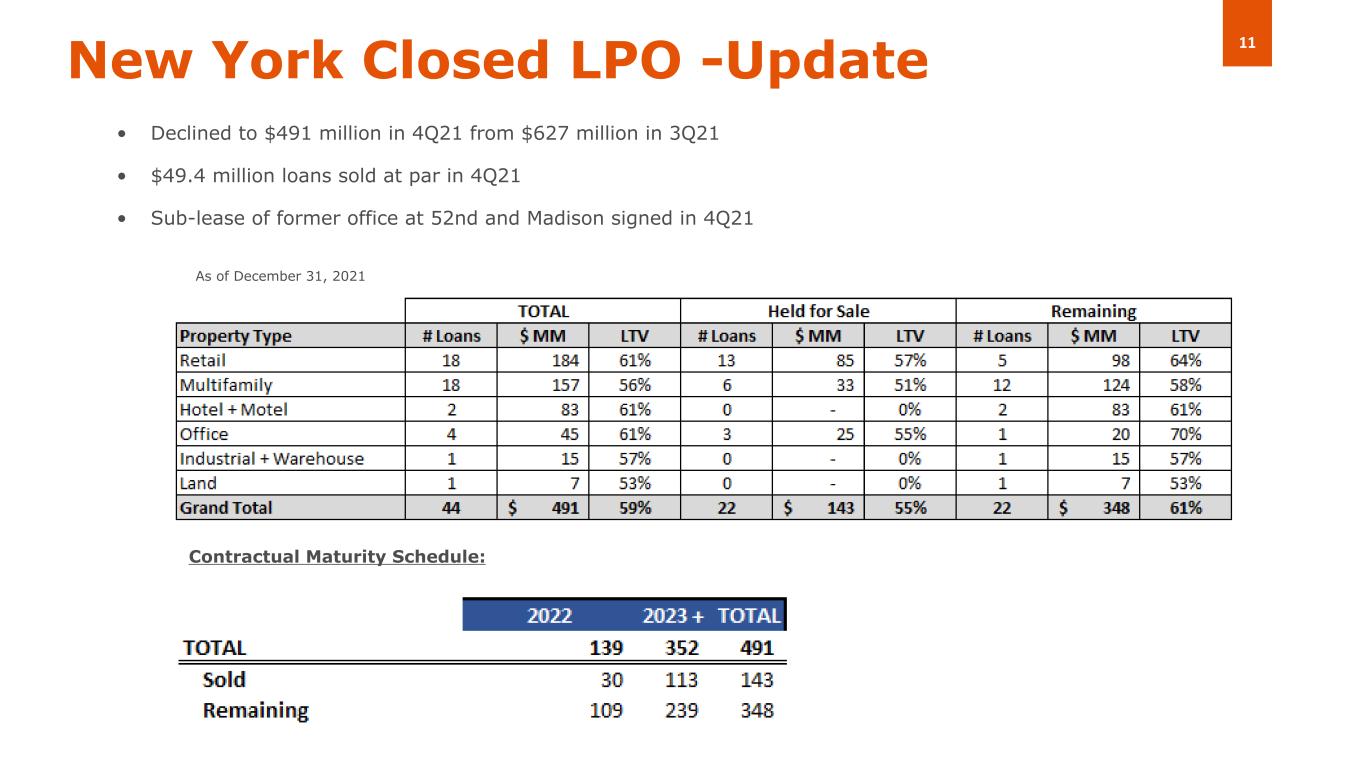
11New York Closed LPO -Update • Declined to $491 million in 4Q21 from $627 million in 3Q21 • $49.4 million loans sold at par in 4Q21 • Sub-lease of former office at 52nd and Madison signed in 4Q21 Contractual Maturity Schedule: As of December 31, 2021
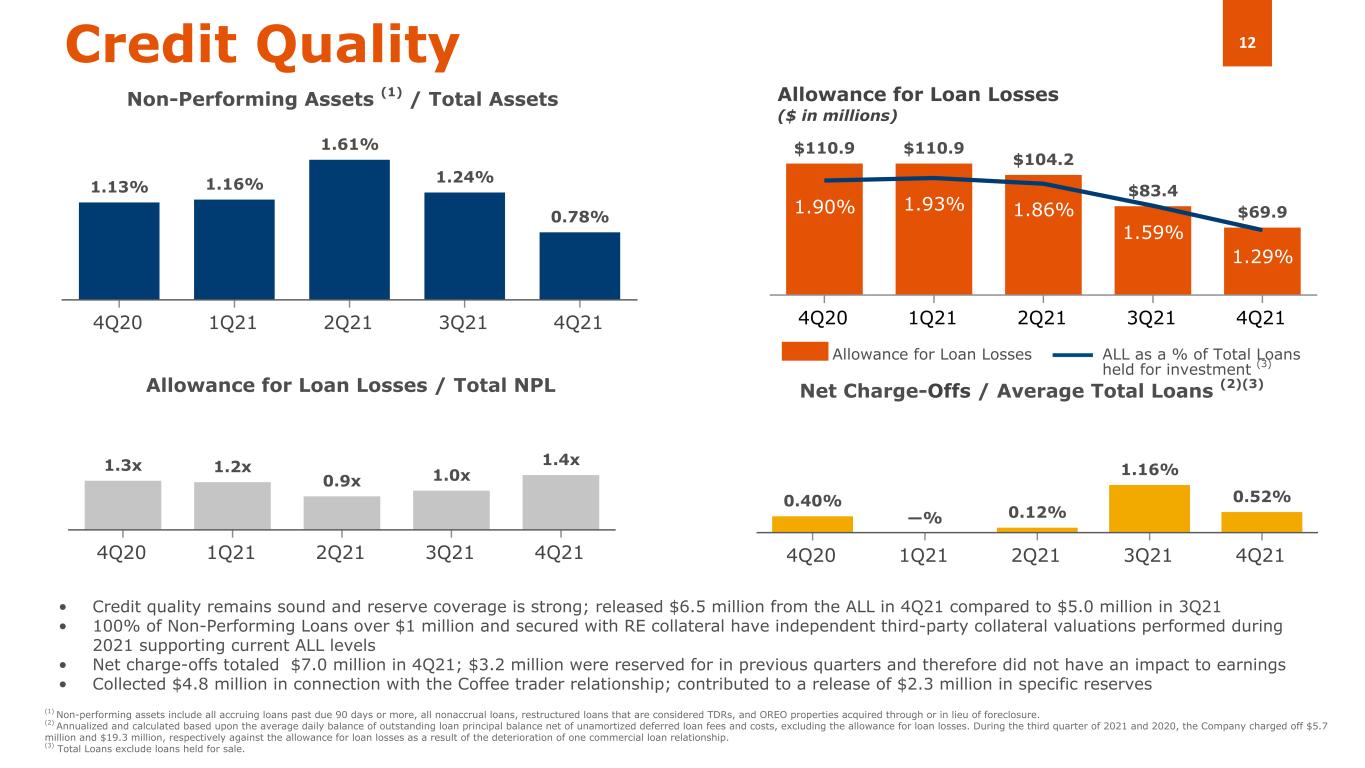
12 $110.9 $110.9 $104.2 $83.4 $69.91.90% 1.93% 1.86% 1.59% 1.29% 4Q20 1Q21 2Q21 3Q21 4Q21 0.40% —% 0.12% 1.16% 0.52% 4Q20 1Q21 2Q21 3Q21 4Q21 • Credit quality remains sound and reserve coverage is strong; released $6.5 million from the ALL in 4Q21 compared to $5.0 million in 3Q21 • 100% of Non-Performing Loans over $1 million and secured with RE collateral have independent third-party collateral valuations performed during 2021 supporting current ALL levels • Net charge-offs totaled $7.0 million in 4Q21; $3.2 million were reserved for in previous quarters and therefore did not have an impact to earnings • Collected $4.8 million in connection with the Coffee trader relationship; contributed to a release of $2.3 million in specific reserves Net Charge-Offs / Average Total Loans (2)(3) Credit Quality Allowance for Loan Losses ($ in millions) Non-Performing Assets (1) / Total Assets Allowance for Loan Losses / Total NPL Allowance for Loan Losses ALL as a % of Total Loans held for investment (3) (1) Non-performing assets include all accruing loans past due 90 days or more, all nonaccrual loans, restructured loans that are considered TDRs, and OREO properties acquired through or in lieu of foreclosure. (2) Annualized and calculated based upon the average daily balance of outstanding loan principal balance net of unamortized deferred loan fees and costs, excluding the allowance for loan losses. During the third quarter of 2021 and 2020, the Company charged off $5.7 million and $19.3 million, respectively against the allowance for loan losses as a result of the deterioration of one commercial loan relationship. (3) Total Loans exclude loans held for sale. 1.13% 1.16% 1.61% 1.24% 0.78% 4Q20 1Q21 2Q21 3Q21 4Q21 1.3x 1.2x 0.9x 1.0x 1.4x 4Q20 1Q21 2Q21 3Q21 4Q21
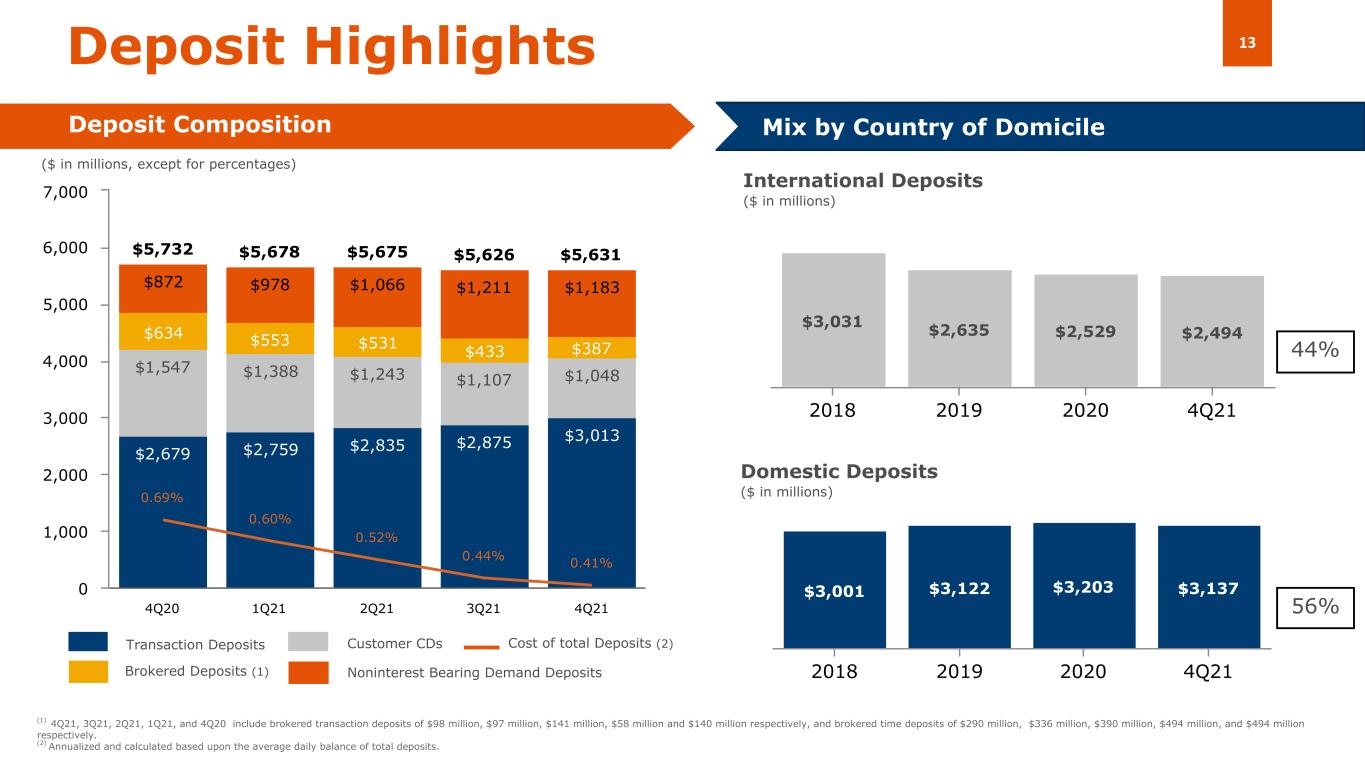
13 $5,732 $5,678 $5,675 $5,626 $5,631 $2,679 $2,759 $2,835 $2,875 $3,013 $1,547 $1,388 $1,243 $1,107 $1,048 $634 $553 $531 $433 $387 $872 $978 $1,066 $1,211 $1,183 0.69% 0.60% 0.52% 0.44% 0.41% 4Q20 1Q21 2Q21 3Q21 4Q21 0 1,000 2,000 3,000 4,000 5,000 6,000 7,000 $3,031 $2,635 $2,529 $2,494 2018 2019 2020 4Q21 $3,001 $3,122 $3,203 $3,137 2018 2019 2020 4Q21 Domestic Deposits ($ in millions) Deposit Highlights Deposit Composition 56% International Deposits ($ in millions) Mix by Country of Domicile Transaction Deposits Customer CDs Brokered Deposits (1) Cost of total Deposits (2) ($ in millions, except for percentages) 44% (1) 4Q21, 3Q21, 2Q21, 1Q21, and 4Q20 include brokered transaction deposits of $98 million, $97 million, $141 million, $58 million and $140 million respectively, and brokered time deposits of $290 million, $336 million, $390 million, $494 million, and $494 million respectively. (2) Annualized and calculated based upon the average daily balance of total deposits. Noninterest Bearing Demand Deposits
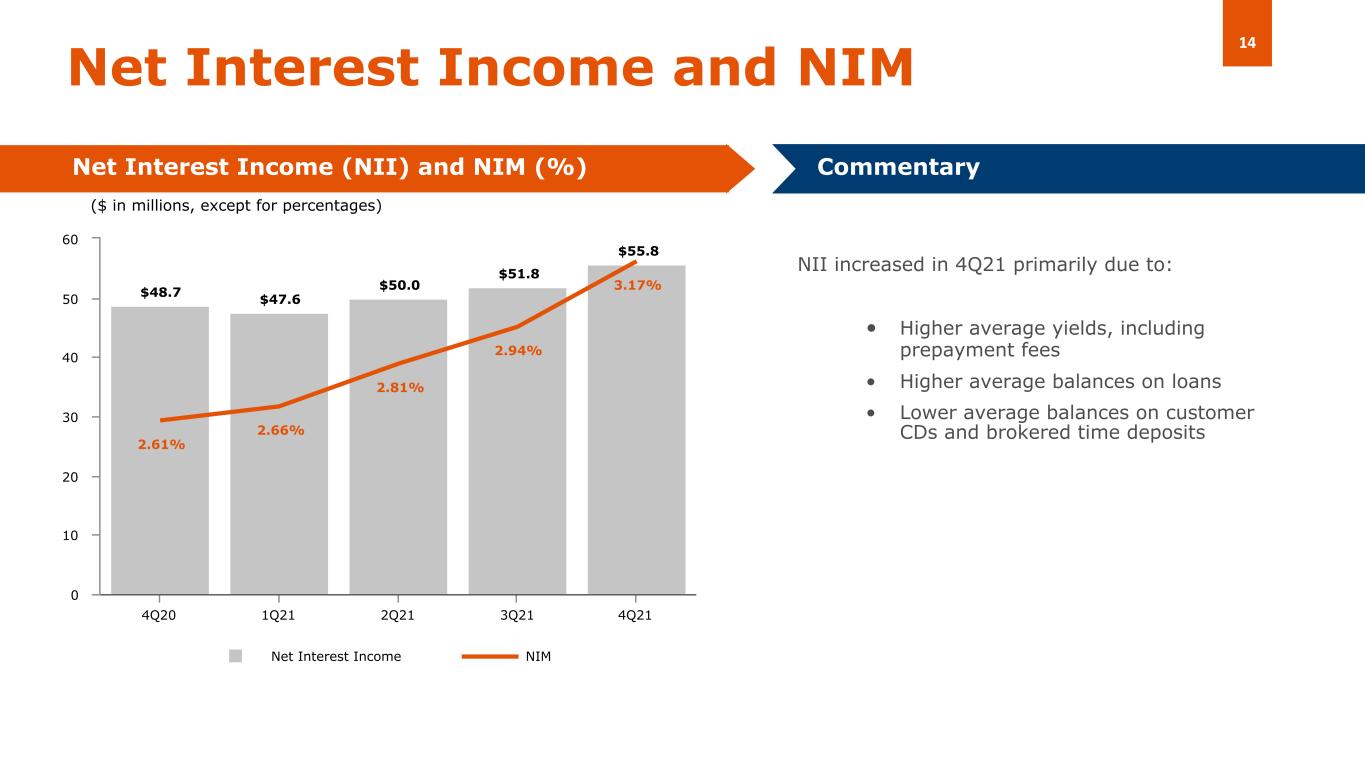
14 $48.7 $47.6 $50.0 $51.8 $55.8 2.61% 2.66% 2.81% 2.94% 3.17% Net Interest Income NIM 4Q20 1Q21 2Q21 3Q21 4Q21 0 10 20 30 40 50 60 NII increased in 4Q21 primarily due to: • Higher average yields, including prepayment fees • Higher average balances on loans • Lower average balances on customer CDs and brokered time deposits Net Interest Income and NIM Net Interest Income (NII) and NIM (%) Commentary ($ in millions, except for percentages)
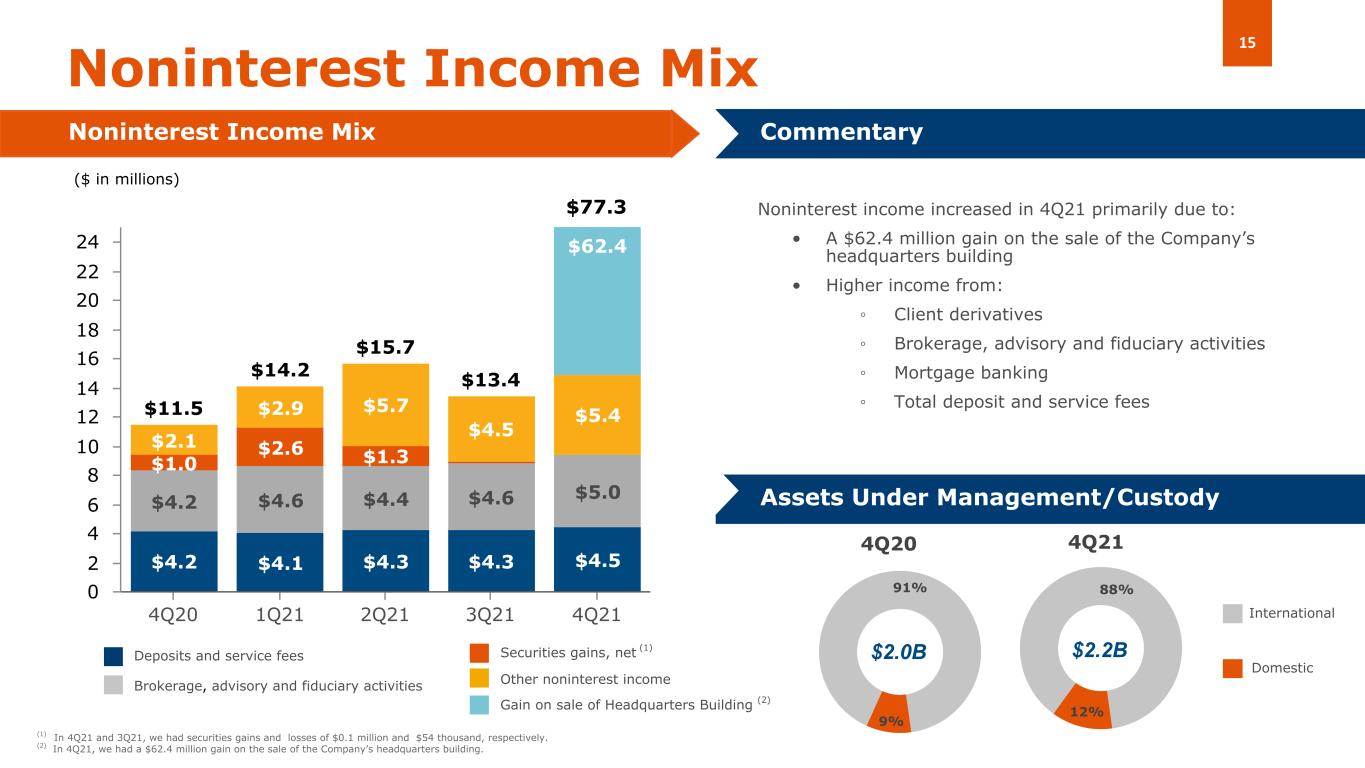
15 $11.5 $14.2 $15.7 $13.4 $4.2 $4.1 $4.3 $4.3 $4.5 $4.2 $4.6 $4.4 $4.6 $5.0 $1.0 $2.6 $1.3 $2.1 $2.9 $5.7 $4.5 $5.4 $62.4 4Q20 1Q21 2Q21 3Q21 4Q21 0 2 4 6 8 10 12 14 16 18 20 22 24 9% 91% 12% 88% Noninterest Income Mix Noninterest Income Mix Commentary Noninterest income increased in 4Q21 primarily due to: • A $62.4 million gain on the sale of the Company’s headquarters building • Higher income from: ◦ Client derivatives ◦ Brokerage, advisory and fiduciary activities ◦ Mortgage banking ◦ Total deposit and service fees Assets Under Management/Custody Deposits and service fees Brokerage, advisory and fiduciary activities Other noninterest income $2.2B Domestic International 4Q214Q20 $2.0B ($ in millions) Securities gains, net (1) (1) In 4Q21 and 3Q21, we had securities gains and losses of $0.1 million and $54 thousand, respectively. (2) In 4Q21, we had a $62.4 million gain on the sale of the Company’s headquarters building. $77.3 Gain on sale of Headquarters Building (2)
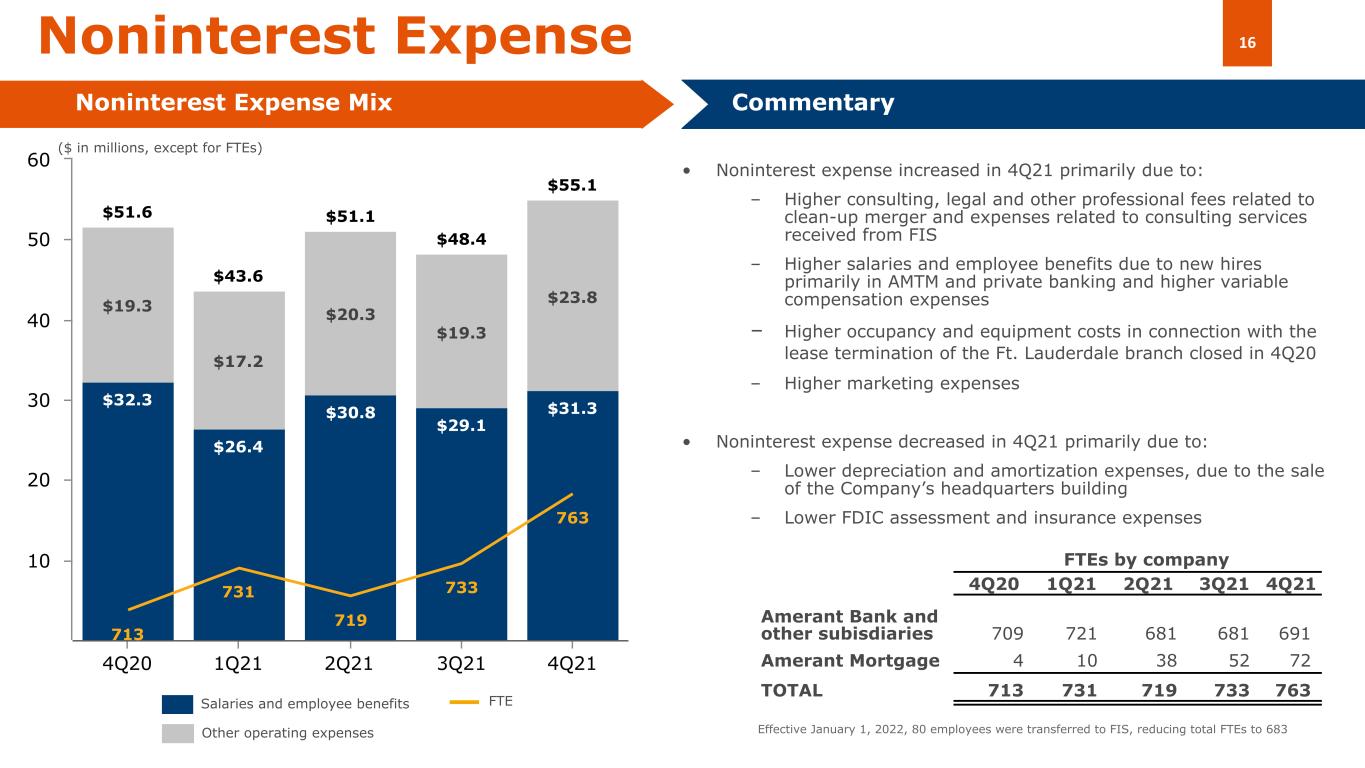
16 • Noninterest expense increased in 4Q21 primarily due to: – Higher consulting, legal and other professional fees related to clean-up merger and expenses related to consulting services received from FIS – Higher salaries and employee benefits due to new hires primarily in AMTM and private banking and higher variable compensation expenses – Higher occupancy and equipment costs in connection with the lease termination of the Ft. Lauderdale branch closed in 4Q20 – Higher marketing expenses • Noninterest expense decreased in 4Q21 primarily due to: – Lower depreciation and amortization expenses, due to the sale of the Company’s headquarters building – Lower FDIC assessment and insurance expenses $51.6 $43.6 $51.1 $48.4 $55.1 $32.3 $26.4 $30.8 $29.1 $31.3 $19.3 $17.2 $20.3 $19.3 $23.8 713 731 719 733 763 4Q20 1Q21 2Q21 3Q21 4Q21 10 20 30 40 50 60 Noninterest Expense Noninterest Expense Mix Commentary Other operating expenses Salaries and employee benefits FTE ($ in millions, except for FTEs) FTEs by company 4Q20 1Q21 2Q21 3Q21 4Q21 Amerant Bank and other subisdiaries 709 721 681 681 691 Amerant Mortgage 4 10 38 52 72 TOTAL 713 731 719 733 763 Effective January 1, 2022, 80 employees were transferred to FIS, reducing total FTEs to 683
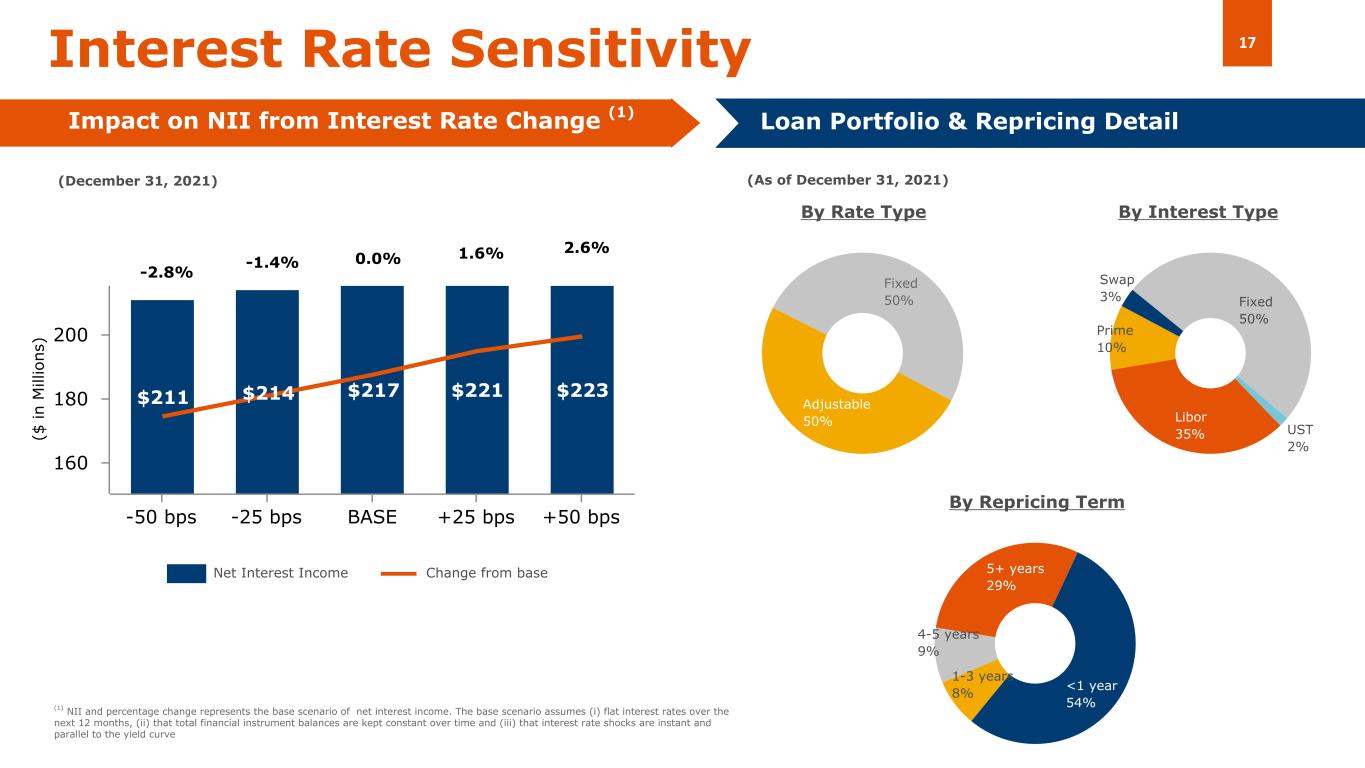
17 $211 $214 $217 $221 $223 -50 bps -25 bps BASE +25 bps +50 bps 160 180 200 (December 31, 2021) Fixed 50% Adjustable 50% Interest Rate Sensitivity By Interest TypeBy Rate Type By Repricing Term (1) NII and percentage change represents the base scenario of net interest income. The base scenario assumes (i) flat interest rates over the next 12 months, (ii) that total financial instrument balances are kept constant over time and (iii) that interest rate shocks are instant and parallel to the yield curve Loan Portfolio & Repricing Detail Impact on NII from Interest Rate Change (1) Net Interest Income Change from base <1 year 54% 1-3 years 8% 4-5 years 9% 5+ years 29% -2.8% -1.4% 0.0% 2.6%1.6% ($ in M ill io ns ) (As of December 31, 2021) Swap 3% Fixed 50% UST 2% Libor 35% Prime 10%
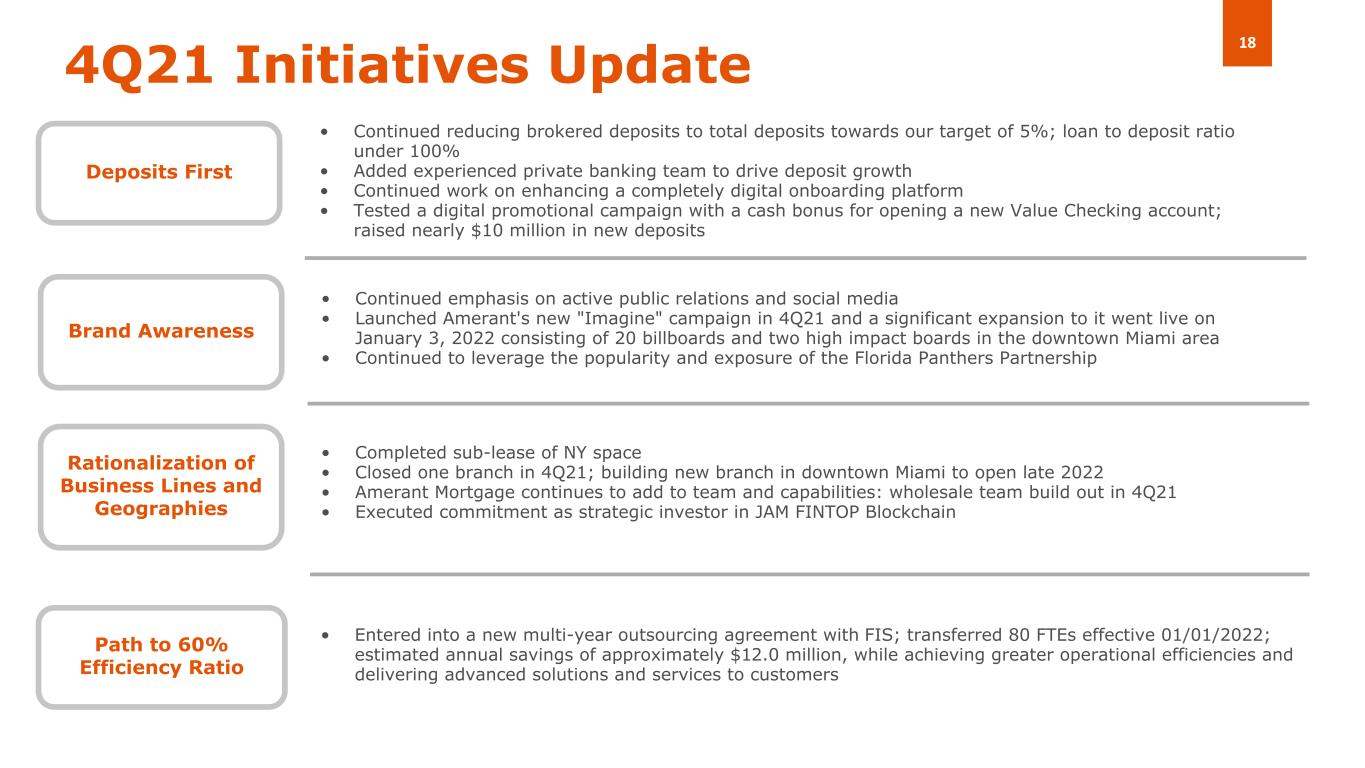
184Q21 Initiatives Update • Continued reducing brokered deposits to total deposits towards our target of 5%; loan to deposit ratio under 100% • Added experienced private banking team to drive deposit growth • Continued work on enhancing a completely digital onboarding platform • Tested a digital promotional campaign with a cash bonus for opening a new Value Checking account; raised nearly $10 million in new deposits Deposits First • Continued emphasis on active public relations and social media • Launched Amerant's new "Imagine" campaign in 4Q21 and a significant expansion to it went live on January 3, 2022 consisting of 20 billboards and two high impact boards in the downtown Miami area • Continued to leverage the popularity and exposure of the Florida Panthers Partnership Brand Awareness • Completed sub-lease of NY space • Closed one branch in 4Q21; building new branch in downtown Miami to open late 2022 • Amerant Mortgage continues to add to team and capabilities: wholesale team build out in 4Q21 • Executed commitment as strategic investor in JAM FINTOP Blockchain Rationalization of Business Lines and Geographies • Entered into a new multi-year outsourcing agreement with FIS; transferred 80 FTEs effective 01/01/2022; estimated annual savings of approximately $12.0 million, while achieving greater operational efficiencies and delivering advanced solutions and services to customers Path to 60% Efficiency Ratio
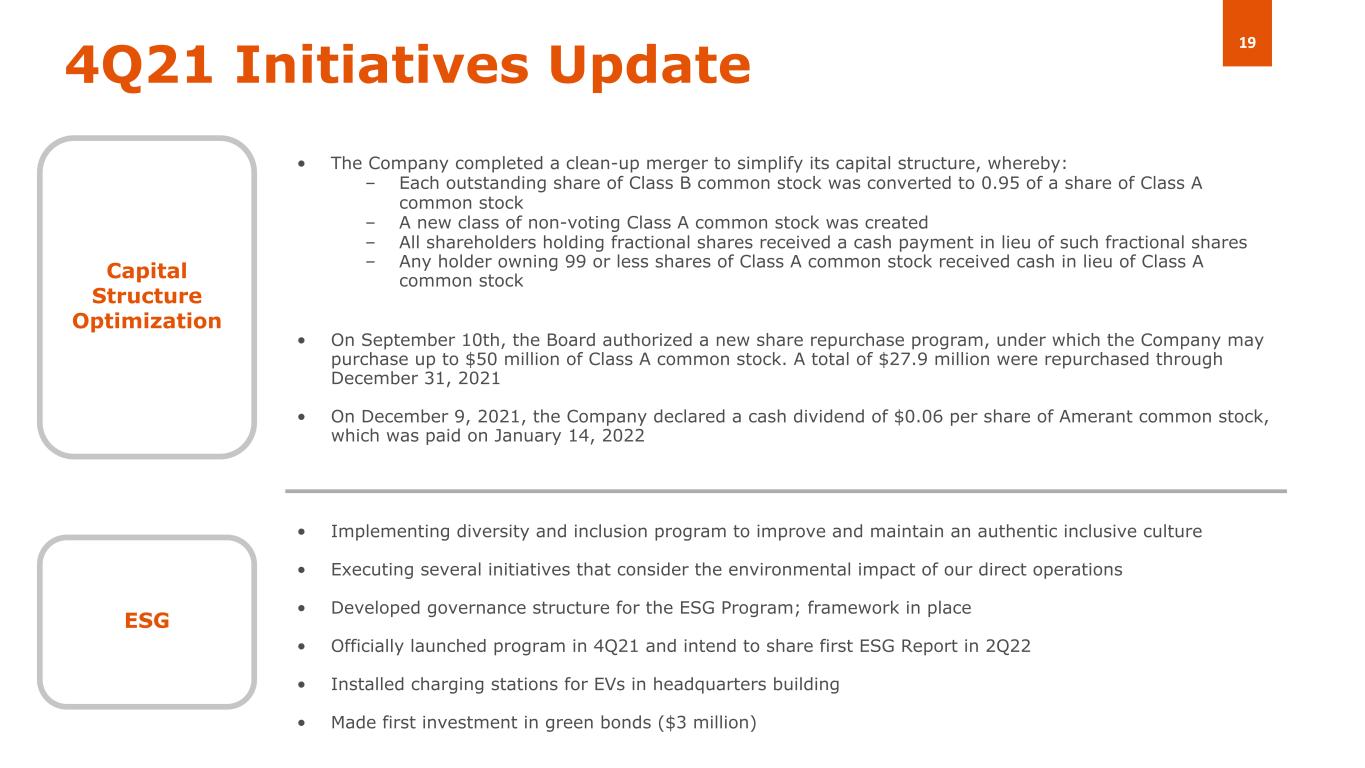
194Q21 Initiatives Update Focused on increasing profitability and shareholder value • The Company completed a clean-up merger to simplify its capital structure, whereby: – Each outstanding share of Class B common stock was converted to 0.95 of a share of Class A common stock – A new class of non-voting Class A common stock was created – All shareholders holding fractional shares received a cash payment in lieu of such fractional shares – Any holder owning 99 or less shares of Class A common stock received cash in lieu of Class A common stock • On September 10th, the Board authorized a new share repurchase program, under which the Company may purchase up to $50 million of Class A common stock. A total of $27.9 million were repurchased through December 31, 2021 • On December 9, 2021, the Company declared a cash dividend of $0.06 per share of Amerant common stock, which was paid on January 14, 2022 Capital Structure Optimization • Implementing diversity and inclusion program to improve and maintain an authentic inclusive culture • Executing several initiatives that consider the environmental impact of our direct operations • Developed governance structure for the ESG Program; framework in place • Officially launched program in 4Q21 and intend to share first ESG Report in 2Q22 • Installed charging stations for EVs in headquarters building • Made first investment in green bonds ($3 million) ESG
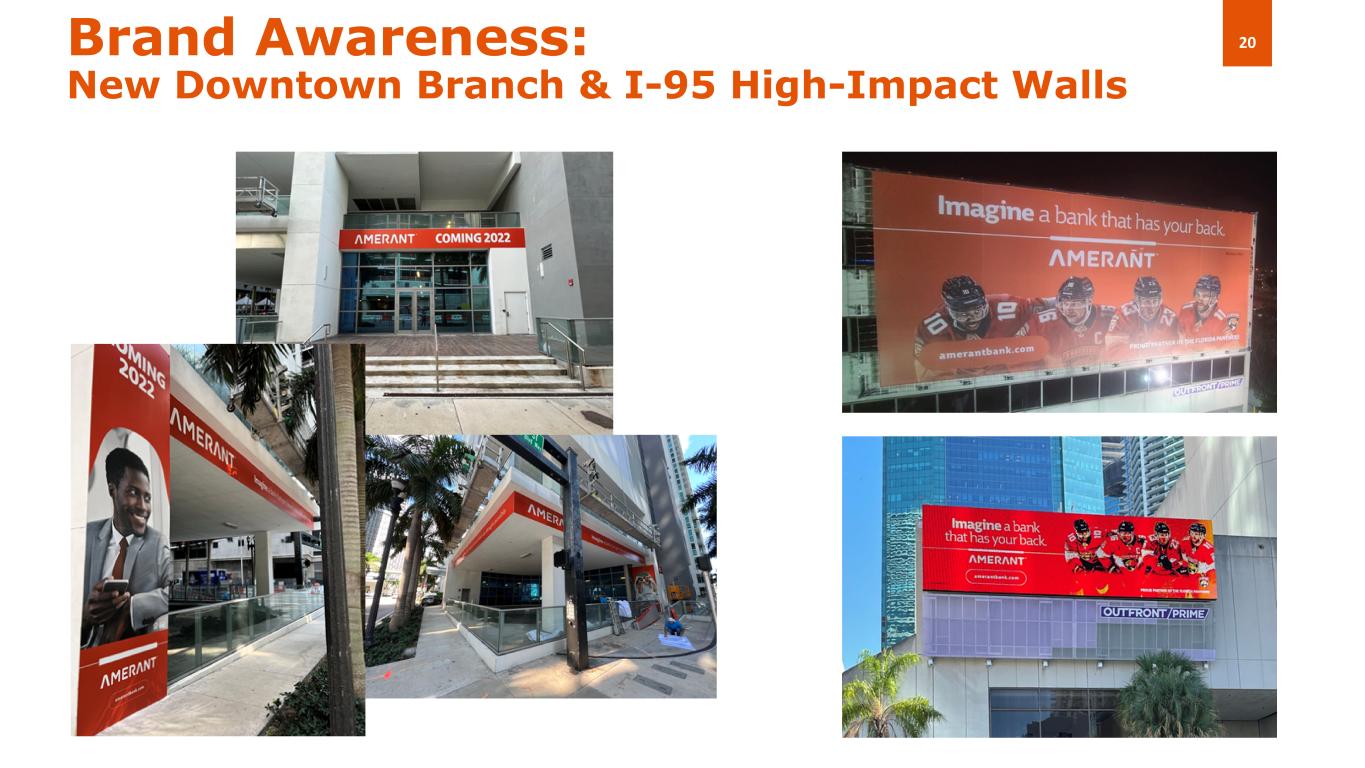
20Brand Awareness: New Downtown Branch & I-95 High-Impact Walls

Appendices
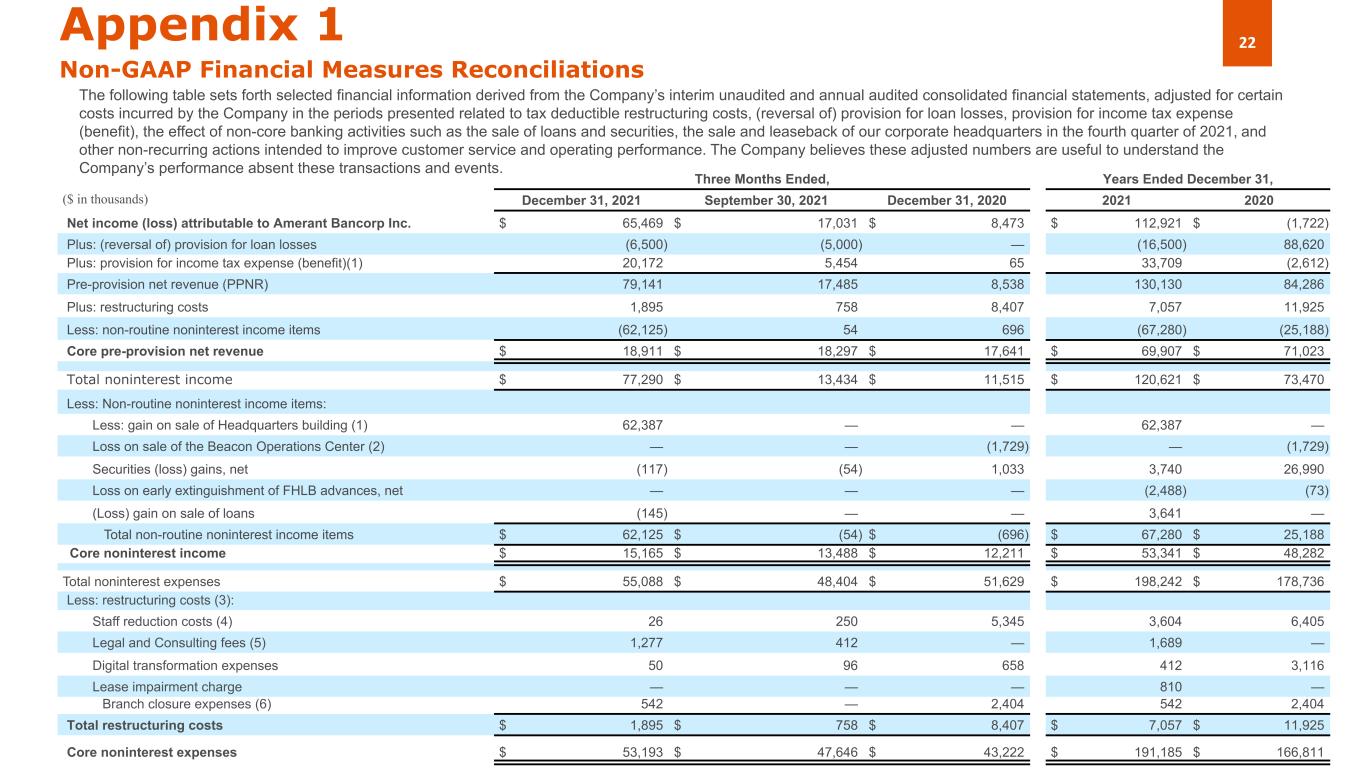
22Appendix 1 Non-GAAP Financial Measures Reconciliations The following table sets forth selected financial information derived from the Company’s interim unaudited and annual audited consolidated financial statements, adjusted for certain costs incurred by the Company in the periods presented related to tax deductible restructuring costs, (reversal of) provision for loan losses, provision for income tax expense (benefit), the effect of non-core banking activities such as the sale of loans and securities, the sale and leaseback of our corporate headquarters in the fourth quarter of 2021, and other non-recurring actions intended to improve customer service and operating performance. The Company believes these adjusted numbers are useful to understand the Company’s performance absent these transactions and events. Three Months Ended, Years Ended December 31, ($ in thousands) December 31, 2021 September 30, 2021 December 31, 2020 2021 2020 Net income (loss) attributable to Amerant Bancorp Inc. $ 65,469 $ 17,031 $ 8,473 $ 112,921 $ (1,722) Plus: (reversal of) provision for loan losses (6,500) (5,000) — (16,500) 88,620 Plus: provision for income tax expense (benefit)(1) 20,172 5,454 65 33,709 (2,612) Pre-provision net revenue (PPNR) 79,141 17,485 8,538 130,130 84,286 Plus: restructuring costs 1,895 758 8,407 7,057 11,925 Less: non-routine noninterest income items (62,125) 54 696 (67,280) (25,188) Core pre-provision net revenue $ 18,911 $ 18,297 $ 17,641 $ 69,907 $ 71,023 Total noninterest income $ 77,290 $ 13,434 $ 11,515 $ 120,621 $ 73,470 Less: Non-routine noninterest income items: Less: gain on sale of Headquarters building (1) 62,387 — — 62,387 — Loss on sale of the Beacon Operations Center (2) — — (1,729) — (1,729) Securities (loss) gains, net (117) (54) 1,033 3,740 26,990 Loss on early extinguishment of FHLB advances, net — — — (2,488) (73) (Loss) gain on sale of loans (145) — — 3,641 — Total non-routine noninterest income items $ 62,125 $ (54) $ (696) $ 67,280 $ 25,188 Core noninterest income $ 15,165 $ 13,488 $ 12,211 $ 53,341 $ 48,282 Total noninterest expenses $ 55,088 $ 48,404 $ 51,629 $ 198,242 $ 178,736 Less: restructuring costs (3): Staff reduction costs (4) 26 250 5,345 3,604 6,405 Legal and Consulting fees (5) 1,277 412 — 1,689 — Digital transformation expenses 50 96 658 412 3,116 Lease impairment charge — — — 810 — Branch closure expenses (6) 542 — 2,404 542 2,404 Total restructuring costs $ 1,895 $ 758 $ 8,407 $ 7,057 $ 11,925 Core noninterest expenses $ 53,193 $ 47,646 $ 43,222 $ 191,185 $ 166,811
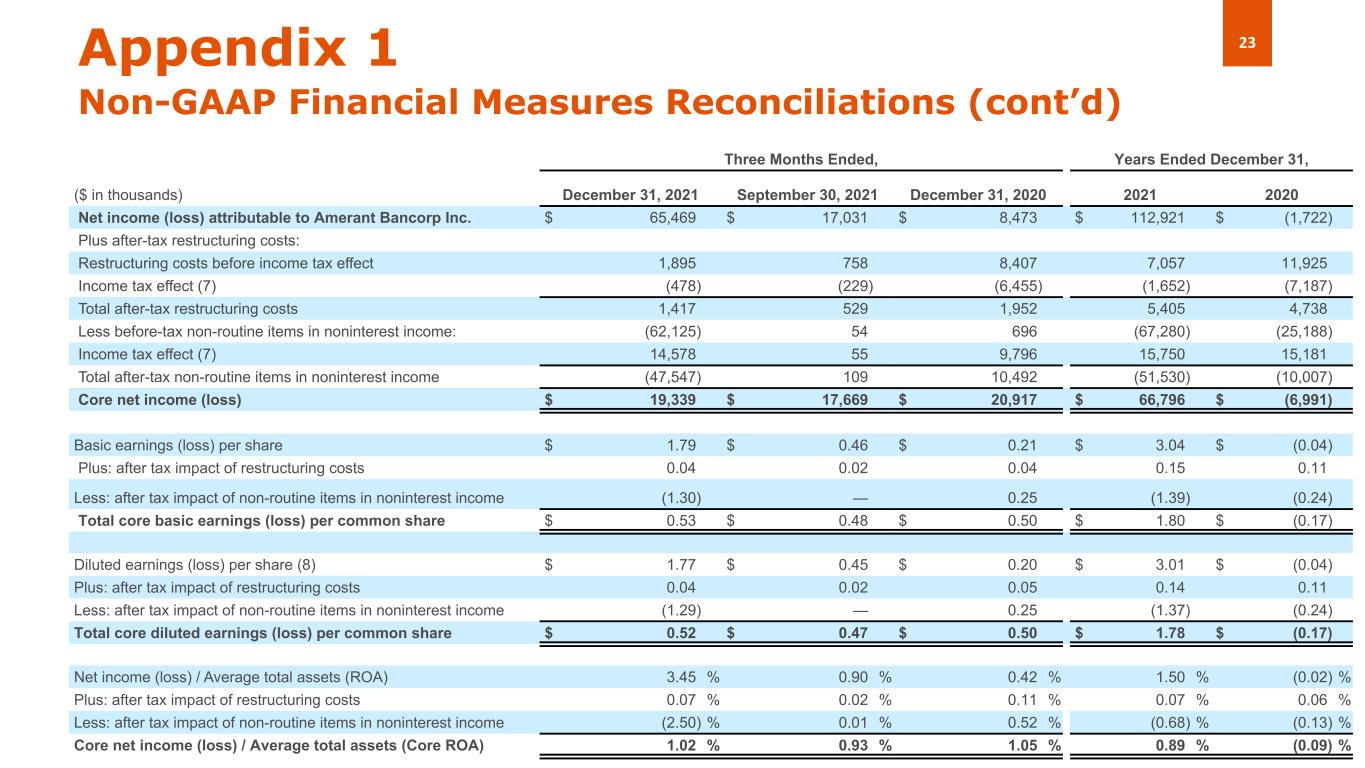
23Appendix 1 Non-GAAP Financial Measures Reconciliations (cont’d) Three Months Ended, Years Ended December 31, ($ in thousands) December 31, 2021 September 30, 2021 December 31, 2020 2021 2020 Net income (loss) attributable to Amerant Bancorp Inc. $ 65,469 $ 17,031 $ 8,473 $ 112,921 $ (1,722) Plus after-tax restructuring costs: Restructuring costs before income tax effect 1,895 758 8,407 7,057 11,925 Income tax effect (7) (478) (229) (6,455) (1,652) (7,187) Total after-tax restructuring costs 1,417 529 1,952 5,405 4,738 Less before-tax non-routine items in noninterest income: (62,125) 54 696 (67,280) (25,188) Income tax effect (7) 14,578 55 9,796 15,750 15,181 Total after-tax non-routine items in noninterest income (47,547) 109 10,492 (51,530) (10,007) Core net income (loss) $ 19,339 $ 17,669 $ 20,917 $ 66,796 $ (6,991) Basic earnings (loss) per share $ 1.79 $ 0.46 $ 0.21 $ 3.04 $ (0.04) Plus: after tax impact of restructuring costs 0.04 0.02 0.04 0.15 0.11 Less: after tax impact of non-routine items in noninterest income (1.30) — 0.25 (1.39) (0.24) Total core basic earnings (loss) per common share $ 0.53 $ 0.48 $ 0.50 $ 1.80 $ (0.17) Diluted earnings (loss) per share (8) $ 1.77 $ 0.45 $ 0.20 $ 3.01 $ (0.04) Plus: after tax impact of restructuring costs 0.04 0.02 0.05 0.14 0.11 Less: after tax impact of non-routine items in noninterest income (1.29) — 0.25 (1.37) (0.24) Total core diluted earnings (loss) per common share $ 0.52 $ 0.47 $ 0.50 $ 1.78 $ (0.17) Net income (loss) / Average total assets (ROA) 3.45 % 0.90 % 0.42 % 1.50 % (0.02) % Plus: after tax impact of restructuring costs 0.07 % 0.02 % 0.11 % 0.07 % 0.06 % Less: after tax impact of non-routine items in noninterest income (2.50) % 0.01 % 0.52 % (0.68) % (0.13) % Core net income (loss) / Average total assets (Core ROA) 1.02 % 0.93 % 1.05 % 0.89 % (0.09) %
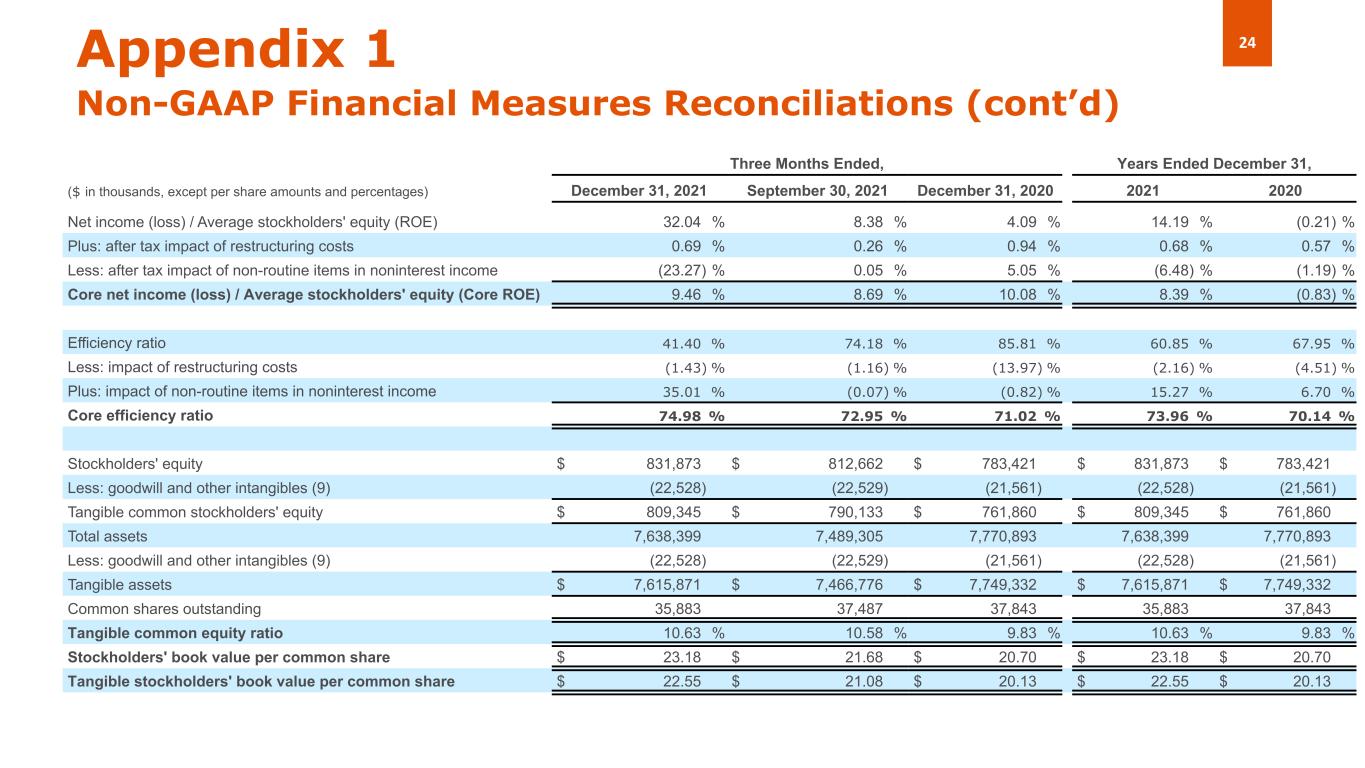
24Appendix 1 Non-GAAP Financial Measures Reconciliations (cont’d) Three Months Ended, Years Ended December 31, ($ in thousands, except per share amounts and percentages) December 31, 2021 September 30, 2021 December 31, 2020 2021 2020 Net income (loss) / Average stockholders' equity (ROE) 32.04 % 8.38 % 4.09 % 14.19 % (0.21) % Plus: after tax impact of restructuring costs 0.69 % 0.26 % 0.94 % 0.68 % 0.57 % Less: after tax impact of non-routine items in noninterest income (23.27) % 0.05 % 5.05 % (6.48) % (1.19) % Core net income (loss) / Average stockholders' equity (Core ROE) 9.46 % 8.69 % 10.08 % 8.39 % (0.83) % Efficiency ratio 41.40 % 74.18 % 85.81 % 60.85 % 67.95 % Less: impact of restructuring costs (1.43) % (1.16) % (13.97) % (2.16) % (4.51) % Plus: impact of non-routine items in noninterest income 35.01 % (0.07) % (0.82) % 15.27 % 6.70 % Core efficiency ratio 74.98 % 72.95 % 71.02 % 73.96 % 70.14 % Stockholders' equity $ 831,873 $ 812,662 $ 783,421 $ 831,873 $ 783,421 Less: goodwill and other intangibles (9) (22,528) (22,529) (21,561) (22,528) (21,561) Tangible common stockholders' equity $ 809,345 $ 790,133 $ 761,860 $ 809,345 $ 761,860 Total assets 7,638,399 7,489,305 7,770,893 7,638,399 7,770,893 Less: goodwill and other intangibles (9) (22,528) (22,529) (21,561) (22,528) (21,561) Tangible assets $ 7,615,871 $ 7,466,776 $ 7,749,332 $ 7,615,871 $ 7,749,332 Common shares outstanding 35,883 37,487 37,843 35,883 37,843 Tangible common equity ratio 10.63 % 10.58 % 9.83 % 10.63 % 9.83 % Stockholders' book value per common share $ 23.18 $ 21.68 $ 20.70 $ 23.18 $ 20.70 Tangible stockholders' book value per common share $ 22.55 $ 21.08 $ 20.13 $ 22.55 $ 20.13
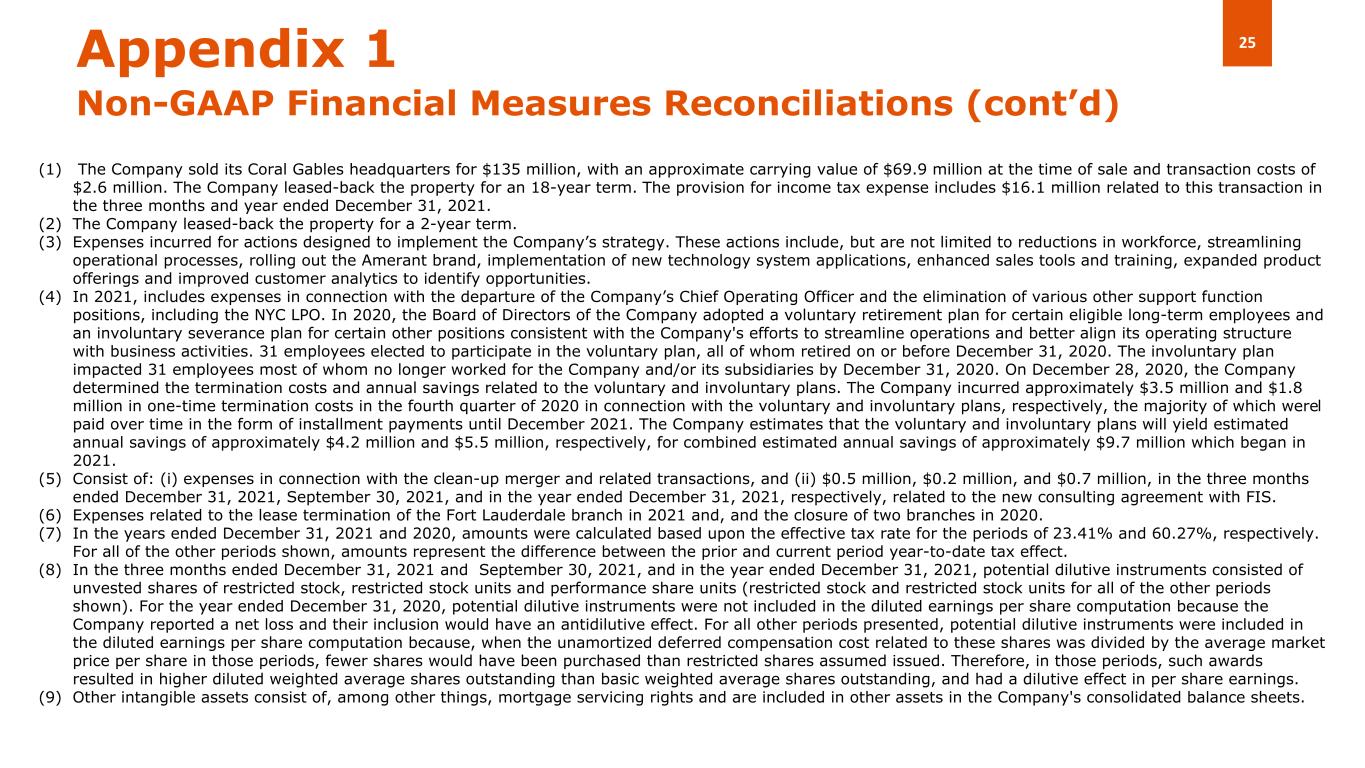
25Appendix 1 Non-GAAP Financial Measures Reconciliations (cont’d) (1) The Company sold its Coral Gables headquarters for $135 million, with an approximate carrying value of $69.9 million at the time of sale and transaction costs of $2.6 million. The Company leased-back the property for an 18-year term. The provision for income tax expense includes $16.1 million related to this transaction in the three months and year ended December 31, 2021. (2) The Company leased-back the property for a 2-year term. (3) Expenses incurred for actions designed to implement the Company’s strategy. These actions include, but are not limited to reductions in workforce, streamlining operational processes, rolling out the Amerant brand, implementation of new technology system applications, enhanced sales tools and training, expanded product offerings and improved customer analytics to identify opportunities. (4) In 2021, includes expenses in connection with the departure of the Company’s Chief Operating Officer and the elimination of various other support function positions, including the NYC LPO. In 2020, the Board of Directors of the Company adopted a voluntary retirement plan for certain eligible long-term employees and an involuntary severance plan for certain other positions consistent with the Company's efforts to streamline operations and better align its operating structure with business activities. 31 employees elected to participate in the voluntary plan, all of whom retired on or before December 31, 2020. The involuntary plan impacted 31 employees most of whom no longer worked for the Company and/or its subsidiaries by December 31, 2020. On December 28, 2020, the Company determined the termination costs and annual savings related to the voluntary and involuntary plans. The Company incurred approximately $3.5 million and $1.8 million in one-time termination costs in the fourth quarter of 2020 in connection with the voluntary and involuntary plans, respectively, the majority of which werel paid over time in the form of installment payments until December 2021. The Company estimates that the voluntary and involuntary plans will yield estimated annual savings of approximately $4.2 million and $5.5 million, respectively, for combined estimated annual savings of approximately $9.7 million which began in 2021. (5) Consist of: (i) expenses in connection with the clean-up merger and related transactions, and (ii) $0.5 million, $0.2 million, and $0.7 million, in the three months ended December 31, 2021, September 30, 2021, and in the year ended December 31, 2021, respectively, related to the new consulting agreement with FIS. (6) Expenses related to the lease termination of the Fort Lauderdale branch in 2021 and, and the closure of two branches in 2020. (7) In the years ended December 31, 2021 and 2020, amounts were calculated based upon the effective tax rate for the periods of 23.41% and 60.27%, respectively. For all of the other periods shown, amounts represent the difference between the prior and current period year-to-date tax effect. (8) In the three months ended December 31, 2021 and September 30, 2021, and in the year ended December 31, 2021, potential dilutive instruments consisted of unvested shares of restricted stock, restricted stock units and performance share units (restricted stock and restricted stock units for all of the other periods shown). For the year ended December 31, 2020, potential dilutive instruments were not included in the diluted earnings per share computation because the Company reported a net loss and their inclusion would have an antidilutive effect. For all other periods presented, potential dilutive instruments were included in the diluted earnings per share computation because, when the unamortized deferred compensation cost related to these shares was divided by the average market price per share in those periods, fewer shares would have been purchased than restricted shares assumed issued. Therefore, in those periods, such awards resulted in higher diluted weighted average shares outstanding than basic weighted average shares outstanding, and had a dilutive effect in per share earnings. (9) Other intangible assets consist of, among other things, mortgage servicing rights and are included in other assets in the Company's consolidated balance sheets.

Thank you Investor Relations InvestorRelations@amerantbank.com