Earnings Call October 21, 2022 Third Quarter 2022
2 Forward-Looking Statements This presentation contains “forward-looking statements” including statements with respect to the Company’s objectives, expectations and intentions and other statements that are not historical facts. All statements other than statements of historical fact are statements that could be forward-looking statements. You can identify these forward-looking statements through our use of words such as “may,” “will,” “anticipate,” “assume,” “should,” “indicate,” “would,” “believe,” “contemplate,” “expect,” “estimate,” “continue,” “plan,” “point to,” “project,” “could,” “intend,” “target,” “goals,” “outlooks,” “modeled,” “dedicated,” “create,” and other similar words and expressions of the future. Forward-looking statements, including those relating to our beliefs, plans, objectives, goals, expectations, anticipations, estimates and intentions, involve known and unknown risks, uncertainties and other factors, which may be beyond our control, and which may cause the Company’s actual results, performance, achievements, or financial condition to be materially different from future results, performance, achievements, or financial condition expressed or implied by such forward-looking statements. You should not rely on any forward- looking statements as predictions of future events. You should not expect us to update any forward-looking statements, except as required by law. All written or oral forward-looking statements attributable to us are expressly qualified in their entirety by this cautionary notice, together with those risks and uncertainties described in “Risk factors” in our annual report on Form 10-K for the fiscal year ended December 31, 2021, our quarterly reports on Form 10-Q for the quarter ended March 31, 2022 and June 30, 2022, and in our other filings with the U.S. Securities and Exchange Commission (the “SEC”), which are available at the SEC’s website www.sec.gov. Interim Financial Information Unaudited financial information as of and for interim periods, including the three and nine month periods ended September 30, 2022 and 2021, may not reflect our results of operations for our fiscal year ending, or financial condition as of December 31, 2022, or any other period of time or date. Non-GAAP Financial Measures The Company supplements its financial results that are determined in accordance with accounting principles generally accepted in the United States of America (“GAAP”) with non- GAAP financial measures, such as “pre-provision net revenue (PPNR)”, “core pre-provision net revenue (Core PPNR)”, “core noninterest income”, “core noninterest expenses”, “core net income (loss)”, “core earnings (loss) per share (basic and diluted)”, “core return on assets (Core ROA)”, “core return on equity (Core ROE)”, “core efficiency ratio”, and “tangible stockholders’ equity book value per common share”. This supplemental information is not required by, or is not presented in accordance with GAAP. The Company refers to these financial measures and ratios as “non-GAAP financial measures” and they should not be considered in isolation or as a substitute for the GAAP measures presented herein. We use certain non-GAAP financial measures, including those mentioned above, both to explain our results to shareholders and the investment community and in the internal evaluation and management of our businesses. Our management believes that these non-GAAP financial measures and the information they provide are useful to investors since these measures permit investors to view our performance using the same tools that our management uses to evaluate our past performance and prospects for future performance, especially in light of the additional costs we have incurred in connection with the Company’s restructuring activities that began in 2018 and continued in 2022, including the effect of non-core banking activities such as the sale of loans and securities, the valuation of securities, derivatives, loans held for sale and other real estate owned, the sale of our corporate headquarters in the fourth quarter of 2021, and other non-routine actions intended to improve customer service and operating performance. While we believe that these non-GAAP financial measures are useful in evaluating our performance, this information should be considered as supplemental and not as a substitute for or superior to the related financial information prepared in accordance with GAAP. Additionally, these non-GAAP financial measures may differ from similar measures presented by other companies. Appendix 1 reconciles these non-GAAP financial measures to reported results. Important Notices and Disclaimers
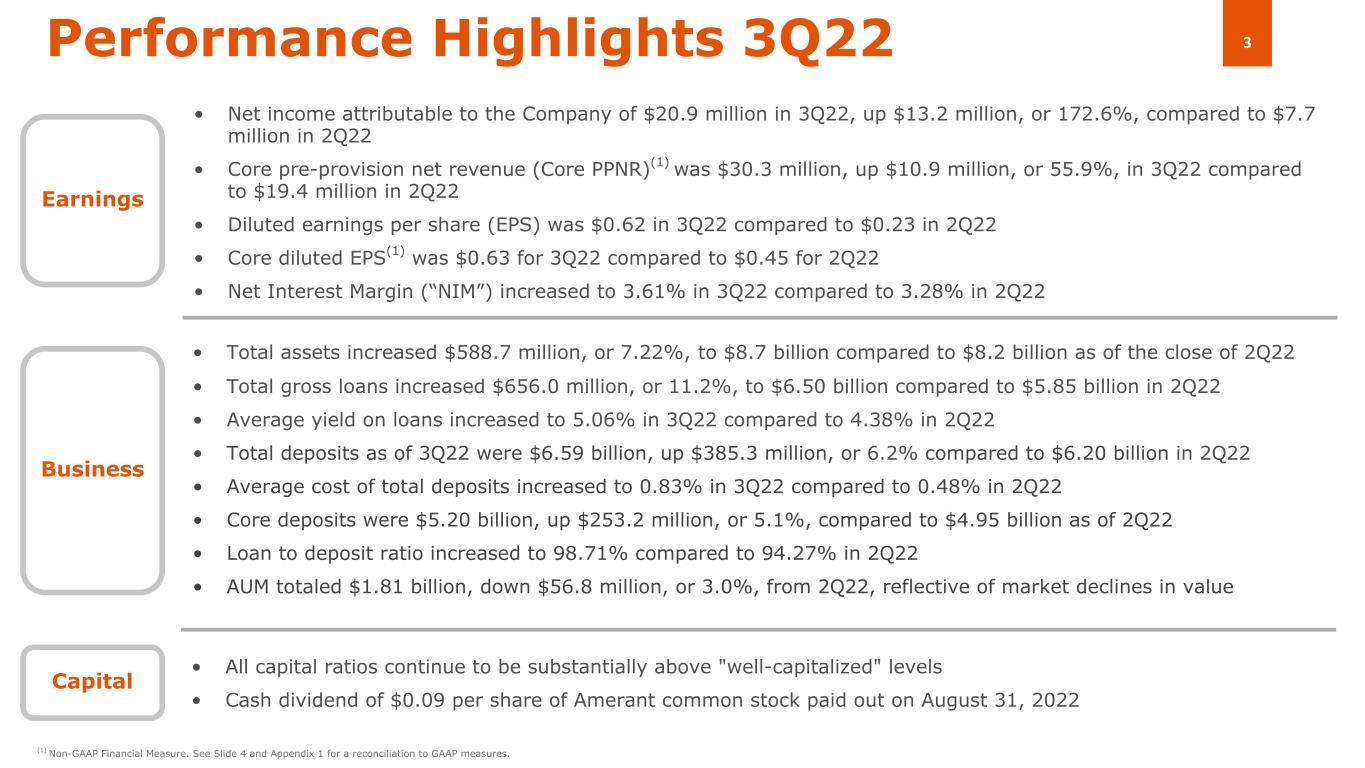
3Performance Highlights 3Q22 Business • Net income attributable to the Company of $20.9 million in 3Q22, up $13.2 million, or 172.6%, compared to $7.7 million in 2Q22 • Core pre-provision net revenue (Core PPNR)(1) was $30.3 million, up $10.9 million, or 55.9%, in 3Q22 compared to $19.4 million in 2Q22 • Diluted earnings per share (EPS) was $0.62 in 3Q22 compared to $0.23 in 2Q22 • Core diluted EPS(1) was $0.63 for 3Q22 compared to $0.45 for 2Q22 • Net Interest Margin (“NIM”) increased to 3.61% in 3Q22 compared to 3.28% in 2Q22 • Total assets increased $588.7 million, or 7.22%, to $8.7 billion compared to $8.2 billion as of the close of 2Q22 • Total gross loans increased $656.0 million, or 11.2%, to $6.50 billion compared to $5.85 billion in 2Q22 • Average yield on loans increased to 5.06% in 3Q22 compared to 4.38% in 2Q22 • Total deposits as of 3Q22 were $6.59 billion, up $385.3 million, or 6.2% compared to $6.20 billion in 2Q22 • Average cost of total deposits increased to 0.83% in 3Q22 compared to 0.48% in 2Q22 • Core deposits were $5.20 billion, up $253.2 million, or 5.1%, compared to $4.95 billion as of 2Q22 • Loan to deposit ratio increased to 98.71% compared to 94.27% in 2Q22 • AUM totaled $1.81 billion, down $56.8 million, or 3.0%, from 2Q22, reflective of market declines in value Earnings (1) Non-GAAP Financial Measure. See Slide 4 and Appendix 1 for a reconciliation to GAAP measures. Capital • All capital ratios continue to be substantially above "well-capitalized" levels • Cash dividend of $0.09 per share of Amerant common stock paid out on August 31, 2022
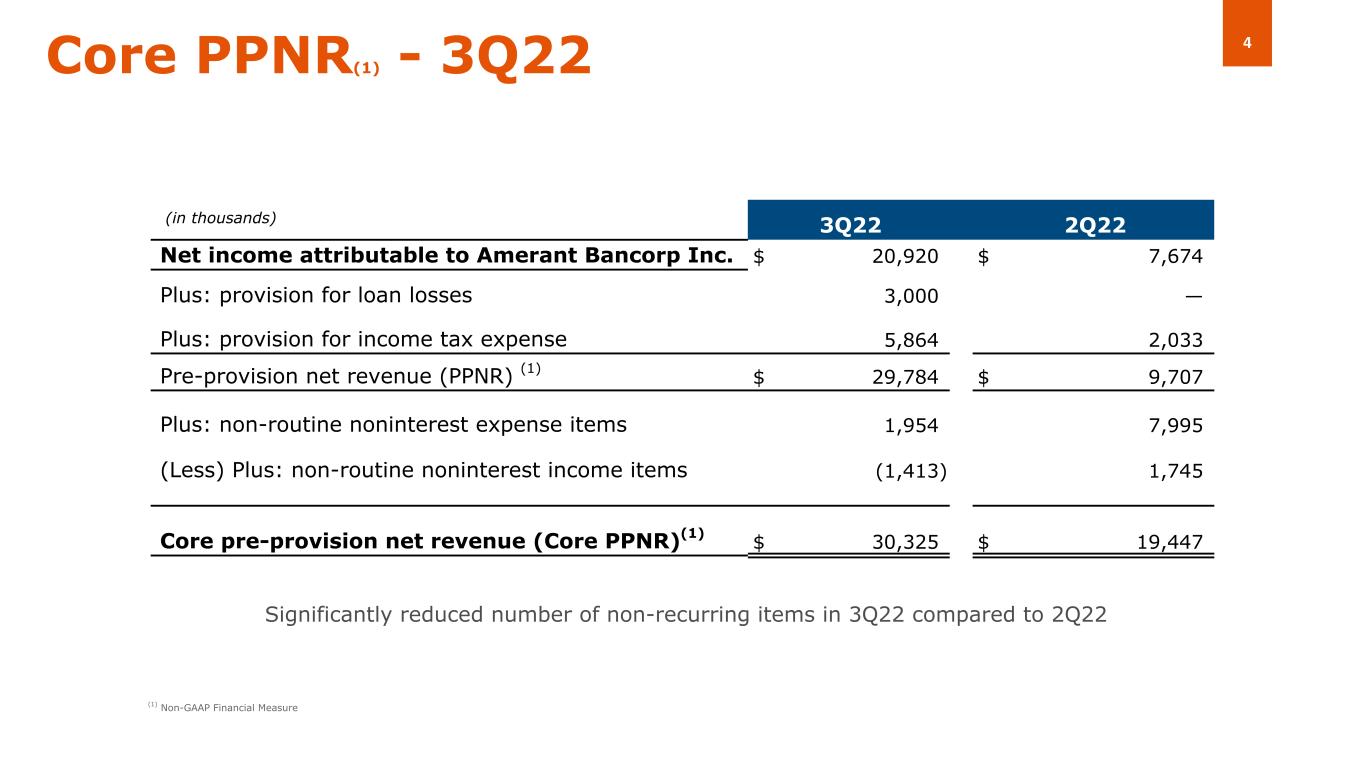
4Core PPNR(1) - 3Q22 (1) Non-GAAP Financial Measure ( 3Q22 2Q22 Net income attributable to Amerant Bancorp Inc. $ 20,920 $ 7,674 Plus: provision for loan losses 3,000 — Plus: provision for income tax expense 5,864 2,033 Pre-provision net revenue (PPNR) (1) $ 29,784 $ 9,707 Plus: non-routine noninterest expense items 1,954 7,995 (Less) Plus: non-routine noninterest income items (1,413) 1,745 Core pre-provision net revenue (Core PPNR)(1) $ 30,325 $ 19,447 (in thousands) Significantly reduced number of non-recurring items in 3Q22 compared to 2Q22
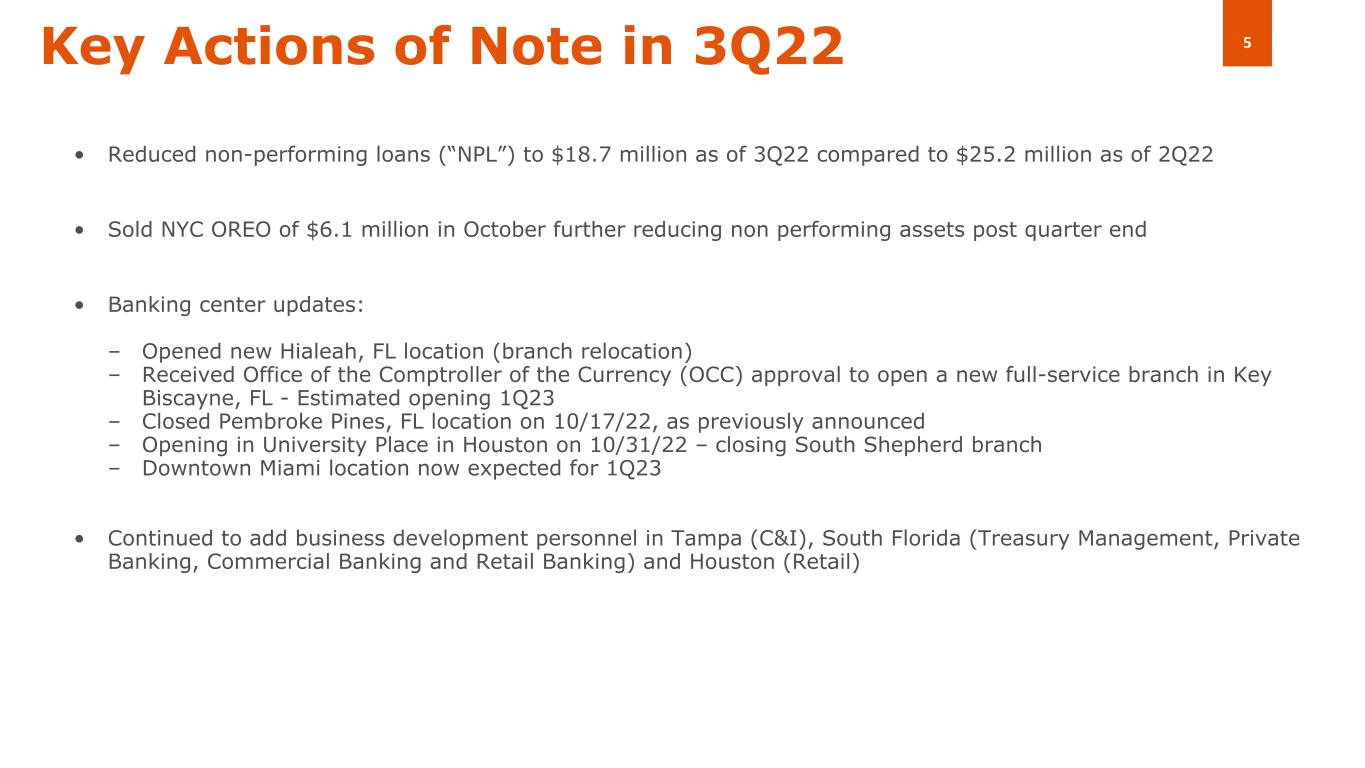
5Key Actions of Note in 3Q22 • Reduced non-performing loans (“NPL”) to $18.7 million as of 3Q22 compared to $25.2 million as of 2Q22 • Sold NYC OREO of $6.1 million in October further reducing non performing assets post quarter end • Banking center updates: – Opened new Hialeah, FL location (branch relocation) – Received Office of the Comptroller of the Currency (OCC) approval to open a new full-service branch in Key Biscayne, FL - Estimated opening 1Q23 – Closed Pembroke Pines, FL location on 10/17/22, as previously announced – Opening in University Place in Houston on 10/31/22 – closing South Shepherd branch – Downtown Miami location now expected for 1Q23 • Continued to add business development personnel in Tampa (C&I), South Florida (Treasury Management, Private Banking, Commercial Banking and Retail Banking) and Houston (Retail)
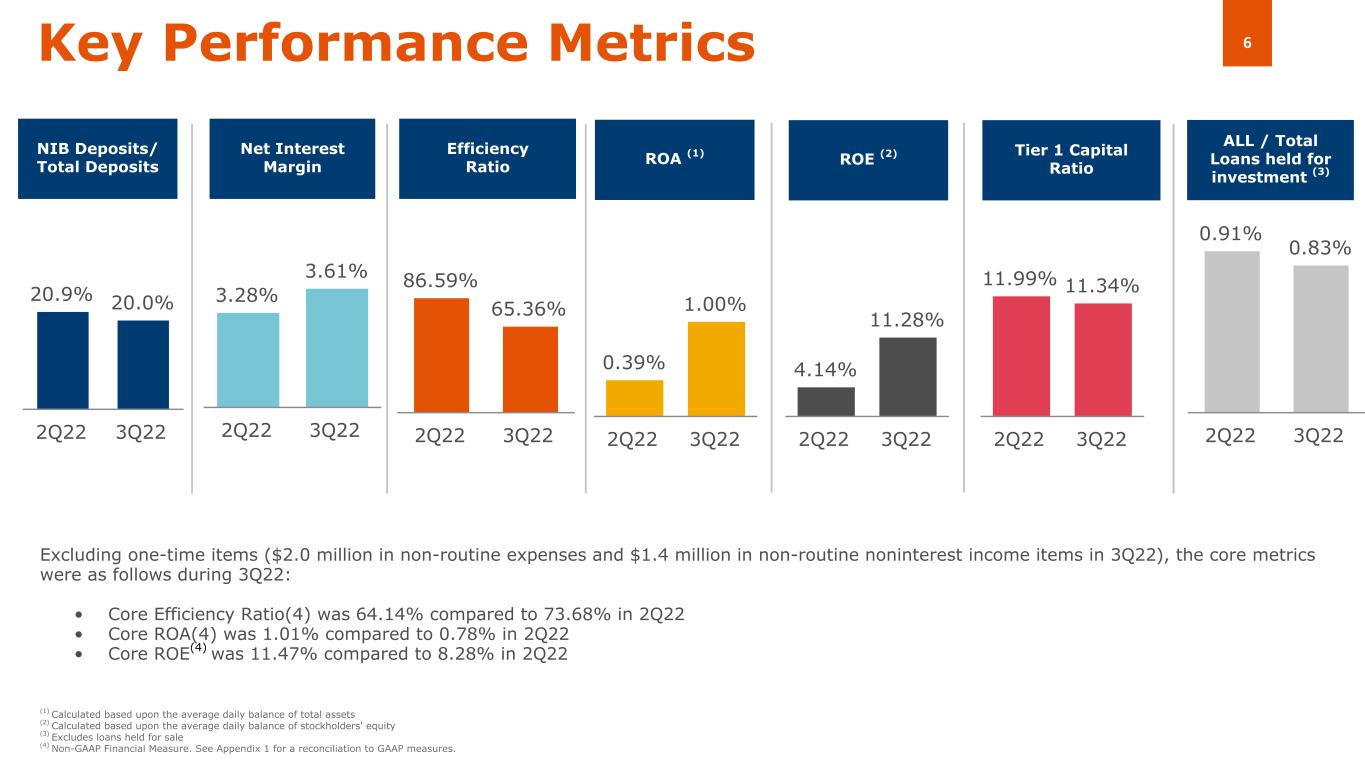
6 86.59% 65.36% 2Q22 3Q22 20.9% 20.0% 2Q22 3Q22 11.99% 11.34% 2Q22 3Q22 3.28% 3.61% 2Q22 3Q22 Key Performance Metrics NIB Deposits/ Total Deposits Tier 1 Capital Ratio Net Interest Margin Efficiency Ratio (1) Calculated based upon the average daily balance of total assets (2) Calculated based upon the average daily balance of stockholders' equity (3) Excludes loans held for sale (4) Non-GAAP Financial Measure. See Appendix 1 for a reconciliation to GAAP measures. 0.91% 0.83% 2Q22 3Q22 ALL / Total Loans held for investment (3) 0.39% 1.00% 2Q22 3Q22 ROA (1) 4.14% 11.28% 2Q22 3Q22 Excluding one-time items ($2.0 million in non-routine expenses and $1.4 million in non-routine noninterest income items in 3Q22), the core metrics were as follows during 3Q22: • Core Efficiency Ratio(4) was 64.14% compared to 73.68% in 2Q22 • Core ROA(4) was 1.01% compared to 0.78% in 2Q22 • Core ROE(4) was 11.47% compared to 8.28% in 2Q22 ROE (2)
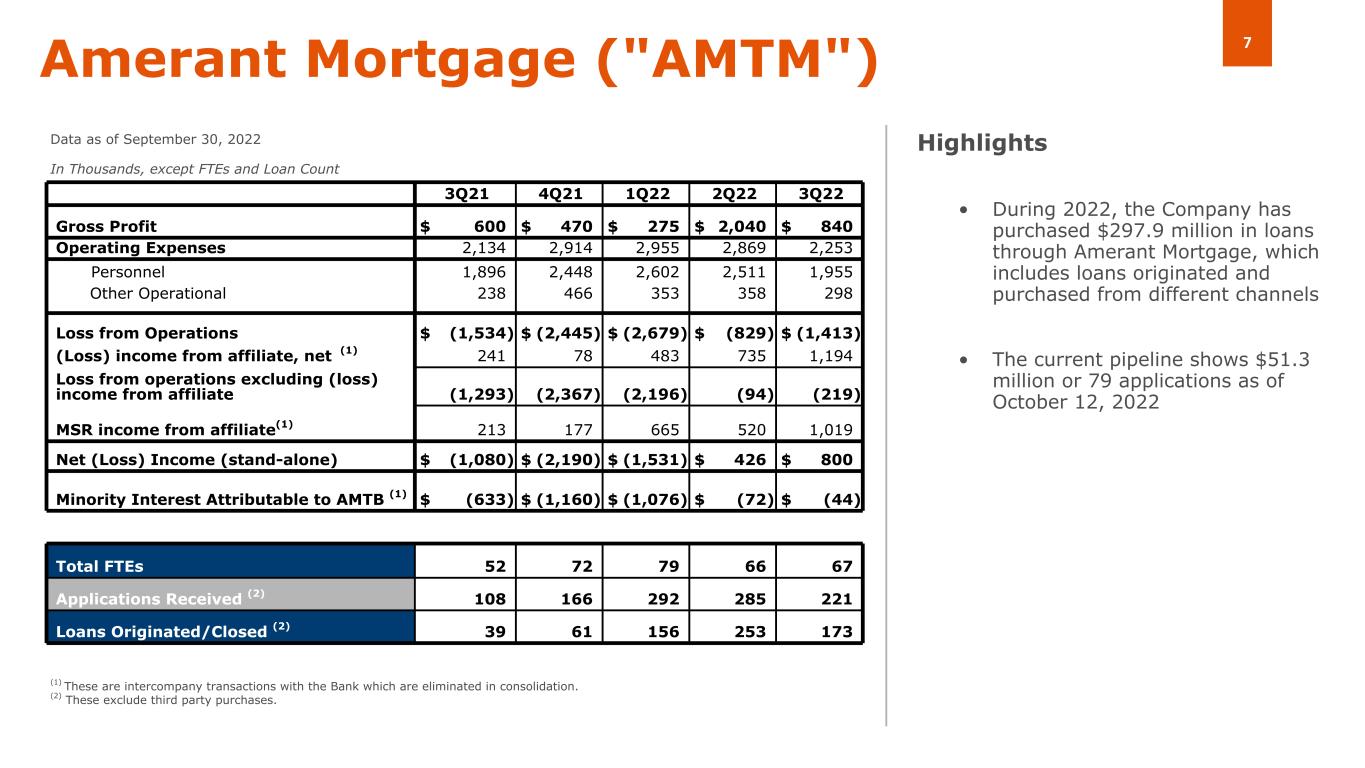
7Amerant Mortgage ("AMTM") • During 2022, the Company has purchased $297.9 million in loans through Amerant Mortgage, which includes loans originated and purchased from different channels • The current pipeline shows $51.3 million or 79 applications as of October 12, 2022 Data as of September 30, 2022 In Thousands, except FTEs and Loan Count Highlights (1) These are intercompany transactions with the Bank which are eliminated in consolidation. (2) These exclude third party purchases. ( 3Q21 4Q21 1Q22 2Q22 3Q22 Gross Profit $ 600 $ 470 $ 275 $ 2,040 $ 840 Operating Expenses 2,134 2,914 2,955 2,869 2,253 Personnel 1,896 2,448 2,602 2,511 1,955 Other Operational 238 466 353 358 298 Loss from Operations $ (1,534) $ (2,445) $ (2,679) $ (829) $ (1,413) (Loss) income from affiliate, net (1) 241 78 483 735 1,194 Loss from operations excluding (loss) income from affiliate (1,293) (2,367) (2,196) (94) (219) MSR income from affiliate(1) 213 177 665 520 1,019 Net (Loss) Income (stand-alone) $ (1,080) $ (2,190) $ (1,531) $ 426 $ 800 Minority Interest Attributable to AMTB (1) $ (633) $ (1,160) $ (1,076) $ (72) $ (44) Total FTEs 52 72 79 66 67 Applications Received (2) 108 166 292 285 221 Loans Originated/Closed (2) 39 61 156 253 173
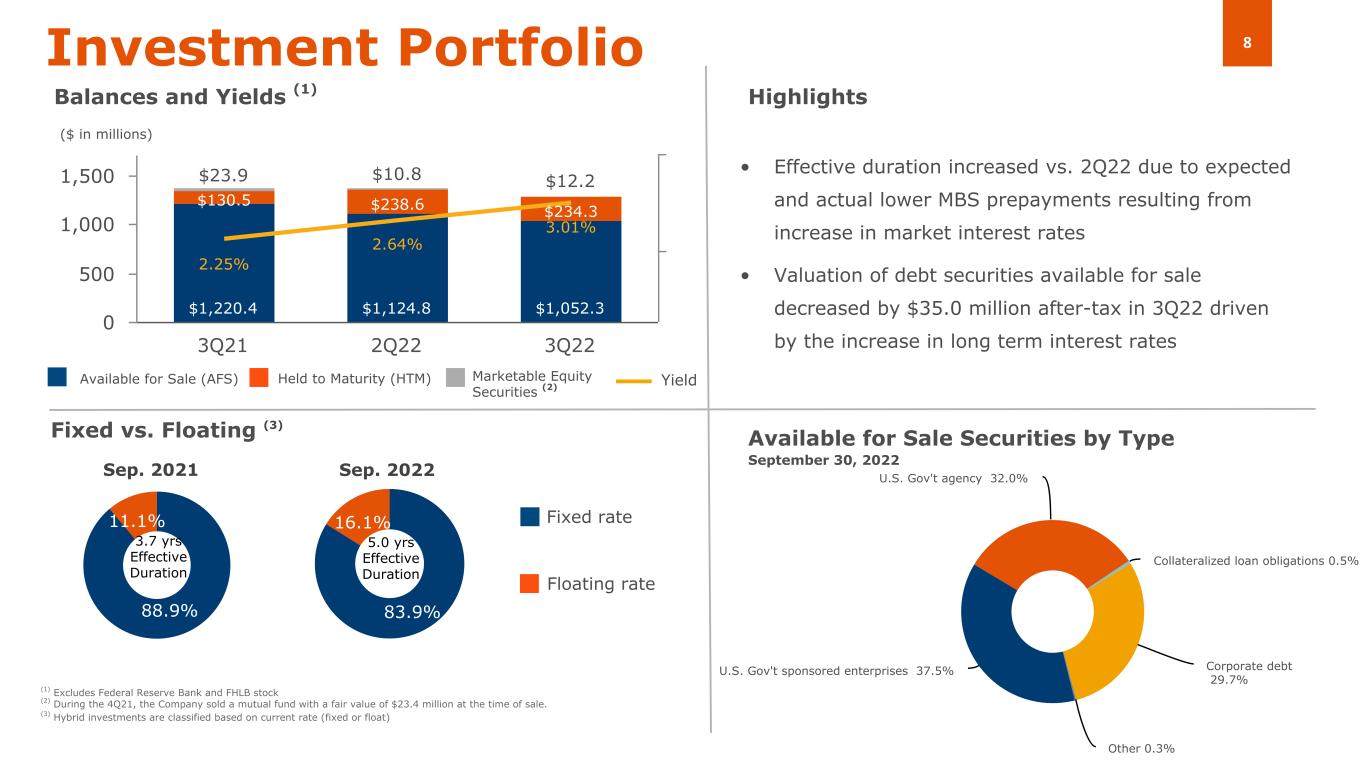
8 83.9% 16.1% U.S. Gov't sponsored enterprises 37.5% U.S. Gov't agency 32.0% Collateralized loan obligations 0.5% Corporate debt 29.7% Other 0.3% $1,220.4 $1,124.8 $1,052.3 $130.5 $238.6 $234.3 $23.9 $10.8 $12.2 2.25% 2.64% 3.01% 3Q21 2Q22 3Q22 0 500 1,000 1,500 88.9% 11.1% • Effective duration increased vs. 2Q22 due to expected and actual lower MBS prepayments resulting from increase in market interest rates • Valuation of debt securities available for sale decreased by $35.0 million after-tax in 3Q22 driven by the increase in long term interest rates Investment Portfolio Balances and Yields (1) Available for Sale (AFS) Held to Maturity (HTM) Highlights Fixed vs. Floating (3) Sep. 2021 Sep. 2022 Floating rate Fixed rate Available for Sale Securities by Type September 30, 2022 3.7 yrs Effective Duration ($ in millions) Marketable Equity Securities (2) (1) Excludes Federal Reserve Bank and FHLB stock (2) During the 4Q21, the Company sold a mutual fund with a fair value of $23.4 million at the time of sale. (3) Hybrid investments are classified based on current rate (fixed or float) Yield 5.0 yrs Effective Duration
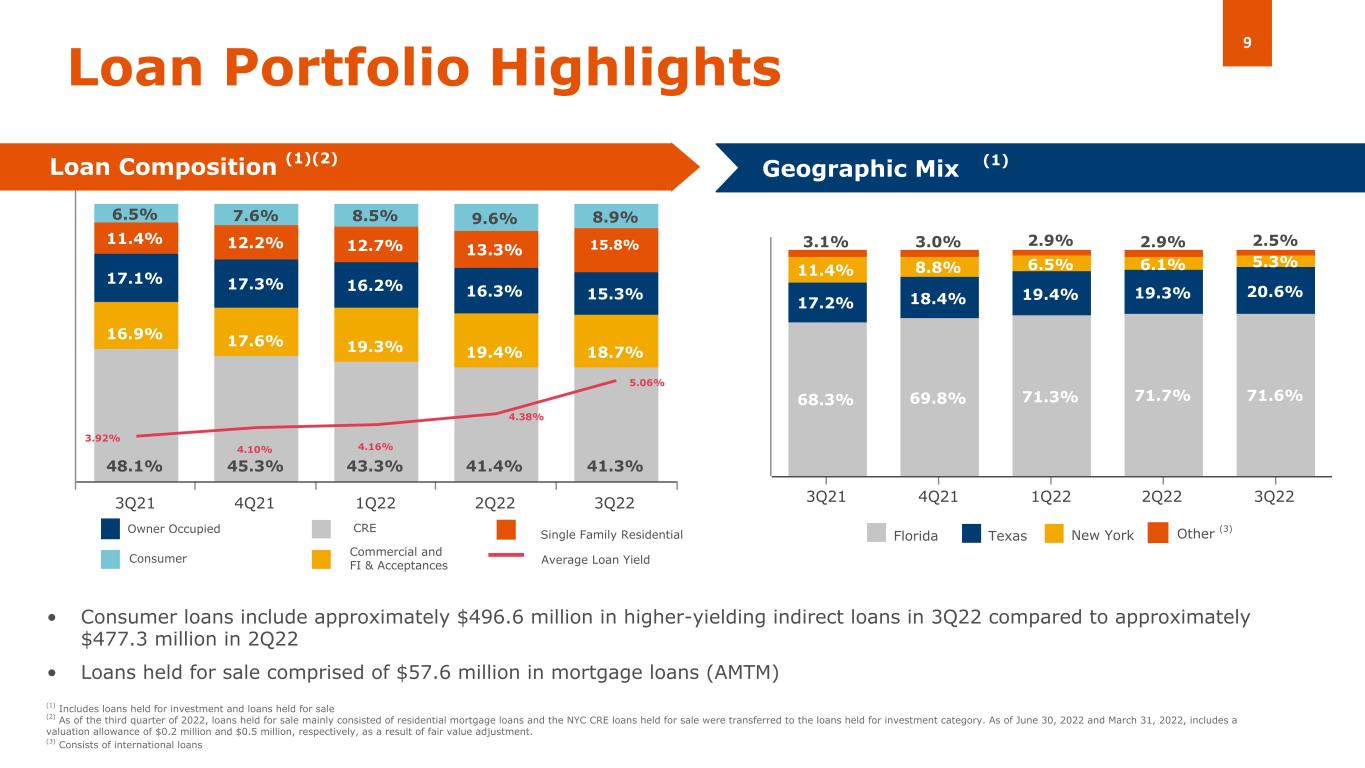
9 48.1% 45.3% 43.3% 41.4% 41.3% 16.9% 17.6% 19.3% 19.4% 18.7% 17.1% 17.3% 16.2% 16.3% 15.3% 11.4% 12.2% 12.7% 13.3% 15.8% 6.5% 7.6% 8.5% 9.6% 8.9% 3.92% 4.10% 4.16% 4.38% 5.06% 3Q21 4Q21 1Q22 2Q22 3Q22 68.3% 69.8% 71.3% 71.7% 71.6% 17.2% 18.4% 19.4% 19.3% 20.6% 11.4% 8.8% 6.5% 6.1% 5.3% 3.1% 3.0% 2.9% 2.9% 2.5% 3Q21 4Q21 1Q22 2Q22 3Q22 Consumer CRE Commercial and FI & Acceptances Owner Occupied Single Family Residential Loan Portfolio Highlights Loan Composition (1)(2) Geographic Mix (Domestic) • Consumer loans include approximately $496.6 million in higher-yielding indirect loans in 3Q22 compared to approximately $477.3 million in 2Q22 • Loans held for sale comprised of $57.6 million in mortgage loans (AMTM) (1) Florida Texas New York Average Loan Yield Other (3) (1) Includes loans held for investment and loans held for sale (2) As of the third quarter of 2022, loans held for sale mainly consisted of residential mortgage loans and the NYC CRE loans held for sale were transferred to the loans held for investment category. As of June 30, 2022 and March 31, 2022, includes a valuation allowance of $0.2 million and $0.5 million, respectively, as a result of fair value adjustment. (3) Consists of international loans
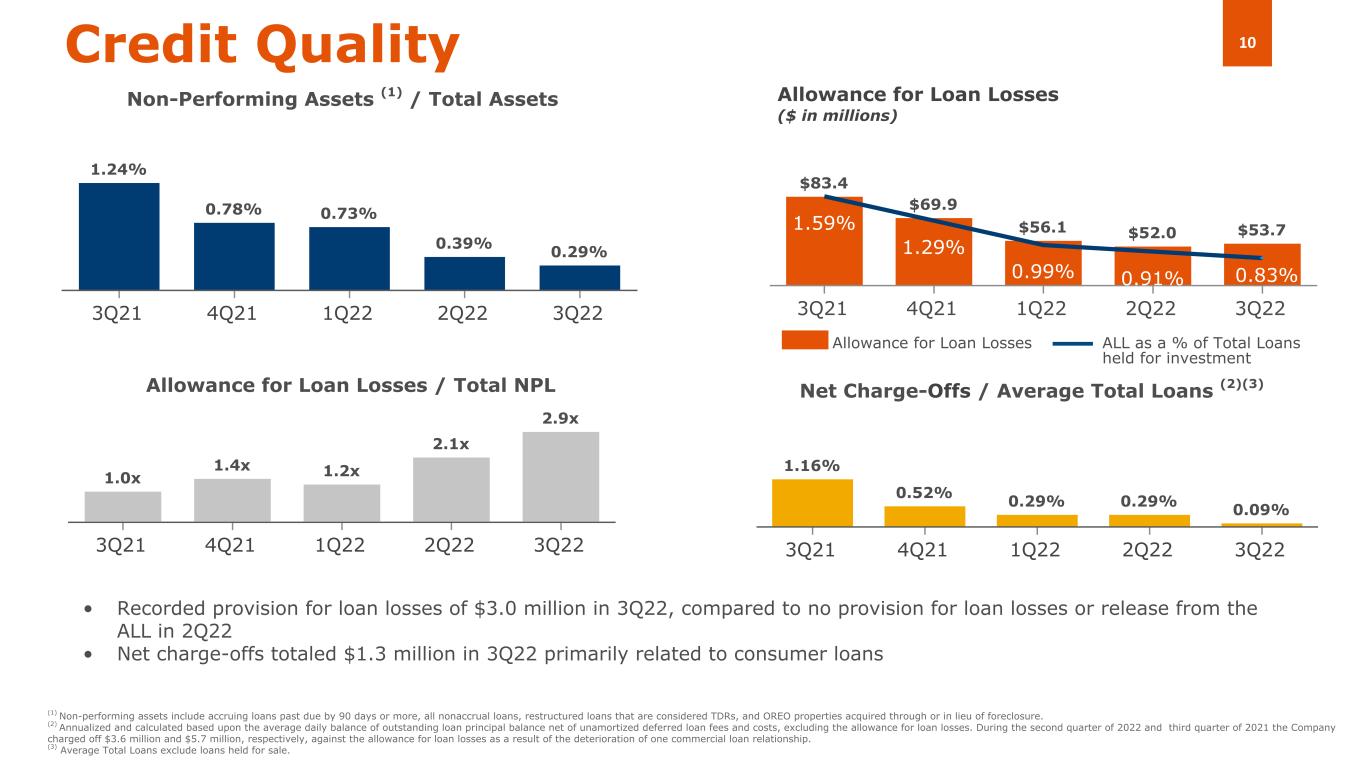
10 $83.4 $69.9 $56.1 $52.0 $53.71.59% 1.29% 0.99% 0.91% 3Q21 4Q21 1Q22 2Q22 3Q22 1.16% 0.52% 0.29% 0.29% 0.09% 3Q21 4Q21 1Q22 2Q22 3Q22 • Recorded provision for loan losses of $3.0 million in 3Q22, compared to no provision for loan losses or release from the ALL in 2Q22 • Net charge-offs totaled $1.3 million in 3Q22 primarily related to consumer loans Net Charge-Offs / Average Total Loans (2)(3) Credit Quality Allowance for Loan Losses ($ in millions) Non-Performing Assets (1) / Total Assets Allowance for Loan Losses / Total NPL Allowance for Loan Losses ALL as a % of Total Loans held for investment (1) Non-performing assets include accruing loans past due by 90 days or more, all nonaccrual loans, restructured loans that are considered TDRs, and OREO properties acquired through or in lieu of foreclosure. (2) Annualized and calculated based upon the average daily balance of outstanding loan principal balance net of unamortized deferred loan fees and costs, excluding the allowance for loan losses. During the second quarter of 2022 and third quarter of 2021 the Company charged off $3.6 million and $5.7 million, respectively, against the allowance for loan losses as a result of the deterioration of one commercial loan relationship. (3) Average Total Loans exclude loans held for sale. 1.24% 0.78% 0.73% 0.39% 0.29% 3Q21 4Q21 1Q22 2Q22 3Q22 1.0x 1.4x 1.2x 2.1x 2.9x 3Q21 4Q21 1Q22 2Q22 3Q22 0.83%
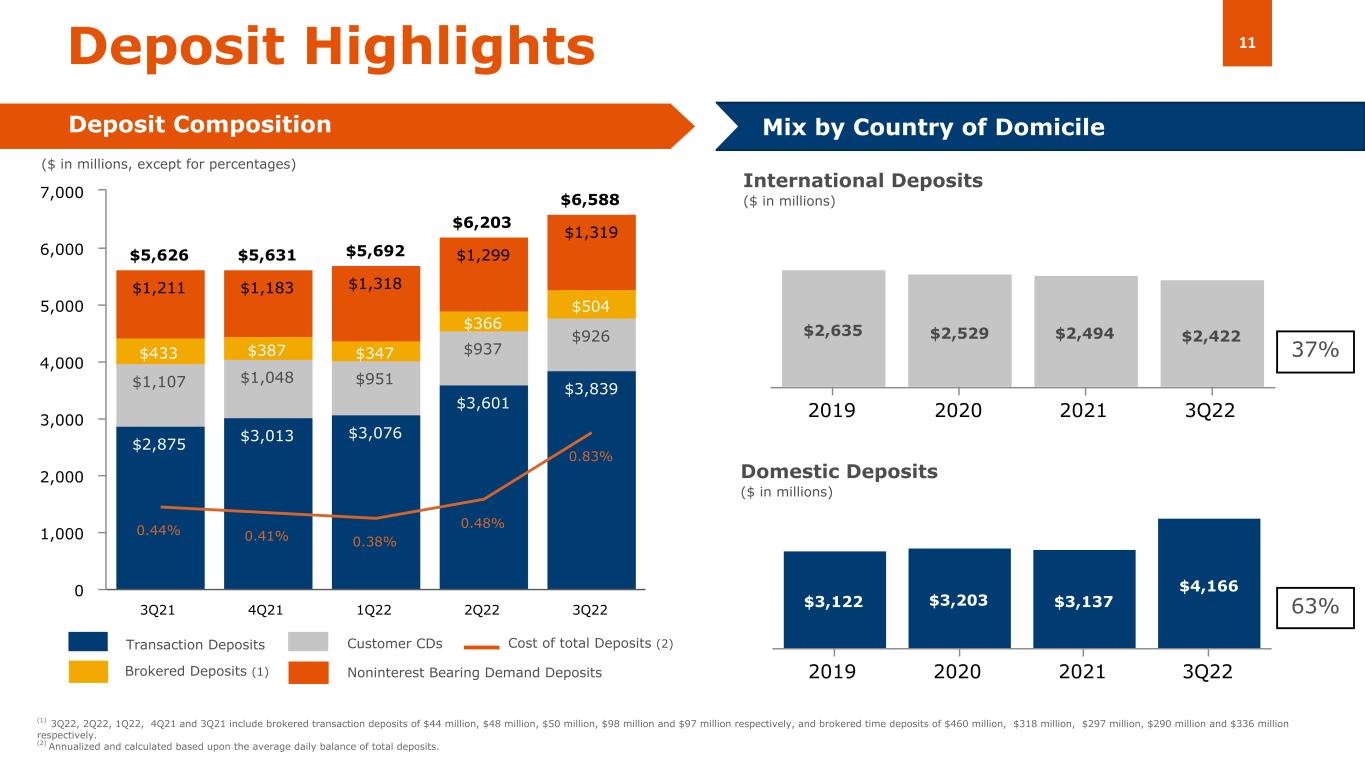
11 $5,626 $5,631 $5,692 $6,203 $6,588 $2,875 $3,013 $3,076 $3,601 $3,839$1,107 $1,048 $951 $937 $926 $433 $387 $347 $366 $504 $1,211 $1,183 $1,318 $1,299 $1,319 0.44% 0.41% 0.38% 0.48% 0.83% 3Q21 4Q21 1Q22 2Q22 3Q22 0 1,000 2,000 3,000 4,000 5,000 6,000 7,000 $2,635 $2,529 $2,494 $2,422 2019 2020 2021 3Q22 $3,122 $3,203 $3,137 $4,166 2019 2020 2021 3Q22 Domestic Deposits ($ in millions) Deposit Highlights Deposit Composition 63% International Deposits ($ in millions) Mix by Country of Domicile Transaction Deposits Customer CDs Brokered Deposits (1) Cost of total Deposits (2) ($ in millions, except for percentages) 37% (1) 3Q22, 2Q22, 1Q22, 4Q21 and 3Q21 include brokered transaction deposits of $44 million, $48 million, $50 million, $98 million and $97 million respectively, and brokered time deposits of $460 million, $318 million, $297 million, $290 million and $336 million respectively. (2) Annualized and calculated based upon the average daily balance of total deposits. Noninterest Bearing Demand Deposits
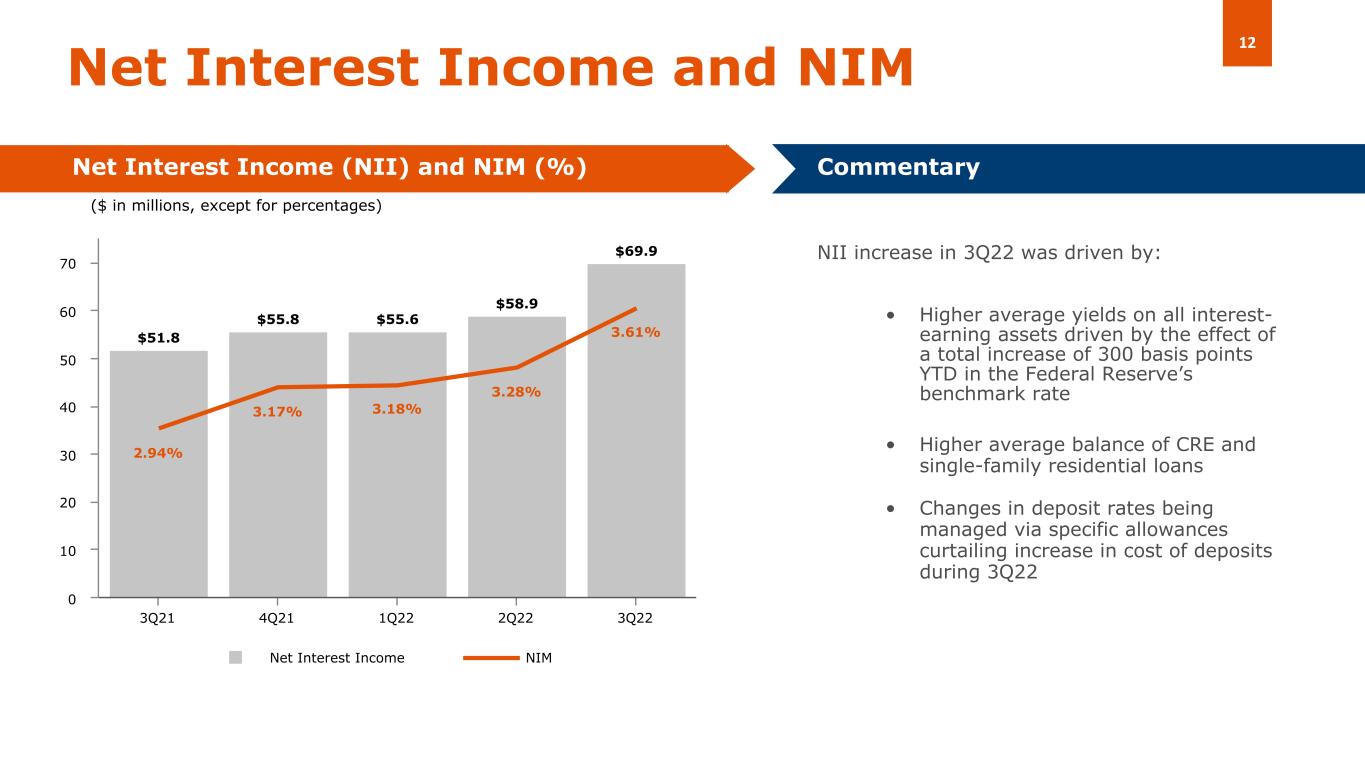
12 $51.8 $55.8 $55.6 $58.9 $69.9 2.94% 3.17% 3.18% 3.28% 3.61% Net Interest Income NIM 3Q21 4Q21 1Q22 2Q22 3Q22 0 10 20 30 40 50 60 70 NII increase in 3Q22 was driven by: • Higher average yields on all interest- earning assets driven by the effect of a total increase of 300 basis points YTD in the Federal Reserve’s benchmark rate • Higher average balance of CRE and single-family residential loans • Changes in deposit rates being managed via specific allowances curtailing increase in cost of deposits during 3Q22 Net Interest Income and NIM Net Interest Income (NII) and NIM (%) Commentary ($ in millions, except for percentages)
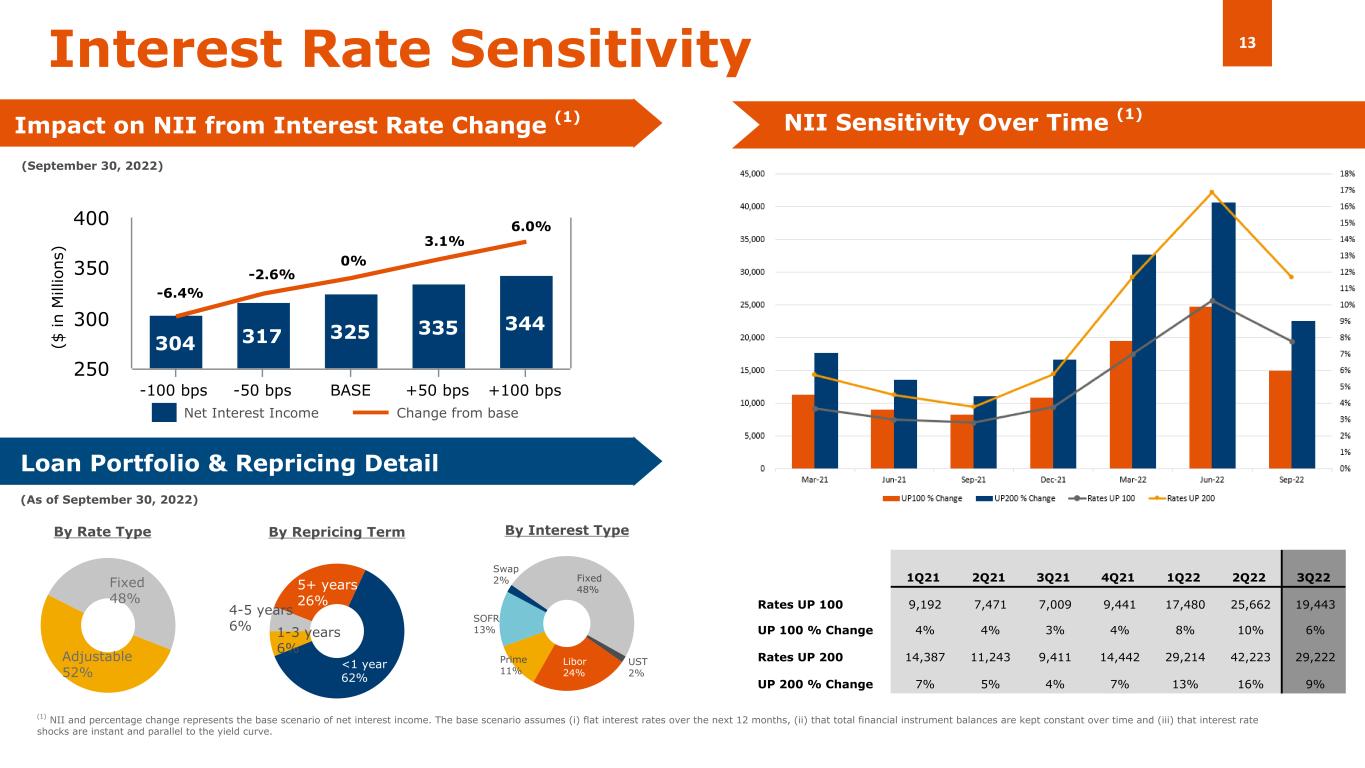
13 304 317 325 335 344 -100 bps -50 bps BASE +50 bps +100 bps 250 300 350 400 (September 30, 2022) Fixed 48% Adjustable 52% Interest Rate Sensitivity By Interest TypeBy Rate Type By Repricing Term (1) NII and percentage change represents the base scenario of net interest income. The base scenario assumes (i) flat interest rates over the next 12 months, (ii) that total financial instrument balances are kept constant over time and (iii) that interest rate shocks are instant and parallel to the yield curve. Loan Portfolio & Repricing Detail Impact on NII from Interest Rate Change (1) Net Interest Income Change from base <1 year 62% 1-3 years 6% 4-5 years 6% 5+ years 26% ($ in M ill io ns ) (As of September 30, 2022) Swap 2% Fixed 48% UST 2% Libor 24% Prime 11% SOFR 13% NII Sensitivity Over Time (1) -6.4% -2.6% 0% 6.0% 3.1% 1Q21 2Q21 3Q21 4Q21 1Q22 2Q22 3Q22 Rates UP 100 9,192 7,471 7,009 9,441 17,480 25,662 19,443 UP 100 % Change 4% 4% 3% 4% 8% 10% 6% Rates UP 200 14,387 11,243 9,411 14,442 29,214 42,223 29,222 UP 200 % Change 7% 5% 4% 7% 13% 16% 9%
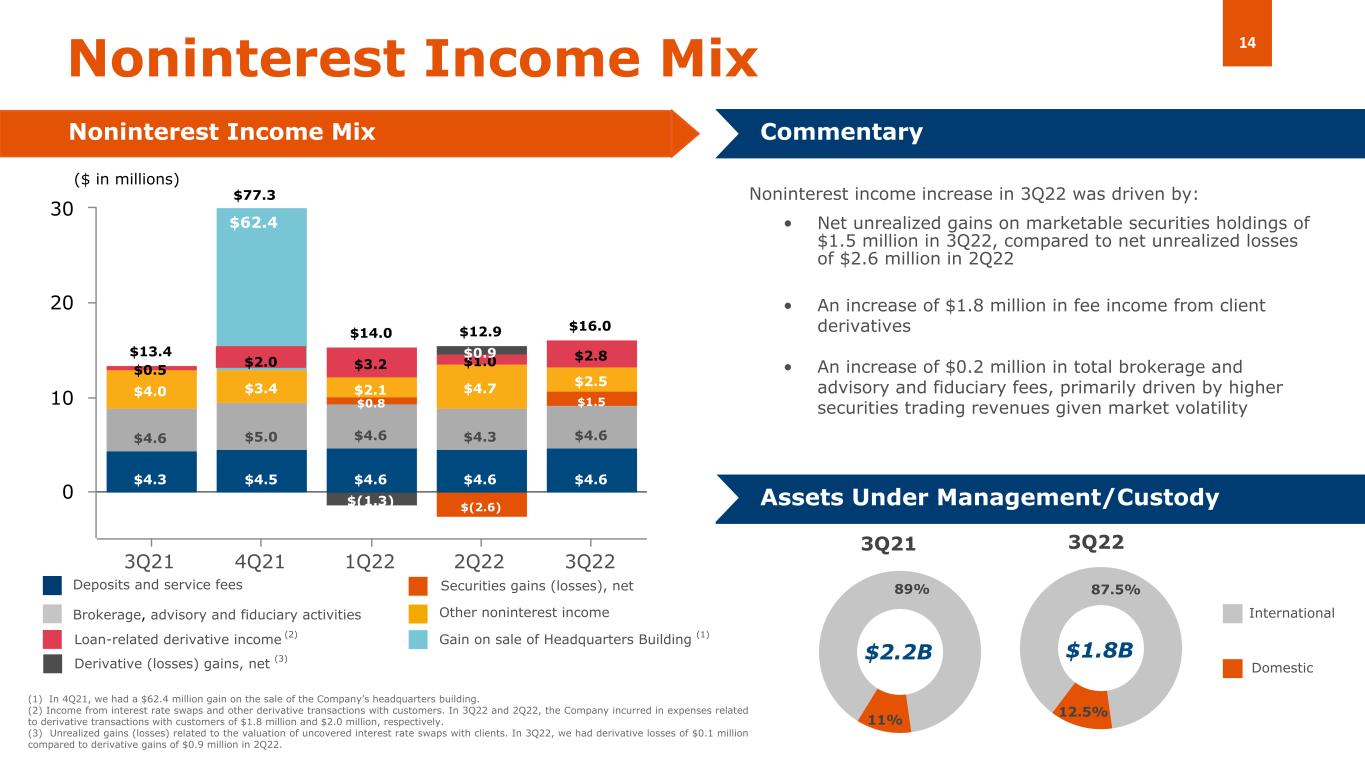
14 $14.0 $16.0 $13.4 $12.9 $4.3 $4.5 $4.6 $4.6 $4.6 $4.6 $5.0 $4.6 $4.3 $4.6 $0.8 $(2.6) $1.5 $4.0 $3.4 $2.1 $4.7 $2.5 $0.5 $3.2 $1.0 $2.8 $(1.3) $0.9 3Q21 4Q21 1Q22 2Q22 3Q22 0 10 20 30 11% 89% 12.5% 87.5% Noninterest Income Mix Noninterest Income Mix Commentary Noninterest income increase in 3Q22 was driven by: • Net unrealized gains on marketable securities holdings of $1.5 million in 3Q22, compared to net unrealized losses of $2.6 million in 2Q22 • An increase of $1.8 million in fee income from client derivatives • An increase of $0.2 million in total brokerage and advisory and fiduciary fees, primarily driven by higher securities trading revenues given market volatility Assets Under Management/Custody Deposits and service fees Brokerage, advisory and fiduciary activities Other noninterest income $1.8B Domestic International 3Q223Q21 $2.2B ($ in millions) Securities gains (losses), net (1) In 4Q21, we had a $62.4 million gain on the sale of the Company’s headquarters building. (2) Income from interest rate swaps and other derivative transactions with customers. In 3Q22 and 2Q22, the Company incurred in expenses related to derivative transactions with customers of $1.8 million and $2.0 million, respectively. (3) Unrealized gains (losses) related to the valuation of uncovered interest rate swaps with clients. In 3Q22, we had derivative losses of $0.1 million compared to derivative gains of $0.9 million in 2Q22. Gain on sale of Headquarters Building (1)Loan-related derivative income (2) Derivative (losses) gains, net (3) $77.3 $2.0 $62.4
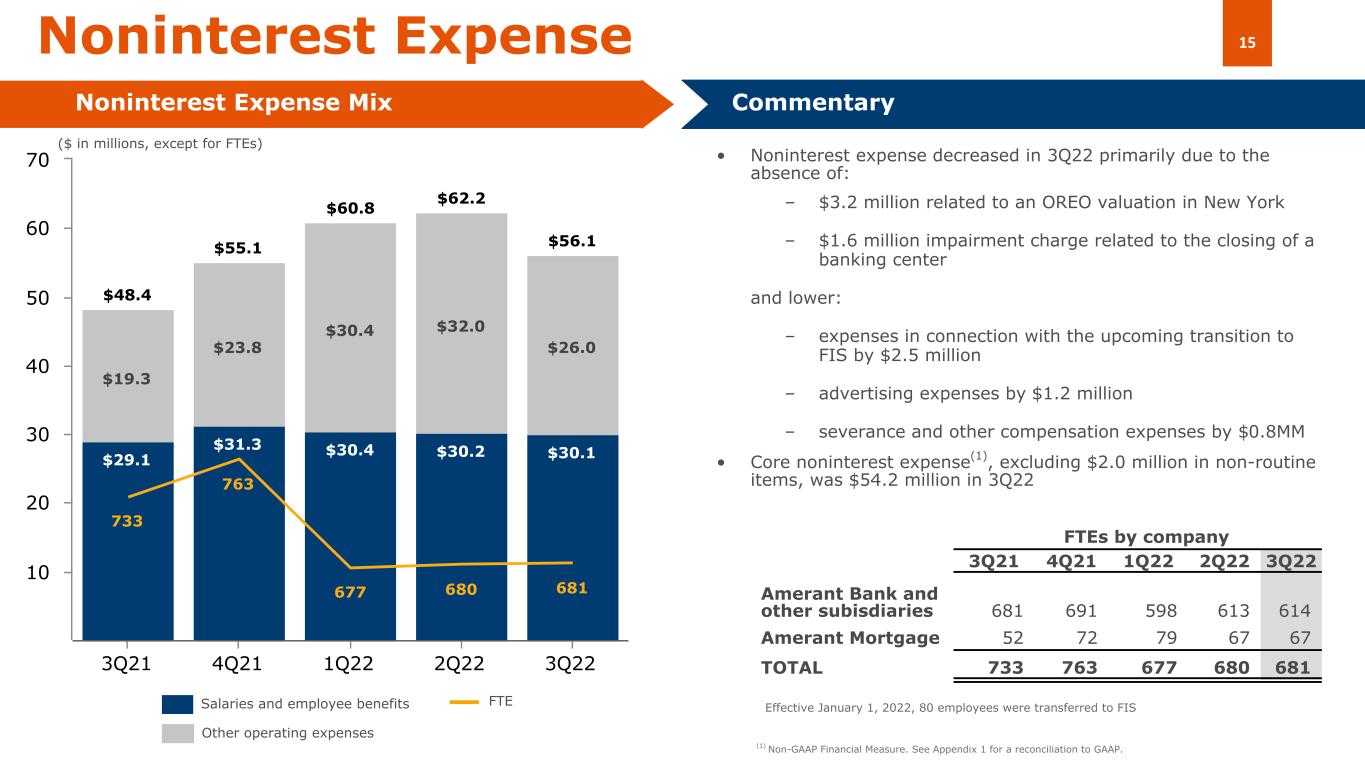
15 • Noninterest expense decreased in 3Q22 primarily due to the absence of: – $3.2 million related to an OREO valuation in New York – $1.6 million impairment charge related to the closing of a banking center and lower: – expenses in connection with the upcoming transition to FIS by $2.5 million – advertising expenses by $1.2 million – severance and other compensation expenses by $0.8MM • Core noninterest expense(1), excluding $2.0 million in non-routine items, was $54.2 million in 3Q22 $48.4 $55.1 $60.8 $62.2 $56.1 $29.1 $31.3 $30.4 $30.2 $30.1 $19.3 $23.8 $30.4 $32.0 $26.0 733 763 677 680 681 3Q21 4Q21 1Q22 2Q22 3Q22 10 20 30 40 50 60 70 Noninterest Expense Noninterest Expense Mix Commentary Other operating expenses Salaries and employee benefits FTE ($ in millions, except for FTEs) FTEs by company 3Q21 4Q21 1Q22 2Q22 3Q22 Amerant Bank and other subisdiaries 681 691 598 613 614 Amerant Mortgage 52 72 79 67 67 TOTAL 733 763 677 680 681 Effective January 1, 2022, 80 employees were transferred to FIS (1) Non-GAAP Financial Measure. See Appendix 1 for a reconciliation to GAAP.

Closing Remarks
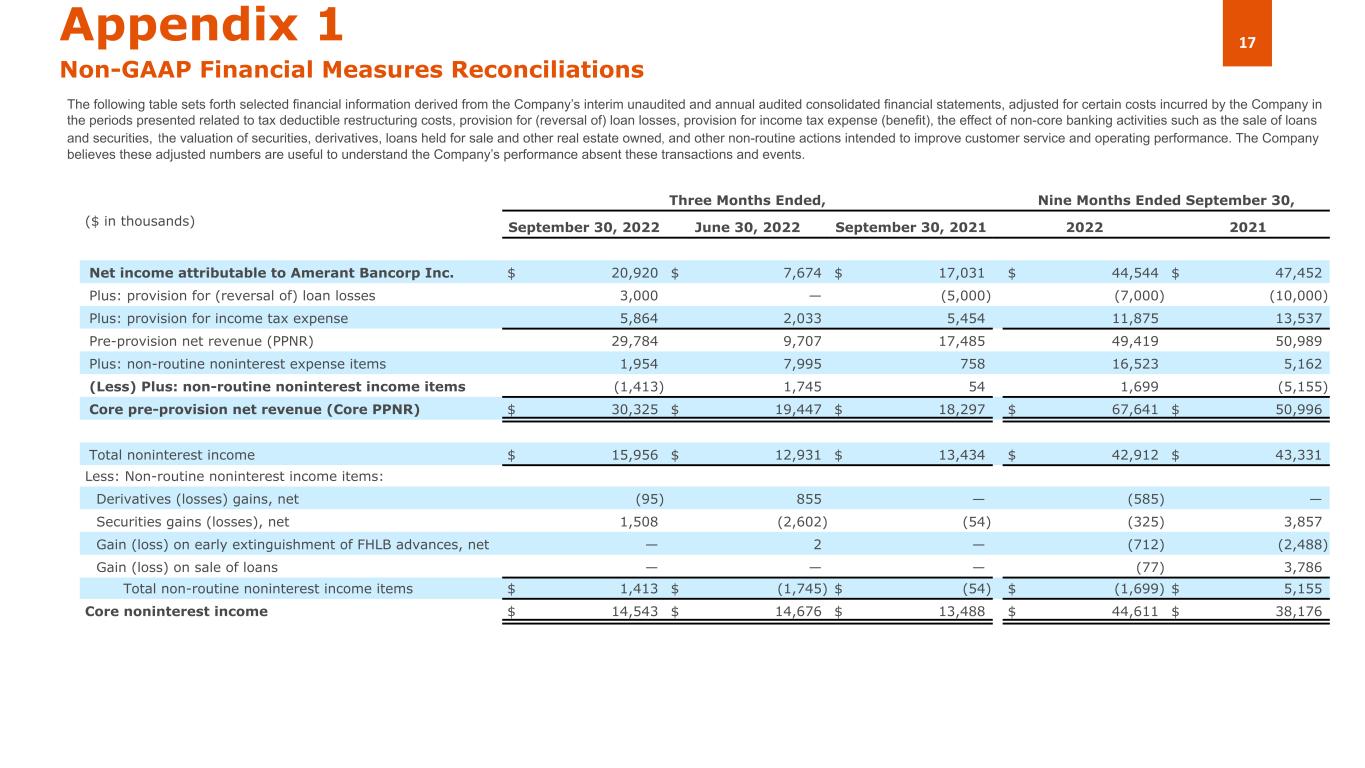
17Appendix 1 Non-GAAP Financial Measures Reconciliations The following table sets forth selected financial information derived from the Company’s interim unaudited and annual audited consolidated financial statements, adjusted for certain costs incurred by the Company in the periods presented related to tax deductible restructuring costs, provision for (reversal of) loan losses, provision for income tax expense (benefit), the effect of non-core banking activities such as the sale of loans and securities, the valuation of securities, derivatives, loans held for sale and other real estate owned, and other non-routine actions intended to improve customer service and operating performance. The Company believes these adjusted numbers are useful to understand the Company’s performance absent these transactions and events. Three Months Ended, Nine Months Ended September 30, ($ in thousands) September 30, 2022 June 30, 2022 September 30, 2021 2022 2021 Net income attributable to Amerant Bancorp Inc. $ 20,920 $ 7,674 $ 17,031 $ 44,544 $ 47,452 Plus: provision for (reversal of) loan losses 3,000 — (5,000) (7,000) (10,000) Plus: provision for income tax expense 5,864 2,033 5,454 11,875 13,537 Pre-provision net revenue (PPNR) 29,784 9,707 17,485 49,419 50,989 Plus: non-routine noninterest expense items 1,954 7,995 758 16,523 5,162 (Less) Plus: non-routine noninterest income items (1,413) 1,745 54 1,699 (5,155) Core pre-provision net revenue (Core PPNR) $ 30,325 $ 19,447 $ 18,297 $ 67,641 $ 50,996 Total noninterest income $ 15,956 $ 12,931 $ 13,434 $ 42,912 $ 43,331 Less: Non-routine noninterest income items: Derivatives (losses) gains, net (95) 855 — (585) — Securities gains (losses), net 1,508 (2,602) (54) (325) 3,857 Gain (loss) on early extinguishment of FHLB advances, net — 2 — (712) (2,488) Gain (loss) on sale of loans — — — (77) 3,786 Total non-routine noninterest income items $ 1,413 $ (1,745) $ (54) $ (1,699) $ 5,155 Core noninterest income $ 14,543 $ 14,676 $ 13,488 $ 44,611 $ 38,176
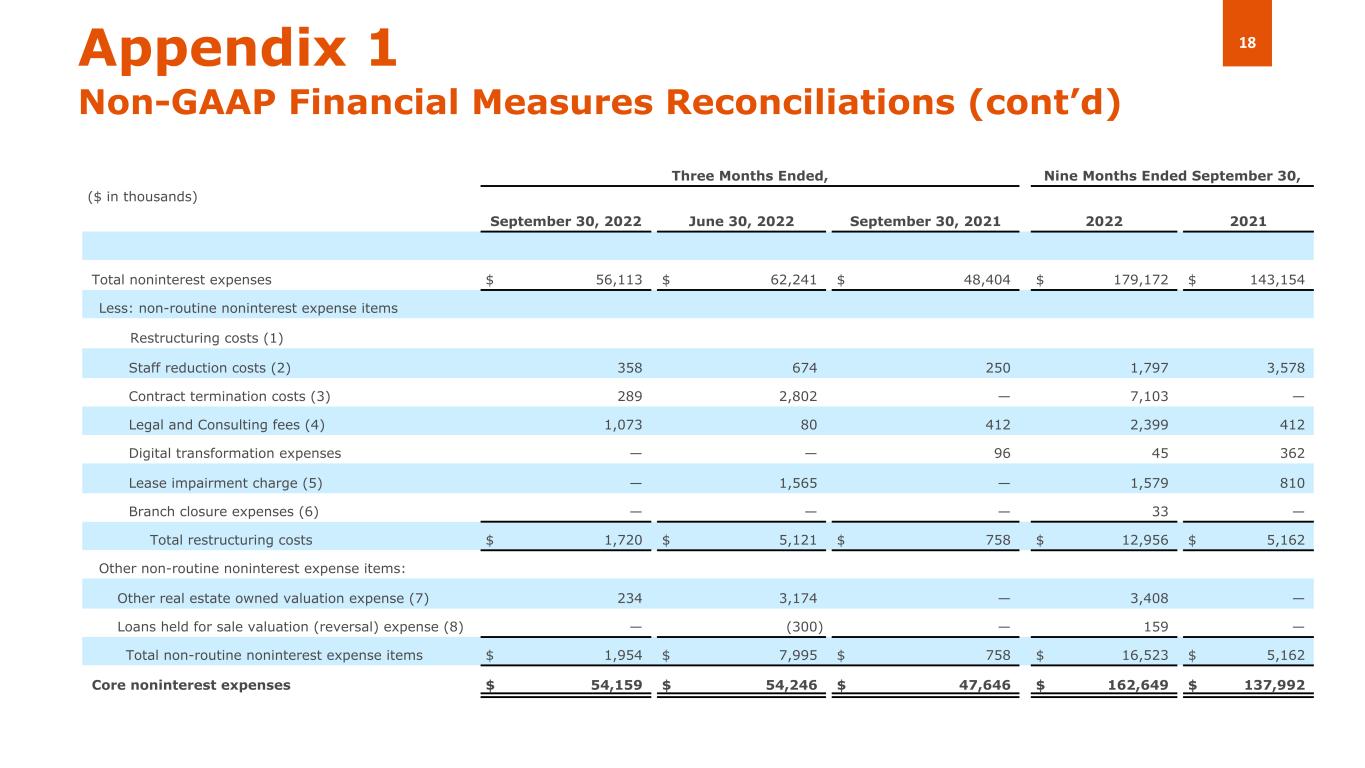
18 Three Months Ended, Nine Months Ended September 30, ($ in thousands) September 30, 2022 June 30, 2022 September 30, 2021 2022 2021 Total noninterest expenses $ 56,113 $ 62,241 $ 48,404 $ 179,172 $ 143,154 Less: non-routine noninterest expense items Restructuring costs (1) Staff reduction costs (2) 358 674 250 1,797 3,578 Contract termination costs (3) 289 2,802 — 7,103 — Legal and Consulting fees (4) 1,073 80 412 2,399 412 Digital transformation expenses — — 96 45 362 Lease impairment charge (5) — 1,565 — 1,579 810 Branch closure expenses (6) — — — 33 — Total restructuring costs $ 1,720 $ 5,121 $ 758 $ 12,956 $ 5,162 Other non-routine noninterest expense items: Other real estate owned valuation expense (7) 234 3,174 — 3,408 — Loans held for sale valuation (reversal) expense (8) — (300) — 159 — Total non-routine noninterest expense items $ 1,954 $ 7,995 $ 758 $ 16,523 $ 5,162 Core noninterest expenses $ 54,159 $ 54,246 $ 47,646 $ 162,649 $ 137,992 Appendix 1 Non-GAAP Financial Measures Reconciliations (cont’d)
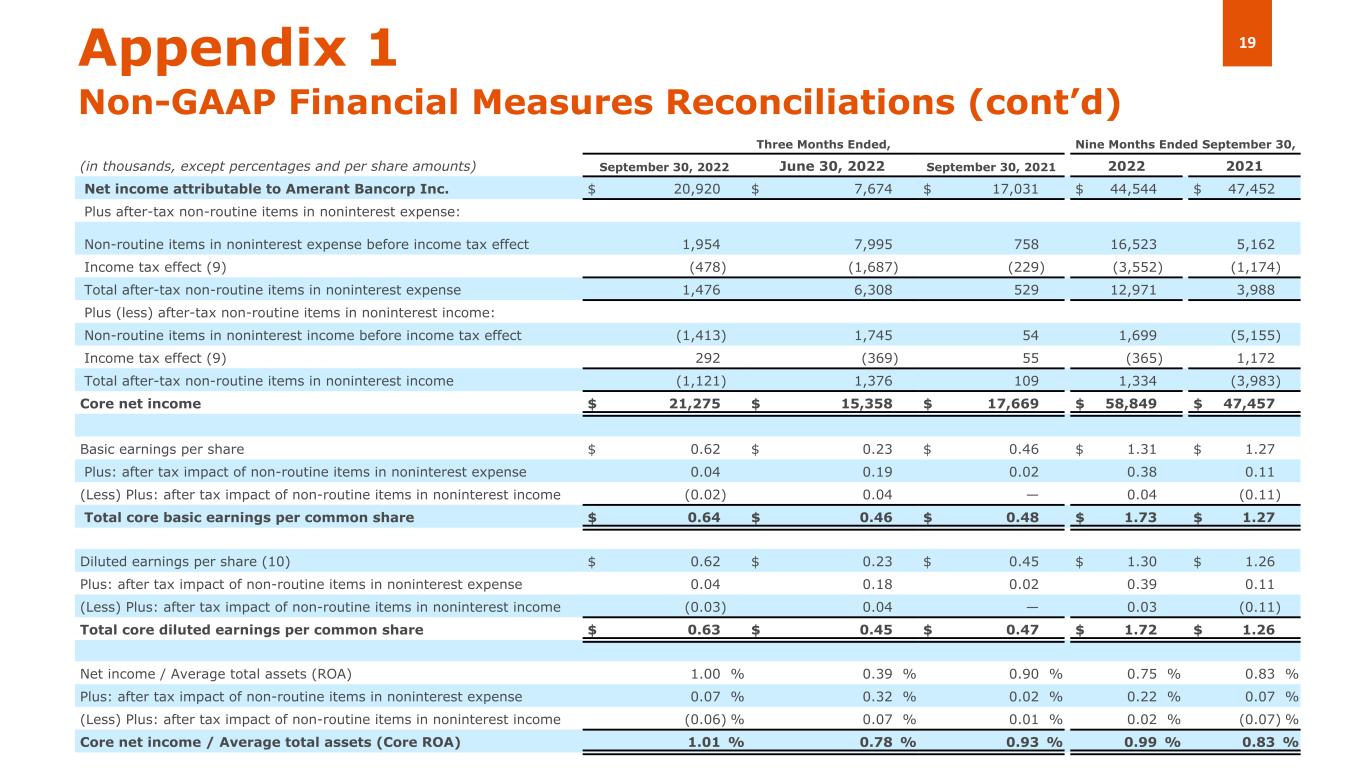
19Appendix 1 Non-GAAP Financial Measures Reconciliations (cont’d) Three Months Ended, Nine Months Ended September 30, (in thousands, except percentages and per share amounts) September 30, 2022 June 30, 2022 September 30, 2021 2022 2021 Net income attributable to Amerant Bancorp Inc. $ 20,920 $ 7,674 $ 17,031 $ 44,544 $ 47,452 Plus after-tax non-routine items in noninterest expense: Non-routine items in noninterest expense before income tax effect 1,954 7,995 758 16,523 5,162 Income tax effect (9) (478) (1,687) (229) (3,552) (1,174) Total after-tax non-routine items in noninterest expense 1,476 6,308 529 12,971 3,988 Plus (less) after-tax non-routine items in noninterest income: Non-routine items in noninterest income before income tax effect (1,413) 1,745 54 1,699 (5,155) Income tax effect (9) 292 (369) 55 (365) 1,172 Total after-tax non-routine items in noninterest income (1,121) 1,376 109 1,334 (3,983) Core net income $ 21,275 $ 15,358 $ 17,669 $ 58,849 $ 47,457 Basic earnings per share $ 0.62 $ 0.23 $ 0.46 $ 1.31 $ 1.27 Plus: after tax impact of non-routine items in noninterest expense 0.04 0.19 0.02 0.38 0.11 (Less) Plus: after tax impact of non-routine items in noninterest income (0.02) 0.04 — 0.04 (0.11) Total core basic earnings per common share $ 0.64 $ 0.46 $ 0.48 $ 1.73 $ 1.27 Diluted earnings per share (10) $ 0.62 $ 0.23 $ 0.45 $ 1.30 $ 1.26 Plus: after tax impact of non-routine items in noninterest expense 0.04 0.18 0.02 0.39 0.11 (Less) Plus: after tax impact of non-routine items in noninterest income (0.03) 0.04 — 0.03 (0.11) Total core diluted earnings per common share $ 0.63 $ 0.45 $ 0.47 $ 1.72 $ 1.26 Net income / Average total assets (ROA) 1.00 % 0.39 % 0.90 % 0.75 % 0.83 % Plus: after tax impact of non-routine items in noninterest expense 0.07 % 0.32 % 0.02 % 0.22 % 0.07 % (Less) Plus: after tax impact of non-routine items in noninterest income (0.06) % 0.07 % 0.01 % 0.02 % (0.07) % Core net income / Average total assets (Core ROA) 1.01 % 0.78 % 0.93 % 0.99 % 0.83 %
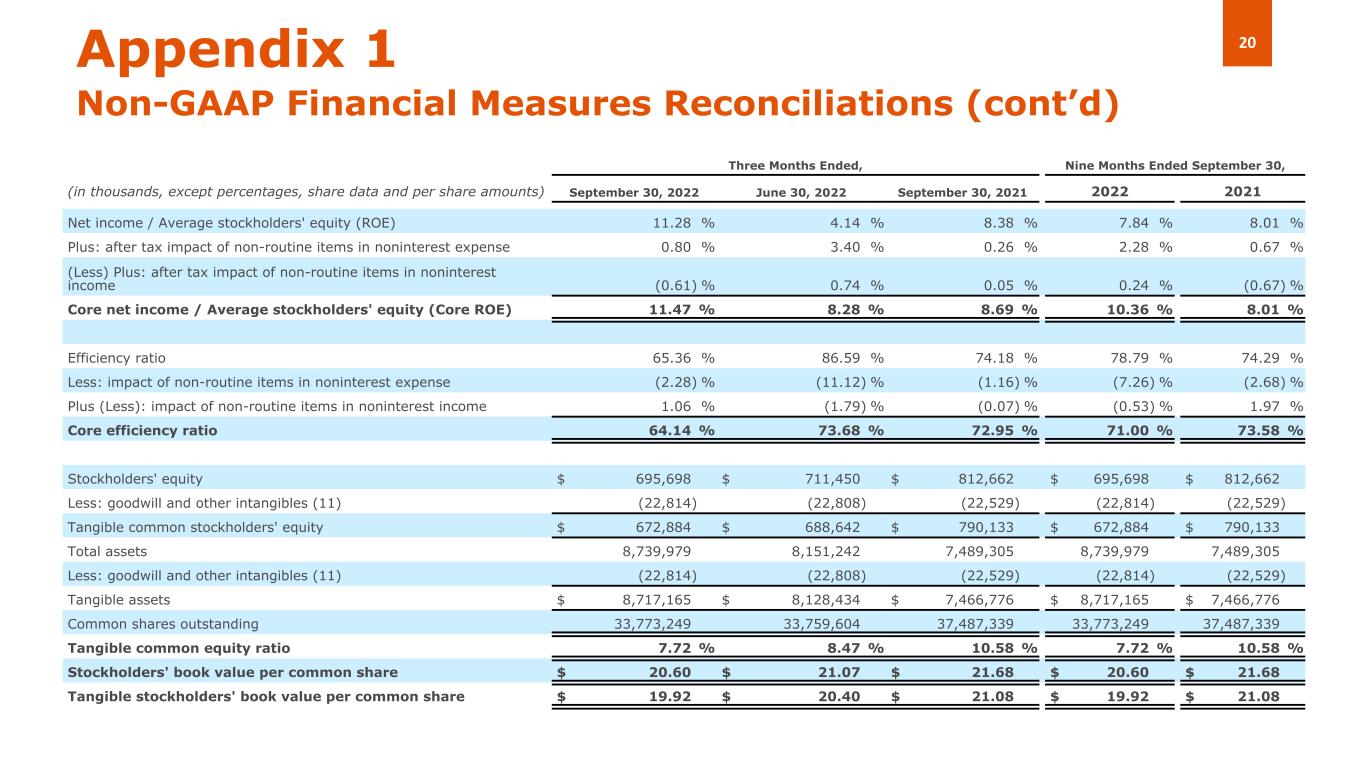
20Appendix 1 Non-GAAP Financial Measures Reconciliations (cont’d) Three Months Ended, Nine Months Ended September 30, (in thousands, except percentages, share data and per share amounts) September 30, 2022 June 30, 2022 September 30, 2021 2022 2021 Net income / Average stockholders' equity (ROE) 11.28 % 4.14 % 8.38 % 7.84 % 8.01 % Plus: after tax impact of non-routine items in noninterest expense 0.80 % 3.40 % 0.26 % 2.28 % 0.67 % (Less) Plus: after tax impact of non-routine items in noninterest income (0.61) % 0.74 % 0.05 % 0.24 % (0.67) % Core net income / Average stockholders' equity (Core ROE) 11.47 % 8.28 % 8.69 % 10.36 % 8.01 % Efficiency ratio 65.36 % 86.59 % 74.18 % 78.79 % 74.29 % Less: impact of non-routine items in noninterest expense (2.28) % (11.12) % (1.16) % (7.26) % (2.68) % Plus (Less): impact of non-routine items in noninterest income 1.06 % (1.79) % (0.07) % (0.53) % 1.97 % Core efficiency ratio 64.14 % 73.68 % 72.95 % 71.00 % 73.58 % Stockholders' equity $ 695,698 $ 711,450 $ 812,662 $ 695,698 $ 812,662 Less: goodwill and other intangibles (11) (22,814) (22,808) (22,529) (22,814) (22,529) Tangible common stockholders' equity $ 672,884 $ 688,642 $ 790,133 $ 672,884 $ 790,133 Total assets 8,739,979 8,151,242 7,489,305 8,739,979 7,489,305 Less: goodwill and other intangibles (11) (22,814) (22,808) (22,529) (22,814) (22,529) Tangible assets $ 8,717,165 $ 8,128,434 $ 7,466,776 $ 8,717,165 $ 7,466,776 Common shares outstanding 33,773,249 33,759,604 37,487,339 33,773,249 37,487,339 Tangible common equity ratio 7.72 % 8.47 % 10.58 % 7.72 % 10.58 % Stockholders' book value per common share $ 20.60 $ 21.07 $ 21.68 $ 20.60 $ 21.68 Tangible stockholders' book value per common share $ 19.92 $ 20.40 $ 21.08 $ 19.92 $ 21.08
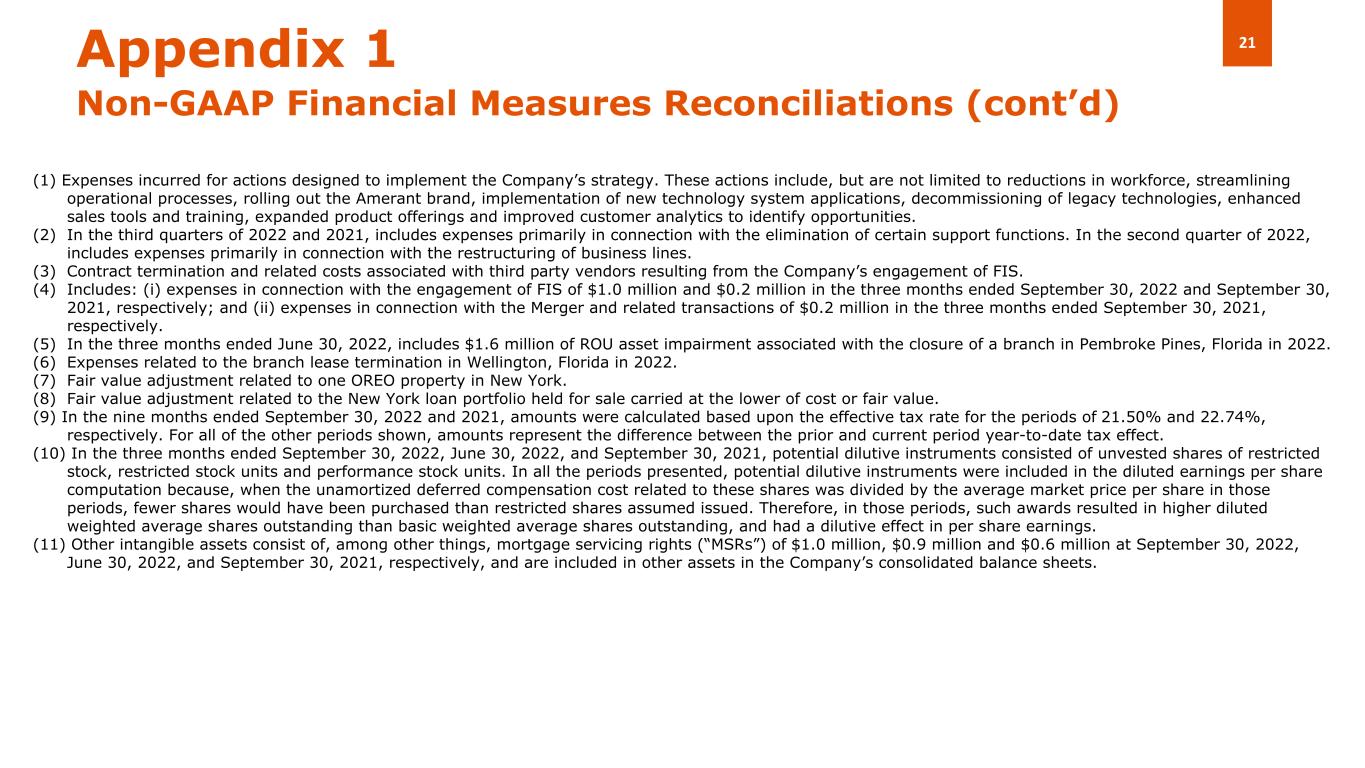
21Appendix 1 Non-GAAP Financial Measures Reconciliations (cont’d) (1) Expenses incurred for actions designed to implement the Company’s strategy. These actions include, but are not limited to reductions in workforce, streamlining operational processes, rolling out the Amerant brand, implementation of new technology system applications, decommissioning of legacy technologies, enhanced sales tools and training, expanded product offerings and improved customer analytics to identify opportunities. (2) In the third quarters of 2022 and 2021, includes expenses primarily in connection with the elimination of certain support functions. In the second quarter of 2022, includes expenses primarily in connection with the restructuring of business lines. (3) Contract termination and related costs associated with third party vendors resulting from the Company’s engagement of FIS. (4) Includes: (i) expenses in connection with the engagement of FIS of $1.0 million and $0.2 million in the three months ended September 30, 2022 and September 30, 2021, respectively; and (ii) expenses in connection with the Merger and related transactions of $0.2 million in the three months ended September 30, 2021, respectively. (5) In the three months ended June 30, 2022, includes $1.6 million of ROU asset impairment associated with the closure of a branch in Pembroke Pines, Florida in 2022. (6) Expenses related to the branch lease termination in Wellington, Florida in 2022. (7) Fair value adjustment related to one OREO property in New York. (8) Fair value adjustment related to the New York loan portfolio held for sale carried at the lower of cost or fair value. (9) In the nine months ended September 30, 2022 and 2021, amounts were calculated based upon the effective tax rate for the periods of 21.50% and 22.74%, respectively. For all of the other periods shown, amounts represent the difference between the prior and current period year-to-date tax effect. (10) In the three months ended September 30, 2022, June 30, 2022, and September 30, 2021, potential dilutive instruments consisted of unvested shares of restricted stock, restricted stock units and performance stock units. In all the periods presented, potential dilutive instruments were included in the diluted earnings per share computation because, when the unamortized deferred compensation cost related to these shares was divided by the average market price per share in those periods, fewer shares would have been purchased than restricted shares assumed issued. Therefore, in those periods, such awards resulted in higher diluted weighted average shares outstanding than basic weighted average shares outstanding, and had a dilutive effect in per share earnings. (11) Other intangible assets consist of, among other things, mortgage servicing rights (“MSRs”) of $1.0 million, $0.9 million and $0.6 million at September 30, 2022, June 30, 2022, and September 30, 2021, respectively, and are included in other assets in the Company’s consolidated balance sheets.
Thank you Investor Relations InvestorRelations@amerantbank.com