
Earnings Call July 21, 2023 Second Quarter 2023
2 Forward-Looking Statements This presentation contains “forward-looking statements” including statements with respect to the Company’s objectives, expectations and intentions and other statements that are not historical facts. All statements other than statements of historical fact are statements that could be forward-looking statements. You can identify these forward-looking statements through our use of words such as “may,” “will,” “anticipate,” “assume,” “should,” “indicate,” “would,” “believe,” “contemplate,” “expect,” “estimate,” “continue,” “plan,” “point to,” “project,” “could,” “intend,” “target,” “goals,” “outlooks,” “modeled,” “dedicated,” “create,” and other similar words and expressions of the future. Forward-looking statements, including those relating to our beliefs, plans, objectives, goals, expectations, anticipations, estimates and intentions, involve known and unknown risks, uncertainties and other factors, which may be beyond our control, and which may cause the Company’s actual results, performance, achievements, or financial condition to be materially different from future results, performance, achievements, or financial condition expressed or implied by such forward-looking statements. You should not rely on any forward-looking statements as predictions of future events. You should not expect us to update any forward-looking statements, except as required by law. All written or oral forward-looking statements attributable to us are expressly qualified in their entirety by this cautionary notice, together with those risks and uncertainties described in “Risk factors” in our annual report on Form 10-K for the fiscal year ended December 31, 2022 filed on March 1, 2023 (the "Form 10-K"), our quarterly report on Form 10-Q for the quarter ended March 31, 2023 filed on May 2, 2023, and in our other filings with the U.S. Securities and Exchange Commission (the “SEC”), which are available at the SEC’s website www.sec.gov. Interim Financial Information Unaudited financial information as of and for interim periods, including the three month periods ended June 30, 2023, March 31, 2023, December 31, 2022, June 30, 2022 and March 31, 2022, may not reflect our results of operations for our fiscal year ending, or financial condition as of December 31, 2023, or any other period of time or date. As previously disclosed in the Form 10-K, the Company adopted the new guidance on accounting for current expected credit losses on financial instruments (“CECL”) effective as of January 1, 2022. Quarterly amounts previously reported on our quarterly reports on Form 10-Q for the periods ended March 31, 2022, June 30, 2022 and September 30, 2022 do not reflect the adoption of CECL. In the fourth quarter of 2022, the Company recorded a provision for credit losses totaling $20.9 million, including $11.1 million related to the retroactive effect of adopting CECL for all previous quarterly periods in the year ended December 31, 2022, including loan growth and changes to macro-economic conditions during the period. Recast amounts included in the earnings release and accompanying presentation reflect the impacts of the adoption of CECL on each interim period of 2022. See the Form 10-K for more details on the adoption of CECL and related effects to quarterly results for each quarter in the year ended December 31, 2022. Non-GAAP Financial Measures The Company supplements its financial results that are determined in accordance with accounting principles generally accepted in the United States of America (“GAAP”) with non-GAAP financial measures, such as “pre-provision net revenue (PPNR)”, “core pre-provision net revenue (Core PPNR)”, “core noninterest income”, “core noninterest expenses”, “core net income”, “core earnings per share (basic and diluted)”, “core return on assets (Core ROA)”, “core return on equity (Core ROE)”, “core efficiency ratio”, “tangible stockholders’ equity (book value) per common share”, “tangible common equity ratio, adjusted for unrealized losses on debt securities held to maturity”, and “tangible stockholders' equity (book value) per common share, adjusted for unrealized losses on debt securities held to maturity”, and "tangible stockholders' book value per common share, adjusted for unrealized losses on securities held to maturity". This supplemental information is not required by, or is not presented in accordance with GAAP. The Company refers to these financial measures and ratios as “non-GAAP financial measures” and they should not be considered in isolation or as a substitute for the GAAP measures presented herein. We use certain non-GAAP financial measures, including those mentioned above, both to explain our results to shareholders and the investment community and in the internal evaluation and management of our businesses. Our management believes that these non-GAAP financial measures and the information they provide are useful to investors since these measures permit investors to view our performance using the same tools that our management uses to evaluate our past performance and prospects for future performance, especially in light of the additional costs we have incurred in connection with the Company’s restructuring activities that began in 2018 and continued in 2023, including the effect of non-core banking activities such as the sale of loans and securities and other repossessed assets, the valuation of securities, derivatives, loans held for sale and other real estate owned, impairment of investments, early repayment of FHLB advances, and other non-recurring actions intended to improve customer service and operating performance. While we believe that these non-GAAP financial measures are useful in evaluating our performance, this information should be considered as supplemental and not as a substitute for or superior to the related financial information prepared in accordance with GAAP. Additionally, these non-GAAP financial measures may differ from similar measures presented by other companies. Exhibit 2 reconciles these non-GAAP financial measures to reported results. Important Notices and Disclaimers
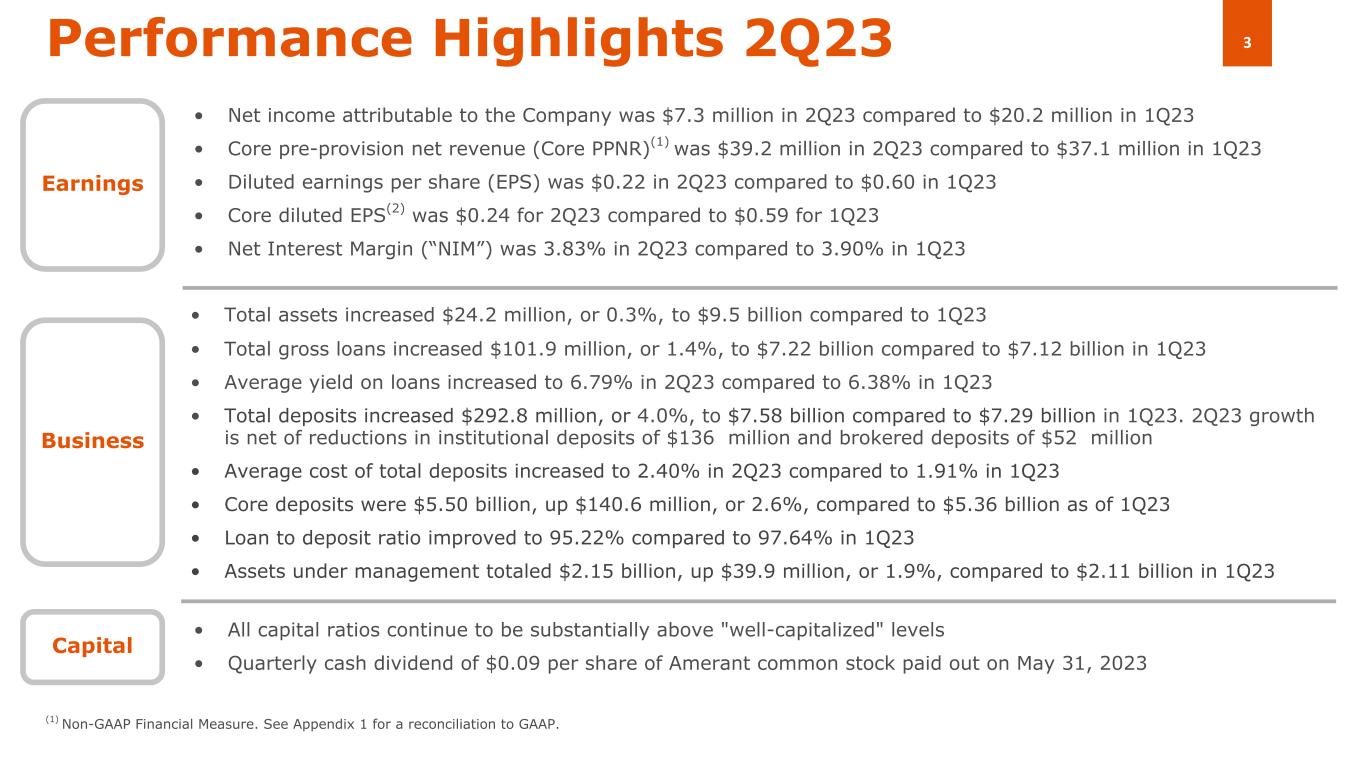
3Performance Highlights 2Q23 Business • Net income attributable to the Company was $7.3 million in 2Q23 compared to $20.2 million in 1Q23 • Core pre-provision net revenue (Core PPNR)(1) was $39.2 million in 2Q23 compared to $37.1 million in 1Q23 • Diluted earnings per share (EPS) was $0.22 in 2Q23 compared to $0.60 in 1Q23 • Core diluted EPS(2) was $0.24 for 2Q23 compared to $0.59 for 1Q23 • Net Interest Margin (“NIM”) was 3.83% in 2Q23 compared to 3.90% in 1Q23 • Total assets increased $24.2 million, or 0.3%, to $9.5 billion compared to 1Q23 • Total gross loans increased $101.9 million, or 1.4%, to $7.22 billion compared to $7.12 billion in 1Q23 • Average yield on loans increased to 6.79% in 2Q23 compared to 6.38% in 1Q23 • Total deposits increased $292.8 million, or 4.0%, to $7.58 billion compared to $7.29 billion in 1Q23. 2Q23 growth is net of reductions in institutional deposits of $136 million and brokered deposits of $52 million • Average cost of total deposits increased to 2.40% in 2Q23 compared to 1.91% in 1Q23 • Core deposits were $5.50 billion, up $140.6 million, or 2.6%, compared to $5.36 billion as of 1Q23 • Loan to deposit ratio improved to 95.22% compared to 97.64% in 1Q23 • Assets under management totaled $2.15 billion, up $39.9 million, or 1.9%, compared to $2.11 billion in 1Q23 Earnings Capital • All capital ratios continue to be substantially above "well-capitalized" levels • Quarterly cash dividend of $0.09 per share of Amerant common stock paid out on May 31, 2023 (1) Non-GAAP Financial Measure. See Appendix 1 for a reconciliation to GAAP.
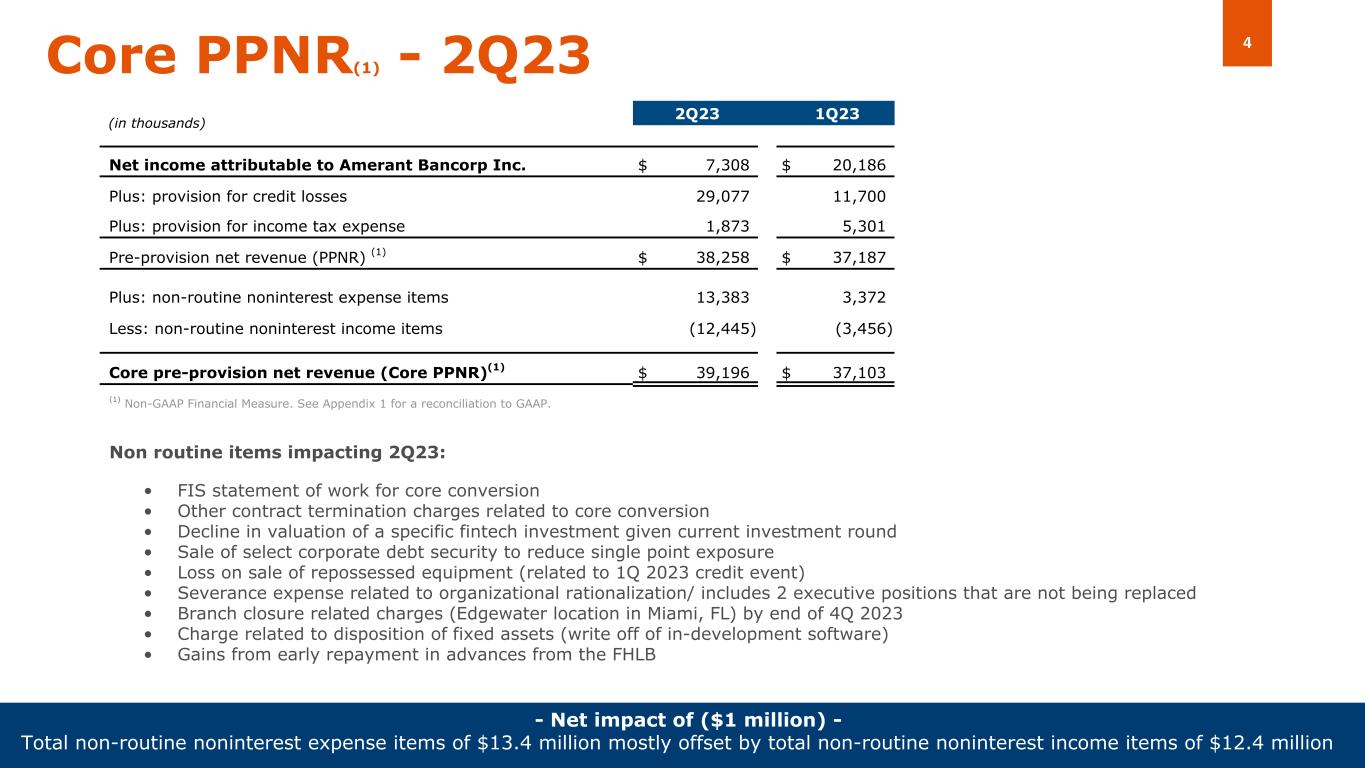
4Core PPNR(1) - 2Q23 (1) Non-GAAP Financial Measure. See Appendix 1 for a reconciliation to GAAP. (in 2Q23 1Q23 Net income attributable to Amerant Bancorp Inc. $ 7,308 $ 20,186 Plus: provision for credit losses 29,077 11,700 Plus: provision for income tax expense 1,873 5,301 Pre-provision net revenue (PPNR) (1) $ 38,258 $ 37,187 Plus: non-routine noninterest expense items 13,383 3,372 Less: non-routine noninterest income items (12,445) (3,456) Core pre-provision net revenue (Core PPNR)(1) $ 39,196 $ 37,103 (in thousands) Non routine items impacting 2Q23: • FIS statement of work for core conversion • Other contract termination charges related to core conversion • Decline in valuation of a specific fintech investment given current investment round • Sale of select corporate debt security to reduce single point exposure • Loss on sale of repossessed equipment (related to 1Q 2023 credit event) • Severance expense related to organizational rationalization/ includes 2 executive positions that are not being replaced • Branch closure related charges (Edgewater location in Miami, FL) by end of 4Q 2023 • Charge related to disposition of fixed assets (write off of in-development software) • Gains from early repayment in advances from the FHLB - Net impact of ($1 million) - Total non-routine noninterest expense items of $13.4 million mostly offset by total non-routine noninterest income items of $12.4 million
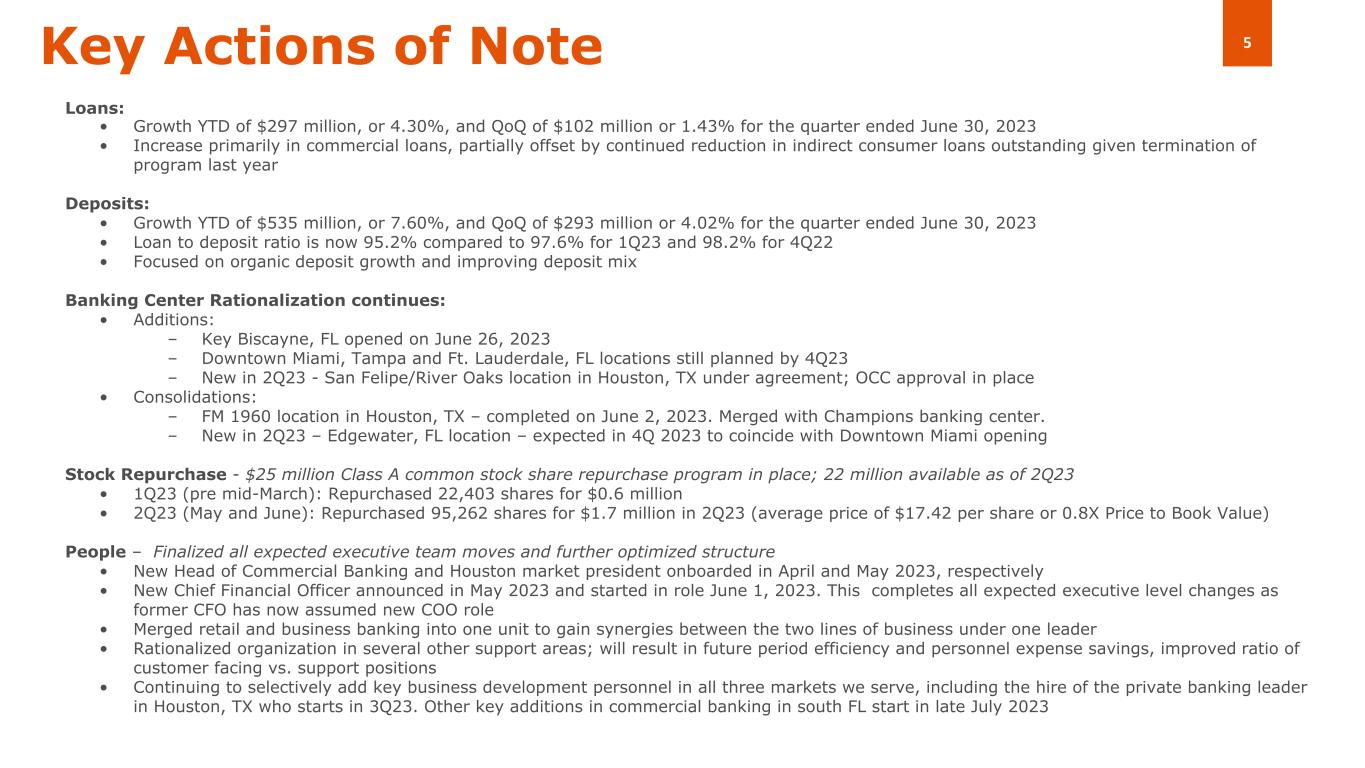
5Key Actions of Note Loans: • Growth YTD of $297 million, or 4.30%, and QoQ of $102 million or 1.43% for the quarter ended June 30, 2023 • Increase primarily in commercial loans, partially offset by continued reduction in indirect consumer loans outstanding given termination of program last year Deposits: • Growth YTD of $535 million, or 7.60%, and QoQ of $293 million or 4.02% for the quarter ended June 30, 2023 • Loan to deposit ratio is now 95.2% compared to 97.6% for 1Q23 and 98.2% for 4Q22 • Focused on organic deposit growth and improving deposit mix Banking Center Rationalization continues: • Additions: – Key Biscayne, FL opened on June 26, 2023 – Downtown Miami, Tampa and Ft. Lauderdale, FL locations still planned by 4Q23 – New in 2Q23 - San Felipe/River Oaks location in Houston, TX under agreement; OCC approval in place • Consolidations: – FM 1960 location in Houston, TX – completed on June 2, 2023. Merged with Champions banking center. – New in 2Q23 – Edgewater, FL location – expected in 4Q 2023 to coincide with Downtown Miami opening Stock Repurchase - $25 million Class A common stock share repurchase program in place; 22 million available as of 2Q23 • 1Q23 (pre mid-March): Repurchased 22,403 shares for $0.6 million • 2Q23 (May and June): Repurchased 95,262 shares for $1.7 million in 2Q23 (average price of $17.42 per share or 0.8X Price to Book Value) People – Finalized all expected executive team moves and further optimized structure • New Head of Commercial Banking and Houston market president onboarded in April and May 2023, respectively • New Chief Financial Officer announced in May 2023 and started in role June 1, 2023. This completes all expected executive level changes as former CFO has now assumed new COO role • Merged retail and business banking into one unit to gain synergies between the two lines of business under one leader • Rationalized organization in several other support areas; will result in future period efficiency and personnel expense savings, improved ratio of customer facing vs. support positions • Continuing to selectively add key business development personnel in all three markets we serve, including the hire of the private banking leader in Houston, TX who starts in 3Q23. Other key additions in commercial banking in south FL start in late July 2023
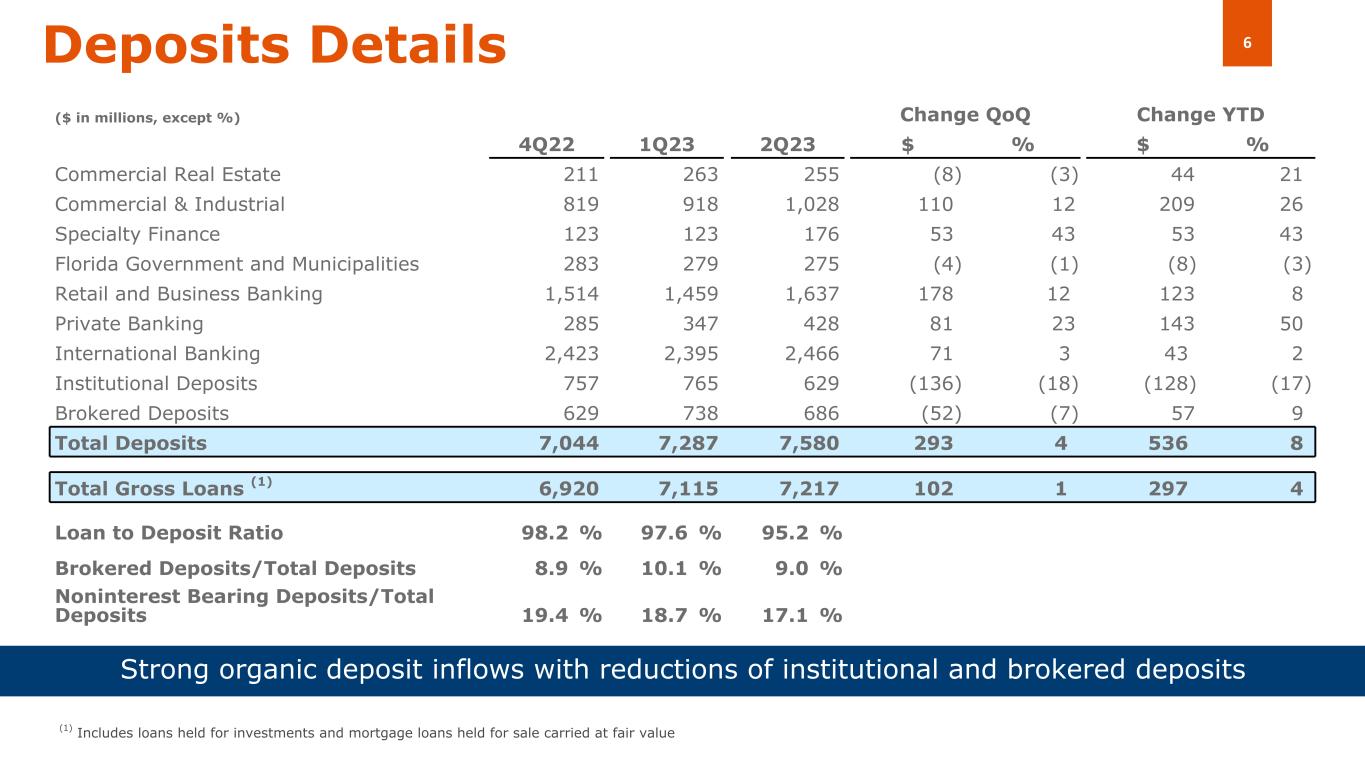
6 ($ in millions, except %) Change QoQ Change YTD 4Q22 1Q23 2Q23 $ % $ % Commercial Real Estate 211 263 255 (8) (3) 44 21 Commercial & Industrial 819 918 1,028 110 12 209 26 Specialty Finance 123 123 176 53 43 53 43 Florida Government and Municipalities 283 279 275 (4) (1) (8) (3) Retail and Business Banking 1,514 1,459 1,637 178 12 123 8 Private Banking 285 347 428 81 23 143 50 International Banking 2,423 2,395 2,466 71 3 43 2 Institutional Deposits 757 765 629 (136) (18) (128) (17) Brokered Deposits 629 738 686 (52) (7) 57 9 Total Deposits 7,044 7,287 7,580 293 4 536 8 Total Gross Loans (1) 6,920 7,115 7,217 102 1 297 4 Loan to Deposit Ratio 98.2 % 97.6 % 95.2 % Brokered Deposits/Total Deposits 8.9 % 10.1 % 9.0 % Noninterest Bearing Deposits/Total Deposits 19.4 % 18.7 % 17.1 % Strong organic deposit inflows with reductions of institutional and brokered deposits Deposits Details (1) Includes loans held for investments and mortgage loans held for sale carried at fair value
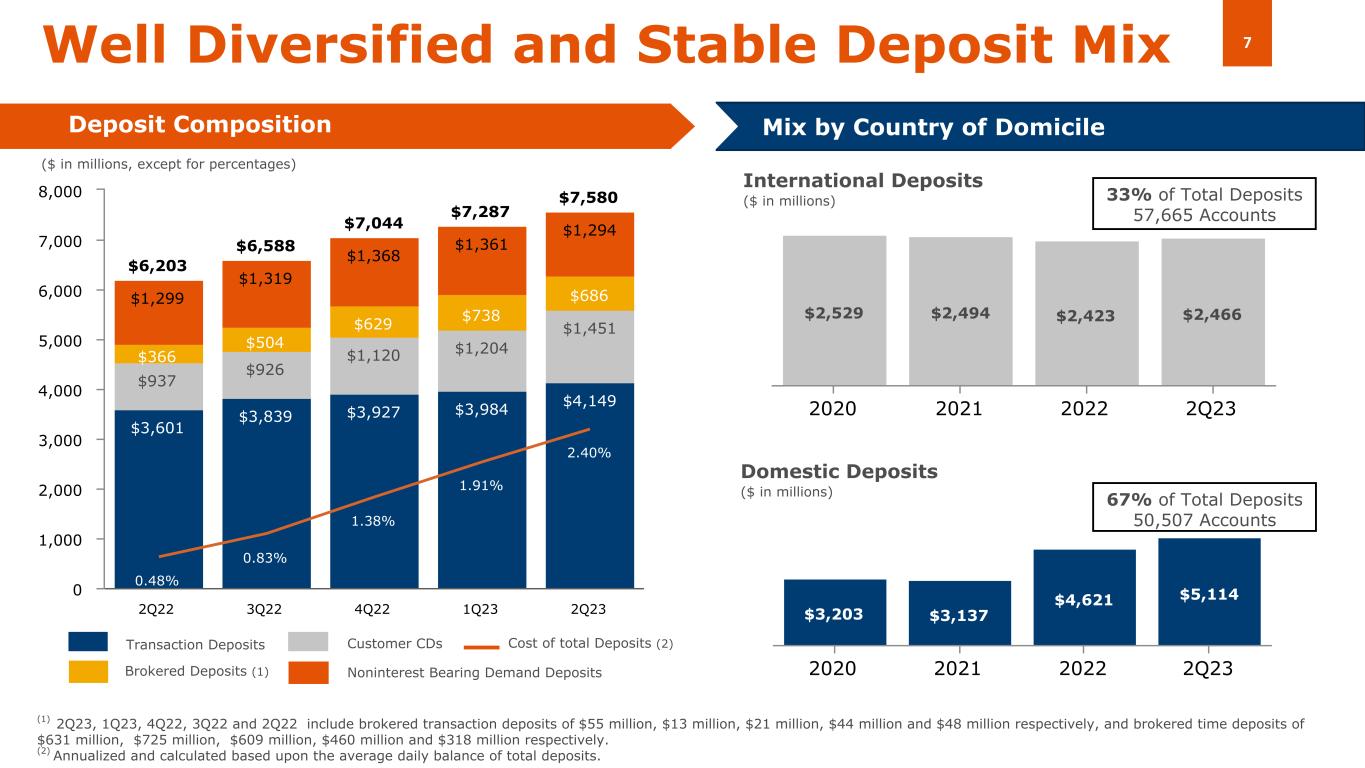
7 $6,203 $6,588 $7,044 $7,287 $7,580 $3,601 $3,839 $3,927 $3,984 $4,149 $937 $926 $1,120 $1,204 $1,451 $366 $504 $629 $738 $686$1,299 $1,319 $1,368 $1,361 $1,294 0.48% 0.83% 1.38% 1.91% 2.40% 2Q22 3Q22 4Q22 1Q23 2Q23 0 1,000 2,000 3,000 4,000 5,000 6,000 7,000 8,000 $2,529 $2,494 $2,423 $2,466 2020 2021 2022 2Q23 $3,203 $3,137 $4,621 $5,114 2020 2021 2022 2Q23 Domestic Deposits ($ in millions) Well Diversified and Stable Deposit Mix Deposit Composition International Deposits ($ in millions) Mix by Country of Domicile Transaction Deposits Customer CDs Brokered Deposits (1) Cost of total Deposits (2) ($ in millions, except for percentages) (1) 2Q23, 1Q23, 4Q22, 3Q22 and 2Q22 include brokered transaction deposits of $55 million, $13 million, $21 million, $44 million and $48 million respectively, and brokered time deposits of $631 million, $725 million, $609 million, $460 million and $318 million respectively. (2) Annualized and calculated based upon the average daily balance of total deposits. Noninterest Bearing Demand Deposits 33% of Total Deposits 57,665 Accounts 67% of Total Deposits 50,507 Accounts
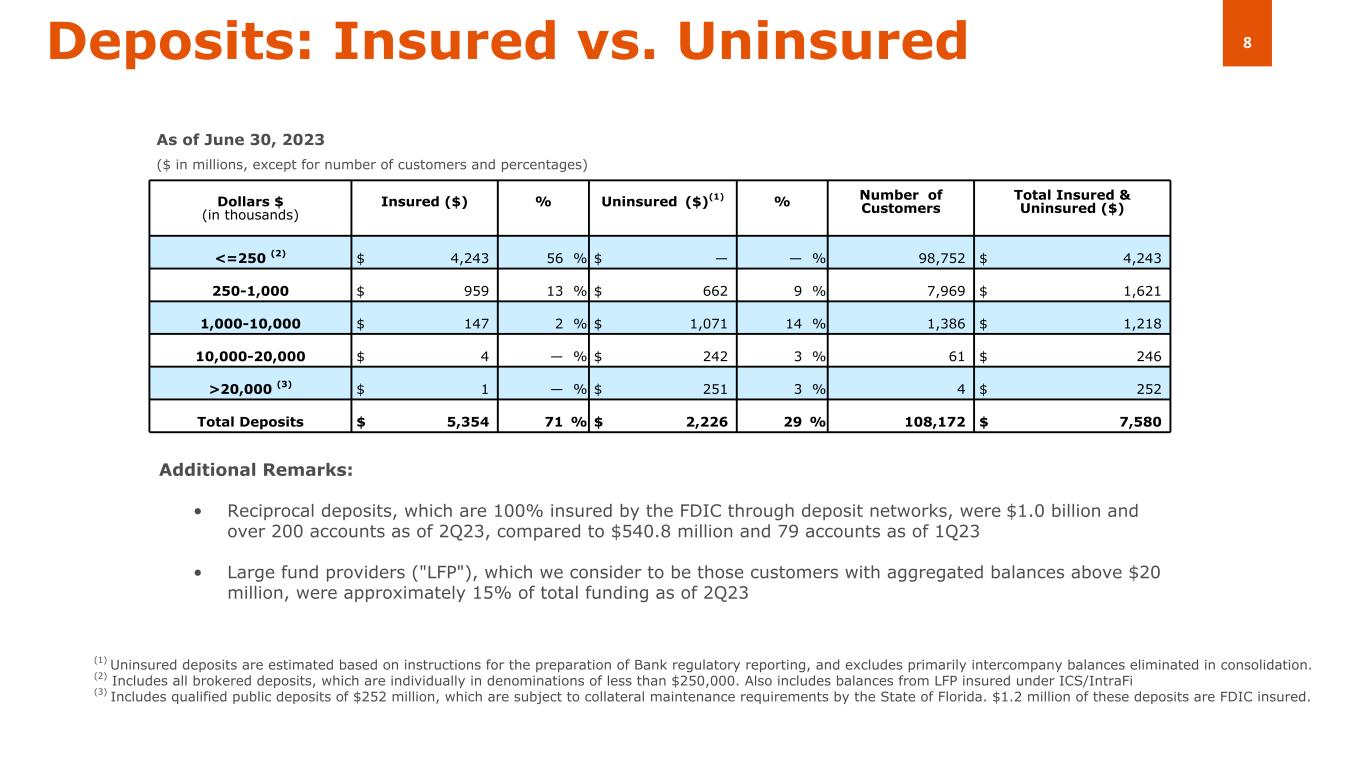
8Deposits: Insured vs. Uninsured Dollars $ (in thousands) Insured ($) % Uninsured ($)(1) % Number of Customers Total Insured & Uninsured ($) <=250 (2) $ 4,243 56 % $ — — % 98,752 $ 4,243 250-1,000 $ 959 13 % $ 662 9 % 7,969 $ 1,621 1,000-10,000 $ 147 2 % $ 1,071 14 % 1,386 $ 1,218 10,000-20,000 $ 4 — % $ 242 3 % 61 $ 246 >20,000 (3) $ 1 — % $ 251 3 % 4 $ 252 Total Deposits $ 5,354 71 % $ 2,226 29 % 108,172 $ 7,580 As of June 30, 2023 (1) Uninsured deposits are estimated based on instructions for the preparation of Bank regulatory reporting, and excludes primarily intercompany balances eliminated in consolidation. (2) Includes all brokered deposits, which are individually in denominations of less than $250,000. Also includes balances from LFP insured under ICS/IntraFi (3) Includes qualified public deposits of $252 million, which are subject to collateral maintenance requirements by the State of Florida. $1.2 million of these deposits are FDIC insured. Additional Remarks: • Reciprocal deposits, which are 100% insured by the FDIC through deposit networks, were $1.0 billion and over 200 accounts as of 2Q23, compared to $540.8 million and 79 accounts as of 1Q23 • Large fund providers ("LFP"), which we consider to be those customers with aggregated balances above $20 million, were approximately 15% of total funding as of 2Q23 ($ in millions, except for number of customers and percentages)
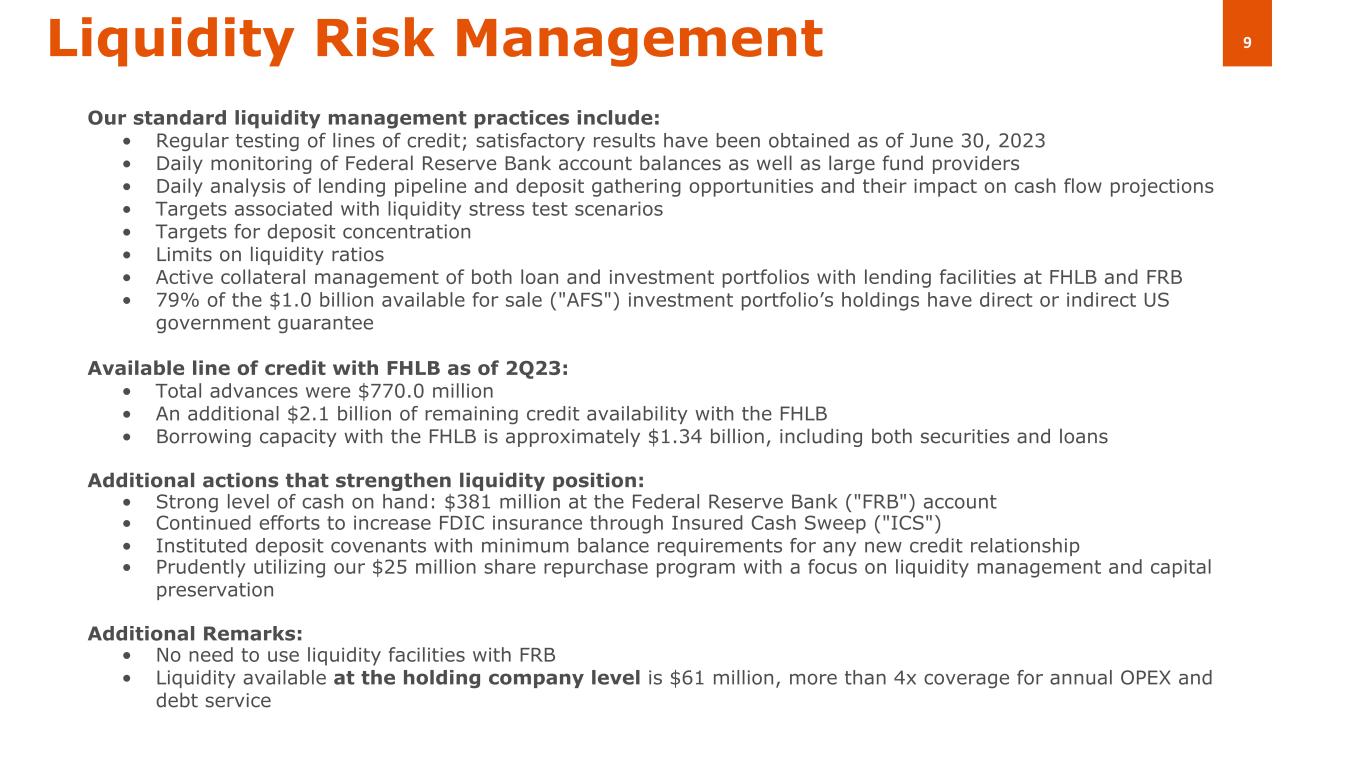
9Liquidity Risk Management Our standard liquidity management practices include: • Regular testing of lines of credit; satisfactory results have been obtained as of June 30, 2023 • Daily monitoring of Federal Reserve Bank account balances as well as large fund providers • Daily analysis of lending pipeline and deposit gathering opportunities and their impact on cash flow projections • Targets associated with liquidity stress test scenarios • Targets for deposit concentration • Limits on liquidity ratios • Active collateral management of both loan and investment portfolios with lending facilities at FHLB and FRB • 79% of the $1.0 billion available for sale ("AFS") investment portfolio’s holdings have direct or indirect US government guarantee Available line of credit with FHLB as of 2Q23: • Total advances were $770.0 million • An additional $2.1 billion of remaining credit availability with the FHLB • Borrowing capacity with the FHLB is approximately $1.34 billion, including both securities and loans Additional actions that strengthen liquidity position: • Strong level of cash on hand: $381 million at the Federal Reserve Bank ("FRB") account • Continued efforts to increase FDIC insurance through Insured Cash Sweep ("ICS") • Instituted deposit covenants with minimum balance requirements for any new credit relationship • Prudently utilizing our $25 million share repurchase program with a focus on liquidity management and capital preservation Additional Remarks: • No need to use liquidity facilities with FRB • Liquidity available at the holding company level is $61 million, more than 4x coverage for annual OPEX and debt service
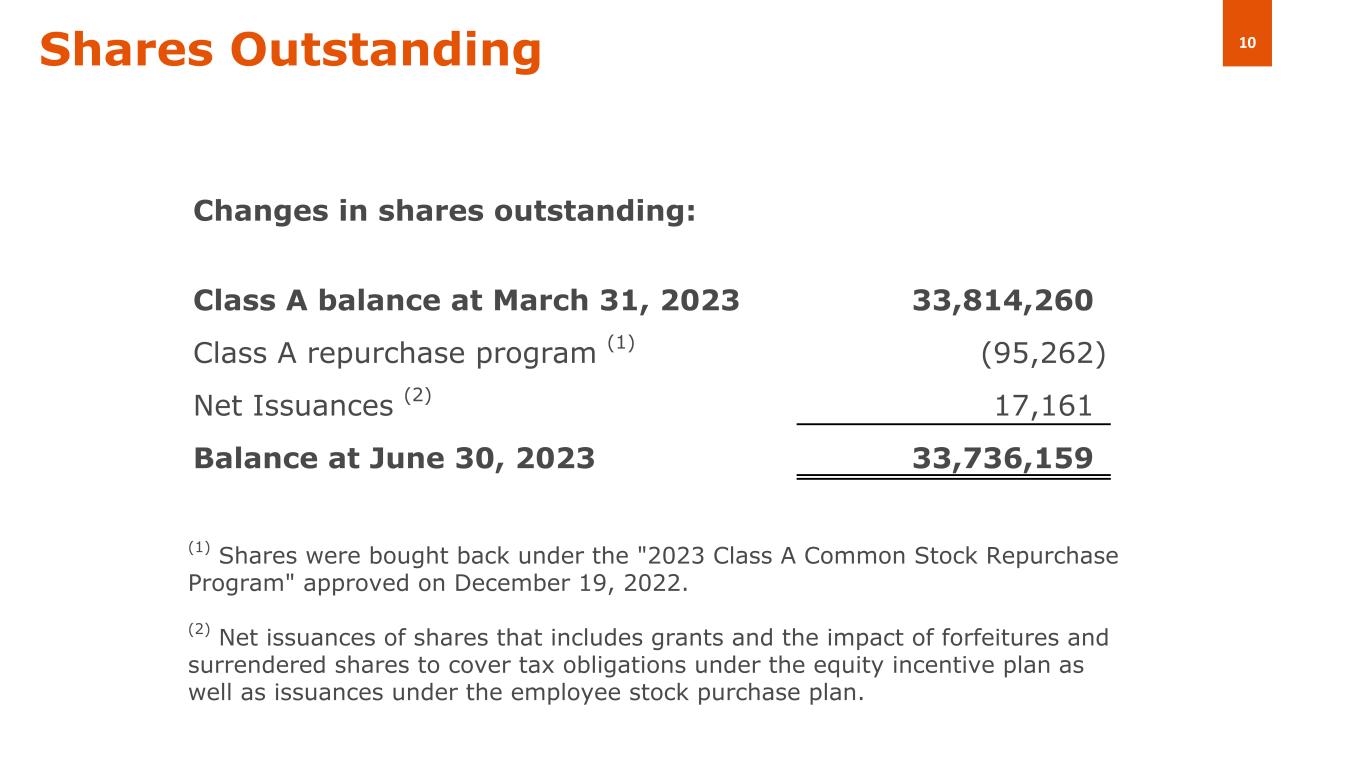
10Shares Outstanding (1) Shares were bought back under the "2023 Class A Common Stock Repurchase Program" approved on December 19, 2022. (2) Net issuances of shares that includes grants and the impact of forfeitures and surrendered shares to cover tax obligations under the equity incentive plan as well as issuances under the employee stock purchase plan. Changes in shares outstanding: Class A balance at March 31, 2023 33,814,260 Class A repurchase program (1) (95,262) Net Issuances (2) 17,161 Balance at June 30, 2023 33,736,159
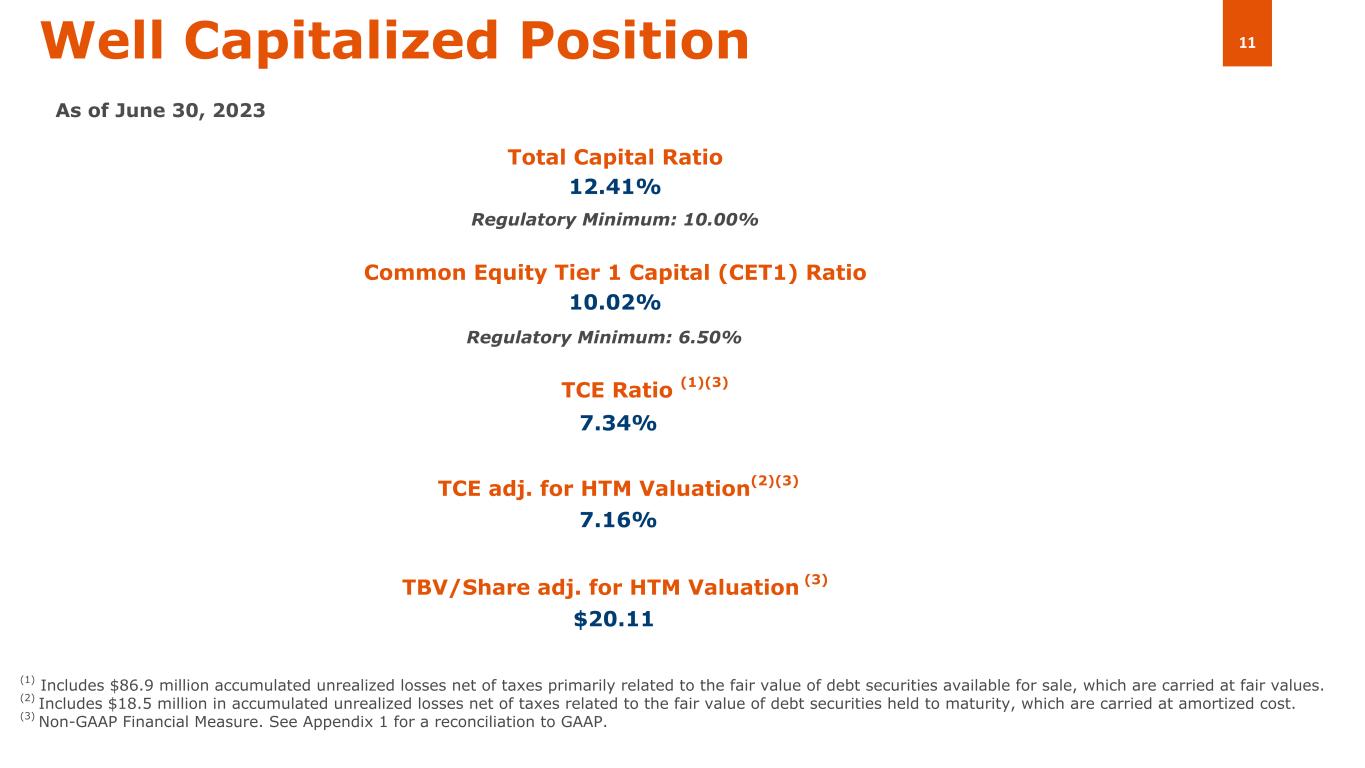
11Well Capitalized Position (1) Includes $86.9 million accumulated unrealized losses net of taxes primarily related to the fair value of debt securities available for sale, which are carried at fair values. (2) Includes $18.5 million in accumulated unrealized losses net of taxes related to the fair value of debt securities held to maturity, which are carried at amortized cost. (3) Non-GAAP Financial Measure. See Appendix 1 for a reconciliation to GAAP. As of June 30, 2023 Total Capital Ratio 12.41% TCE Ratio (1)(3) TCE adj. for HTM Valuation(2)(3) TBV/Share adj. for HTM Valuation (3) 7.34% 10.02% 7.16% $20.11 Regulatory Minimum: 10.00% Common Equity Tier 1 Capital (CET1) Ratio Regulatory Minimum: 6.50%
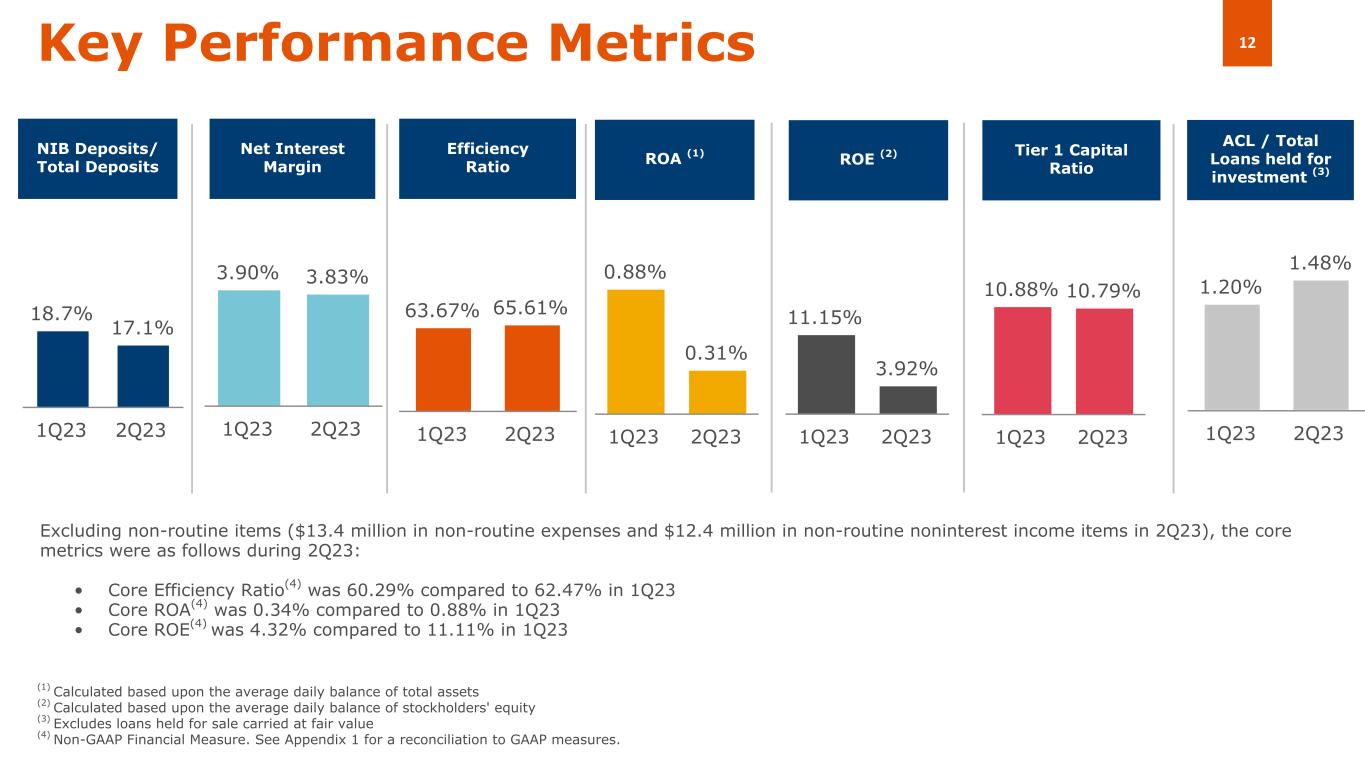
12 63.67% 65.61% 1Q23 2Q23 18.7% 17.1% 1Q23 2Q23 10.88% 10.79% 1Q23 2Q23 3.90% 3.83% 1Q23 2Q23 Key Performance Metrics NIB Deposits/ Total Deposits Tier 1 Capital Ratio Net Interest Margin Efficiency Ratio (1) Calculated based upon the average daily balance of total assets (2) Calculated based upon the average daily balance of stockholders' equity (3) Excludes loans held for sale carried at fair value (4) Non-GAAP Financial Measure. See Appendix 1 for a reconciliation to GAAP measures. 1.20% 1.48% 1Q23 2Q23 ACL / Total Loans held for investment (3) 0.88% 0.31% 1Q23 2Q23 ROA (1) 11.15% 3.92% 1Q23 2Q23 Excluding non-routine items ($13.4 million in non-routine expenses and $12.4 million in non-routine noninterest income items in 2Q23), the core metrics were as follows during 2Q23: • Core Efficiency Ratio(4) was 60.29% compared to 62.47% in 1Q23 • Core ROA(4) was 0.34% compared to 0.88% in 1Q23 • Core ROE(4) was 4.32% compared to 11.11% in 1Q23 ROE (2)
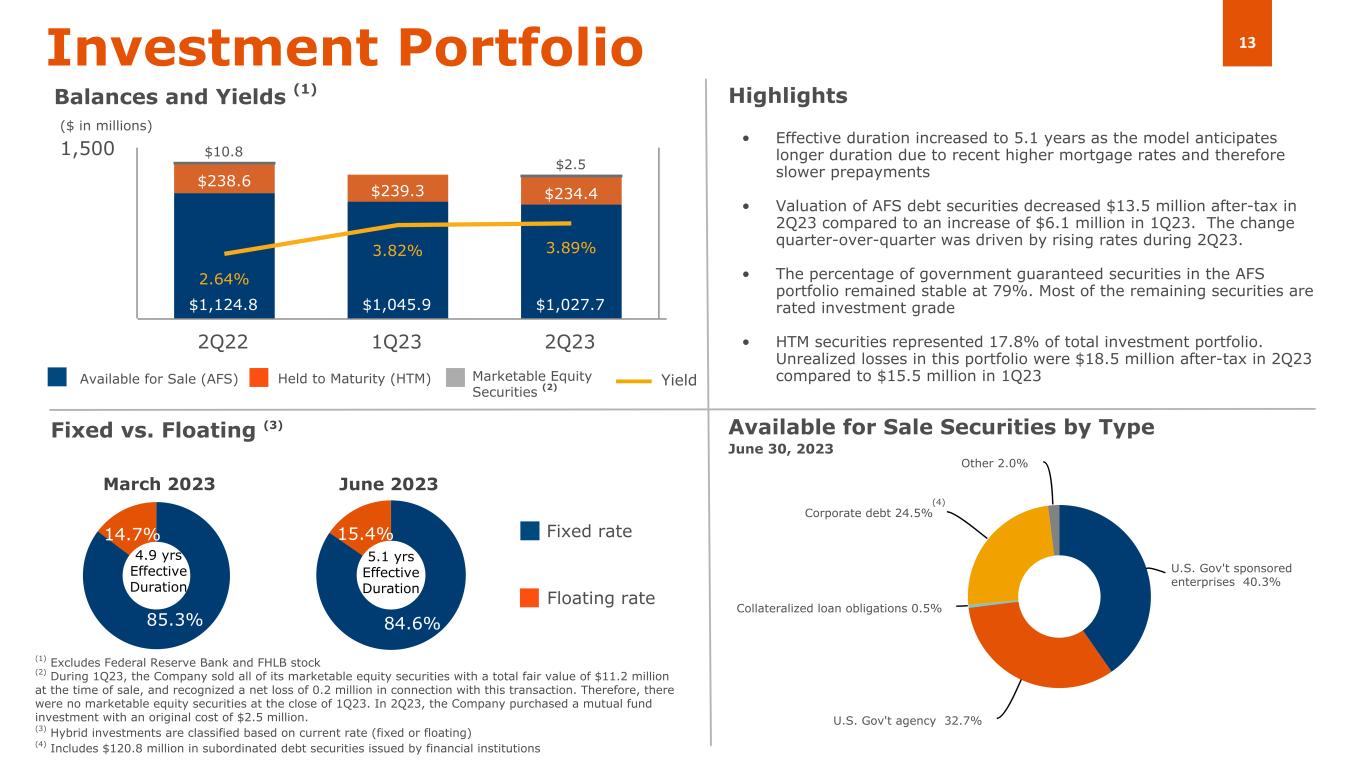
13 84.6% 15.4% U.S. Gov't sponsored enterprises 40.3% U.S. Gov't agency 32.7% Collateralized loan obligations 0.5% Corporate debt 24.5% Other 2.0% $1,124.8 $1,045.9 $1,027.7 $238.6 $239.3 $234.4 $10.8 $2.5 2.64% 3.82% 3.89% 2Q22 1Q23 2Q23 1,500 85.3% 14.7% Investment Portfolio Balances and Yields (1) Available for Sale (AFS) Held to Maturity (HTM) Highlights Fixed vs. Floating (3) March 2023 June 2023 Floating rate Fixed rate Available for Sale Securities by Type June 30, 2023 4.9 yrs Effective Duration ($ in millions) Marketable Equity Securities (2) (1) Excludes Federal Reserve Bank and FHLB stock (2) During 1Q23, the Company sold all of its marketable equity securities with a total fair value of $11.2 million at the time of sale, and recognized a net loss of 0.2 million in connection with this transaction. Therefore, there were no marketable equity securities at the close of 1Q23. In 2Q23, the Company purchased a mutual fund investment with an original cost of $2.5 million. (3) Hybrid investments are classified based on current rate (fixed or floating) (4) Includes $120.8 million in subordinated debt securities issued by financial institutions Yield 5.1 yrs Effective Duration • Effective duration increased to 5.1 years as the model anticipates longer duration due to recent higher mortgage rates and therefore slower prepayments • Valuation of AFS debt securities decreased $13.5 million after-tax in 2Q23 compared to an increase of $6.1 million in 1Q23. The change quarter-over-quarter was driven by rising rates during 2Q23. • The percentage of government guaranteed securities in the AFS portfolio remained stable at 79%. Most of the remaining securities are rated investment grade • HTM securities represented 17.8% of total investment portfolio. Unrealized losses in this portfolio were $18.5 million after-tax in 2Q23 compared to $15.5 million in 1Q23 (4)
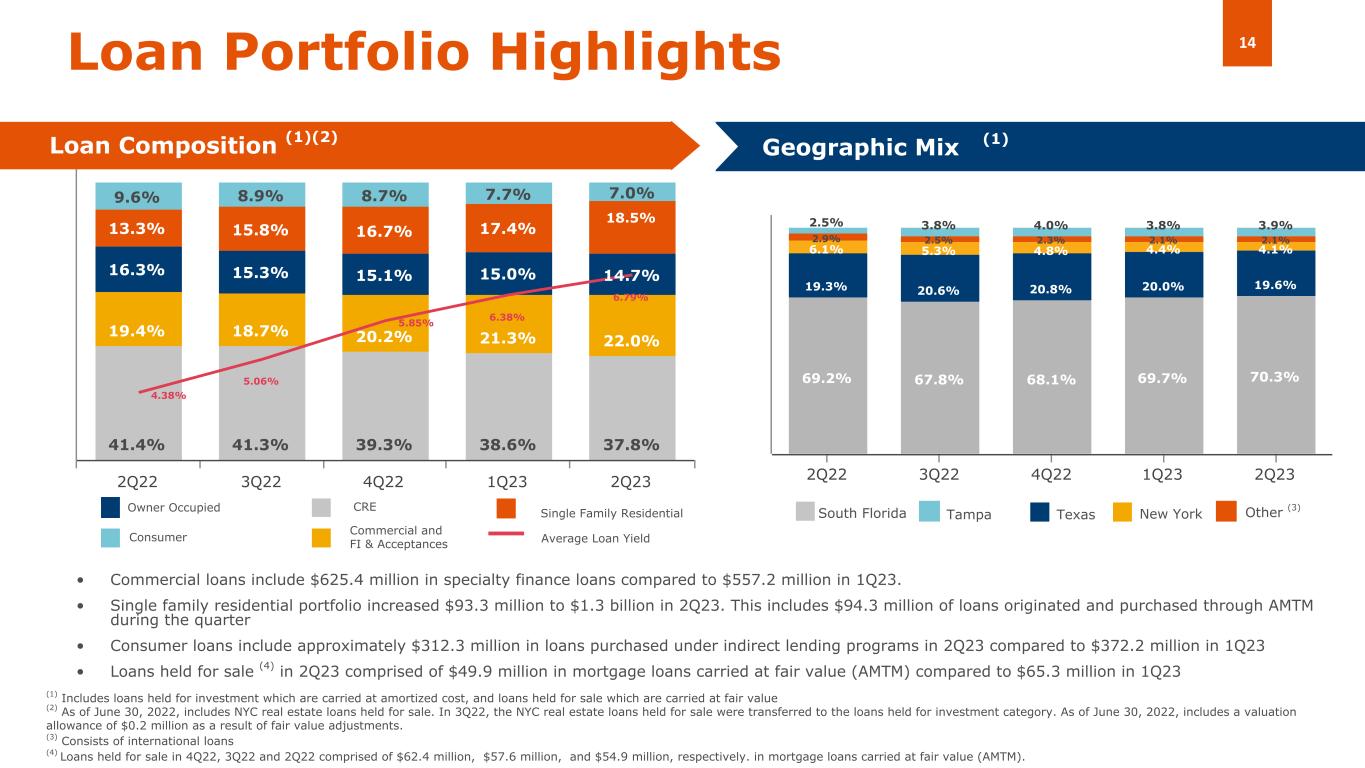
14 41.4% 41.3% 39.3% 38.6% 37.8% 19.4% 18.7% 20.2% 21.3% 22.0% 16.3% 15.3% 15.1% 15.0% 14.7% 13.3% 15.8% 16.7% 17.4% 18.5% 9.6% 8.9% 8.7% 7.7% 7.0% 4.38% 5.06% 5.85% 6.38% 6.79% 2Q22 3Q22 4Q22 1Q23 2Q23 69.2% 67.8% 68.1% 69.7% 70.3% 19.3% 20.6% 20.8% 20.0% 19.6% 6.1% 5.3% 4.8% 4.4% 4.1% 2.9% 2.5% 2.3% 2.1% 2.1% 2.5% 3.8% 4.0% 3.8% 3.9% 2Q22 3Q22 4Q22 1Q23 2Q23 Consumer CRE Commercial and FI & Acceptances Owner Occupied Single Family Residential Loan Portfolio Highlights Loan Composition (1)(2) Geographic Mix (Domestic) • Commercial loans include $625.4 million in specialty finance loans compared to $557.2 million in 1Q23. • Single family residential portfolio increased $93.3 million to $1.3 billion in 2Q23. This includes $94.3 million of loans originated and purchased through AMTM during the quarter • Consumer loans include approximately $312.3 million in loans purchased under indirect lending programs in 2Q23 compared to $372.2 million in 1Q23 • Loans held for sale (4) in 2Q23 comprised of $49.9 million in mortgage loans carried at fair value (AMTM) compared to $65.3 million in 1Q23 (1) South Florida Texas New York Average Loan Yield Other (3) (1) Includes loans held for investment which are carried at amortized cost, and loans held for sale which are carried at fair value (2) As of June 30, 2022, includes NYC real estate loans held for sale. In 3Q22, the NYC real estate loans held for sale were transferred to the loans held for investment category. As of June 30, 2022, includes a valuation allowance of $0.2 million as a result of fair value adjustments. (3) Consists of international loans (4) Loans held for sale in 4Q22, 3Q22 and 2Q22 comprised of $62.4 million, $57.6 million, and $54.9 million, respectively. in mortgage loans carried at fair value (AMTM). Tampa
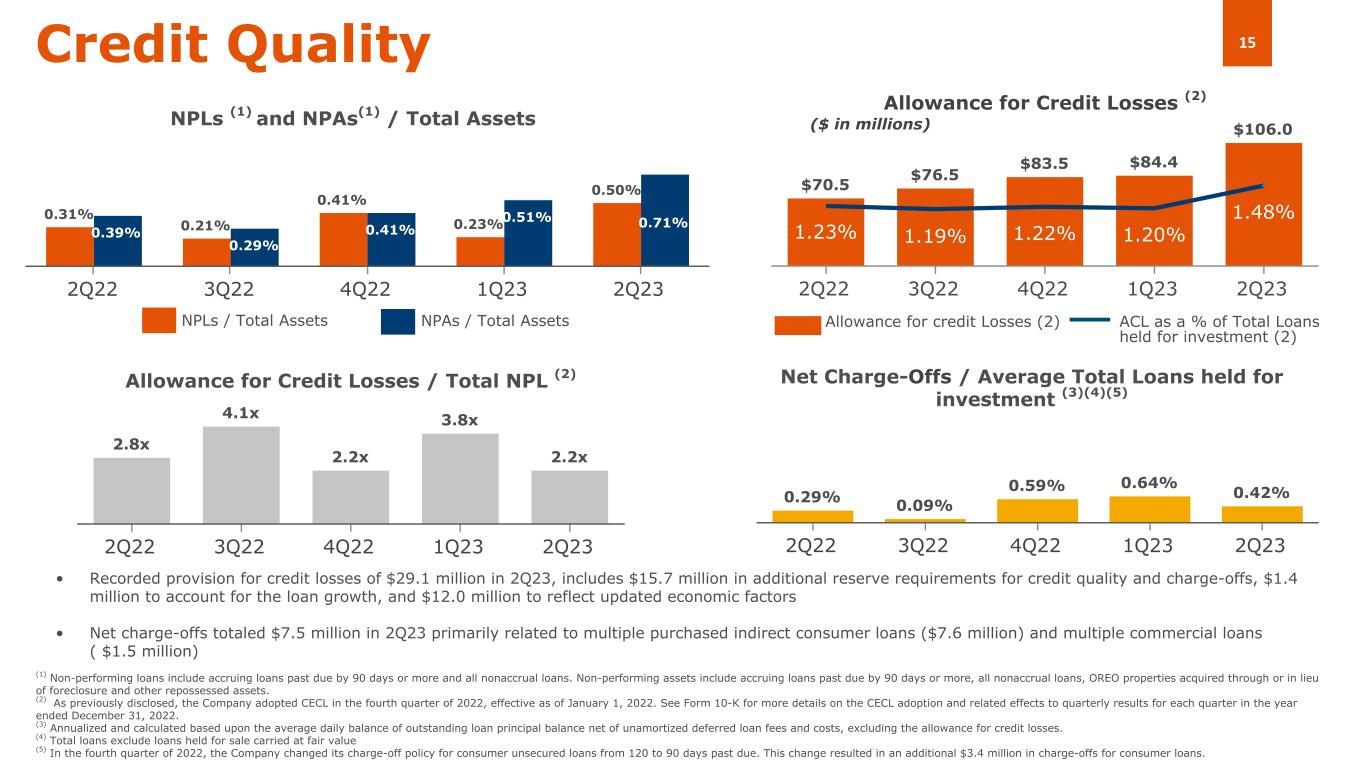
15 0.31% 0.21% 0.41% 0.23% 0.50% 0.39% 0.29% 0.41% 0.51% 0.71% 2Q22 3Q22 4Q22 1Q23 2Q23 2.8x 4.1x 2.2x 3.8x 2.2x 2Q22 3Q22 4Q22 1Q23 2Q23 $70.5 $76.5 $83.5 $84.4 $106.0 1.23% 1.19% 1.22% 1.20% 1.48% 2Q22 3Q22 4Q22 1Q23 2Q23 0.29% 0.09% 0.59% 0.64% 0.42% 2Q22 3Q22 4Q22 1Q23 2Q23 • Recorded provision for credit losses of $29.1 million in 2Q23, includes $15.7 million in additional reserve requirements for credit quality and charge-offs, $1.4 million to account for the loan growth, and $12.0 million to reflect updated economic factors • Net charge-offs totaled $7.5 million in 2Q23 primarily related to multiple purchased indirect consumer loans ($7.6 million) and multiple commercial loans ( $1.5 million) Net Charge-Offs / Average Total Loans held for investment (3)(4)(5) Credit Quality Allowance for Credit Losses (2) ($ in millions)NPLs (1) and NPAs(1) / Total Assets Allowance for Credit Losses / Total NPL (2) Allowance for credit Losses (2) ACL as a % of Total Loans held for investment (2) (1) Non-performing loans include accruing loans past due by 90 days or more and all nonaccrual loans. Non-performing assets include accruing loans past due by 90 days or more, all nonaccrual loans, OREO properties acquired through or in lieu of foreclosure and other repossessed assets. (2) As previously disclosed, the Company adopted CECL in the fourth quarter of 2022, effective as of January 1, 2022. See Form 10-K for more details on the CECL adoption and related effects to quarterly results for each quarter in the year ended December 31, 2022. (3) Annualized and calculated based upon the average daily balance of outstanding loan principal balance net of unamortized deferred loan fees and costs, excluding the allowance for credit losses. (4) Total loans exclude loans held for sale carried at fair value (5) In the fourth quarter of 2022, the Company changed its charge-off policy for consumer unsecured loans from 120 to 90 days past due. This change resulted in an additional $3.4 million in charge-offs for consumer loans. NPLs / Total Assets NPAs / Total Assets
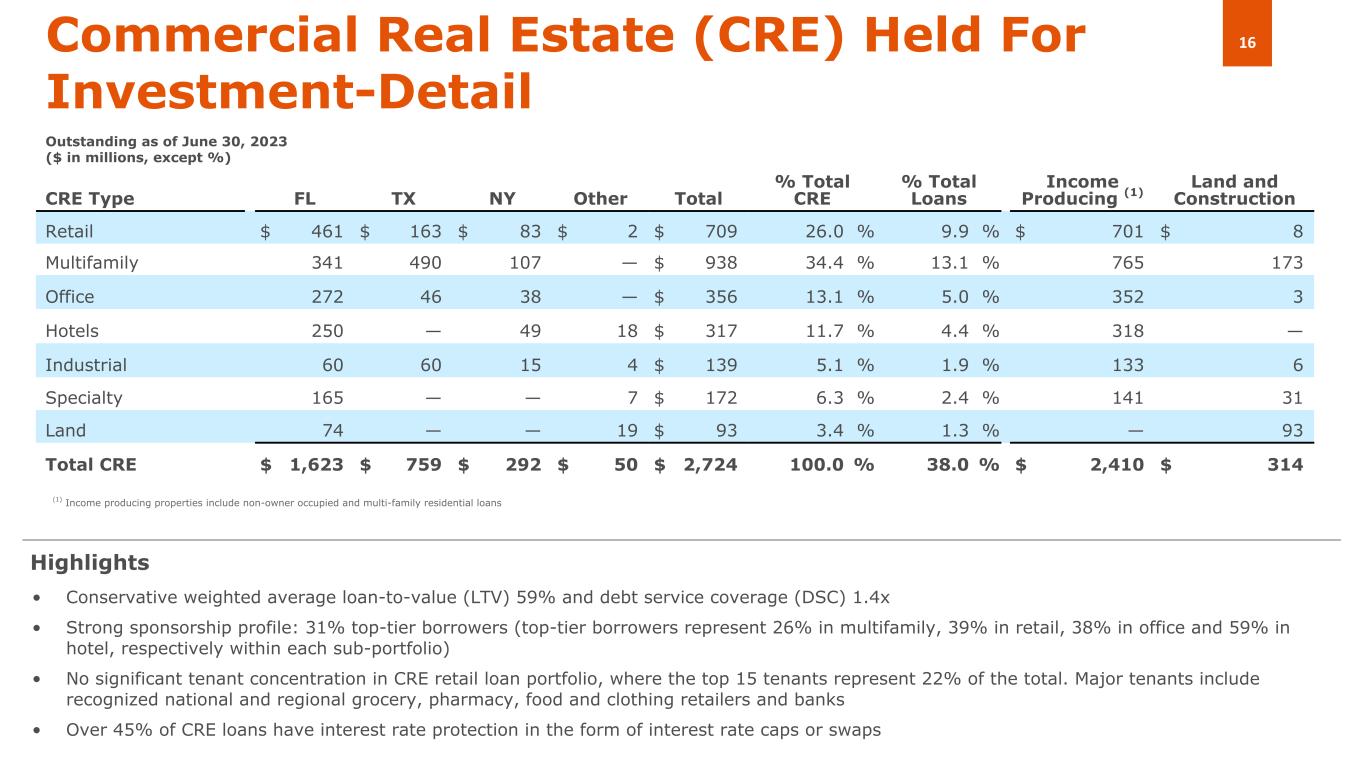
16Commercial Real Estate (CRE) Held For Investment-Detail CRE Type FL TX NY Other Total % Total CRE % Total Loans Income Producing (1) Land and Construction Retail $ 461 $ 163 $ 83 $ 2 $ 709 26.0 % 9.9 % $ 701 $ 8 Multifamily 341 490 107 — $ 938 34.4 % 13.1 % 765 173 Office 272 46 38 — $ 356 13.1 % 5.0 % 352 3 Hotels 250 — 49 18 $ 317 11.7 % 4.4 % 318 — Industrial 60 60 15 4 $ 139 5.1 % 1.9 % 133 6 Specialty 165 — — 7 $ 172 6.3 % 2.4 % 141 31 Land 74 — — 19 $ 93 3.4 % 1.3 % — 93 Total CRE $ 1,623 $ 759 $ 292 $ 50 $ 2,724 100.0 % 38.0 % $ 2,410 $ 314 • Conservative weighted average loan-to-value (LTV) 59% and debt service coverage (DSC) 1.4x • Strong sponsorship profile: 31% top-tier borrowers (top-tier borrowers represent 26% in multifamily, 39% in retail, 38% in office and 59% in hotel, respectively within each sub-portfolio) • No significant tenant concentration in CRE retail loan portfolio, where the top 15 tenants represent 22% of the total. Major tenants include recognized national and regional grocery, pharmacy, food and clothing retailers and banks • Over 45% of CRE loans have interest rate protection in the form of interest rate caps or swaps Highlights Outstanding as of June 30, 2023 ($ in millions, except %) (1) Income producing properties include non-owner occupied and multi-family residential loans
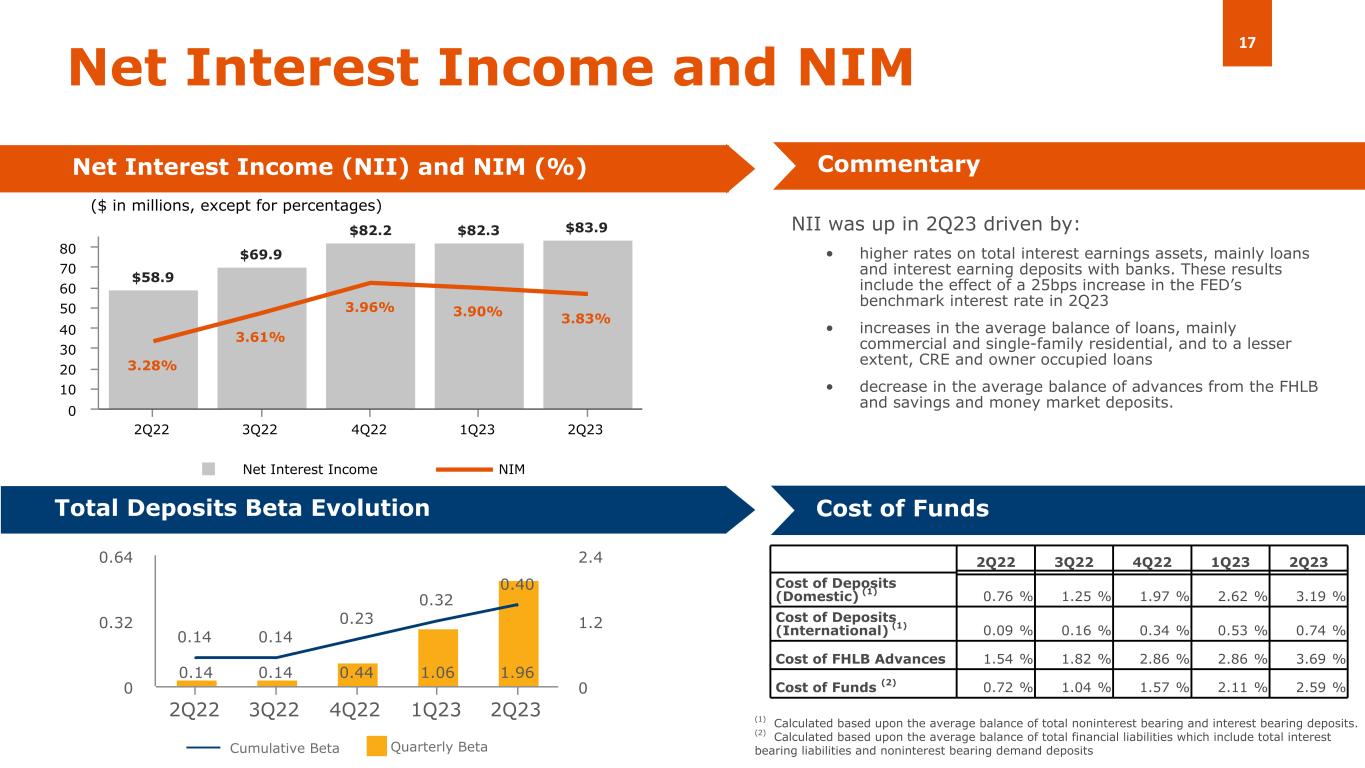
17 $58.9 $69.9 $82.2 $82.3 $83.9 3.28% 3.61% 3.96% 3.90% 3.83% Net Interest Income NIM 2Q22 3Q22 4Q22 1Q23 2Q23 0 10 20 30 40 50 60 70 80 NII was up in 2Q23 driven by: • higher rates on total interest earnings assets, mainly loans and interest earning deposits with banks. These results include the effect of a 25bps increase in the FED’s benchmark interest rate in 2Q23 • increases in the average balance of loans, mainly commercial and single-family residential, and to a lesser extent, CRE and owner occupied loans • decrease in the average balance of advances from the FHLB and savings and money market deposits. Net Interest Income and NIM Net Interest Income (NII) and NIM (%) Total Deposits Beta Evolution ($ in millions, except for percentages) Commentary 2Q22 3Q22 4Q22 1Q23 2Q23 Cost of Deposits (Domestic) (1) 0.76 % 1.25 % 1.97 % 2.62 % 3.19 % Cost of Deposits (International) (1) 0.09 % 0.16 % 0.34 % 0.53 % 0.74 % Cost of FHLB Advances 1.54 % 1.82 % 2.86 % 2.86 % 3.69 % Cost of Funds (2) 0.72 % 1.04 % 1.57 % 2.11 % 2.59 % Cost of Funds 0.14 0.14 0.44 1.06 1.96 0.14 0.14 0.23 0.32 0.40 2Q22 3Q22 4Q22 1Q23 2Q23 0 0.32 0.64 0 1.2 2.4 (1) Calculated based upon the average balance of total noninterest bearing and interest bearing deposits. (2) Calculated based upon the average balance of total financial liabilities which include total interest bearing liabilities and noninterest bearing demand depositsQuarterly BetaCumulative Beta
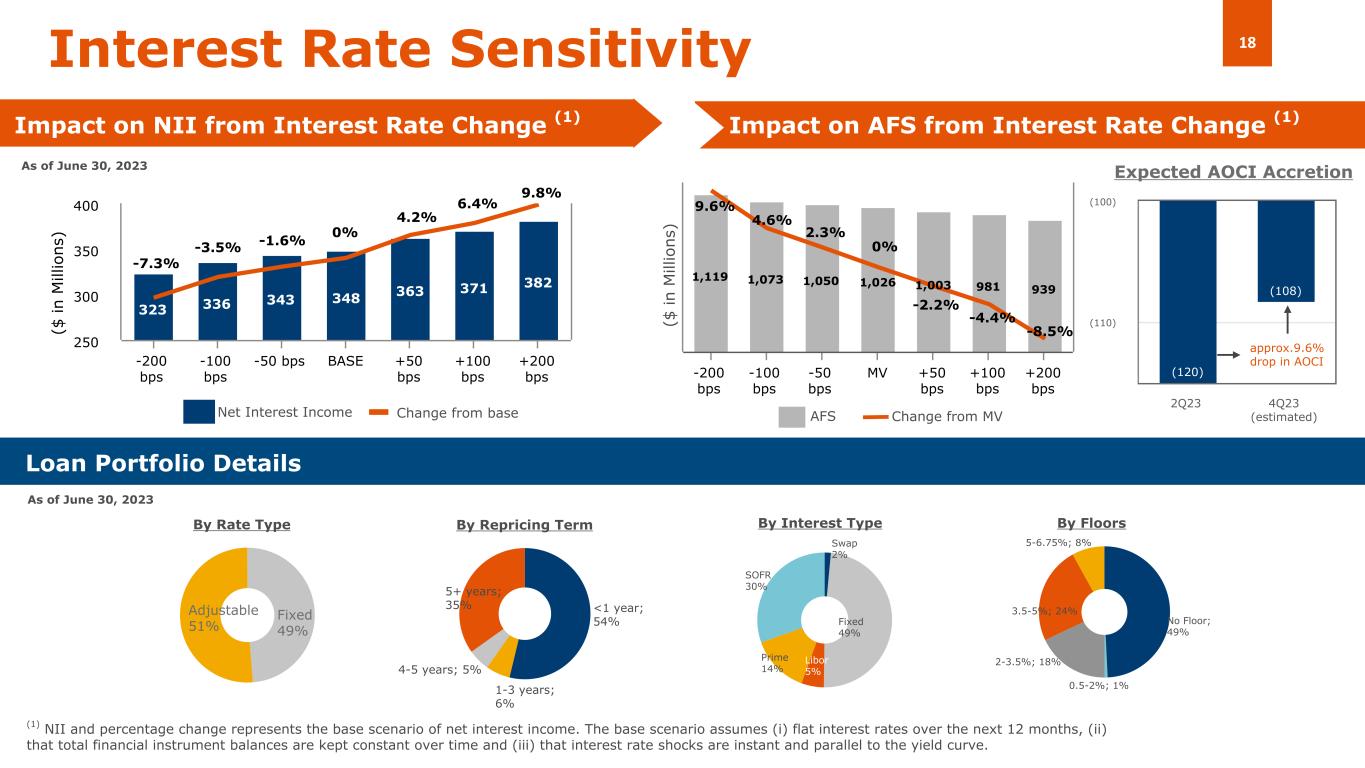
18 <1 year; 54% 1-3 years; 6% 4-5 years; 5% 5+ years; 35% 323 336 343 348 363 371 382 -200 bps -100 bps -50 bps BASE +50 bps +100 bps +200 bps 250 300 350 400 As of June 30, 2023 Fixed 49% Adjustable 51% Interest Rate Sensitivity By Interest TypeBy Rate Type By Repricing Term (1) NII and percentage change represents the base scenario of net interest income. The base scenario assumes (i) flat interest rates over the next 12 months, (ii) that total financial instrument balances are kept constant over time and (iii) that interest rate shocks are instant and parallel to the yield curve. Loan Portfolio Details Impact on NII from Interest Rate Change (1) AFSChange from base ($ in M ill io ns ) Swap 2% Fixed 49% Libor 5% Prime 14% SOFR 30% As of June 30, 2023 Impact on AFS from Interest Rate Change (1) -7.3% -3.5% 0% 6.4% 4.2% -1.6% 9.8% No Floor; 49% 0.5-2%; 1% 2-3.5%; 18% 3.5-5%; 24% 5-6.75%; 8% By Floors 1,119 1,073 1,050 1,026 1,003 981 939 -200 bps -100 bps -50 bps MV +50 bps +100 bps +200 bps ($ in M ill io ns ) 9.6% 4.6% 2.3% 0% -2.2% -4.4% -8.5% Expected AOCI Accretion Change from MVNet Interest Income (120) (108) 2Q23 4Q23 (estimated) (110) (100) approx.9.6% drop in AOCI
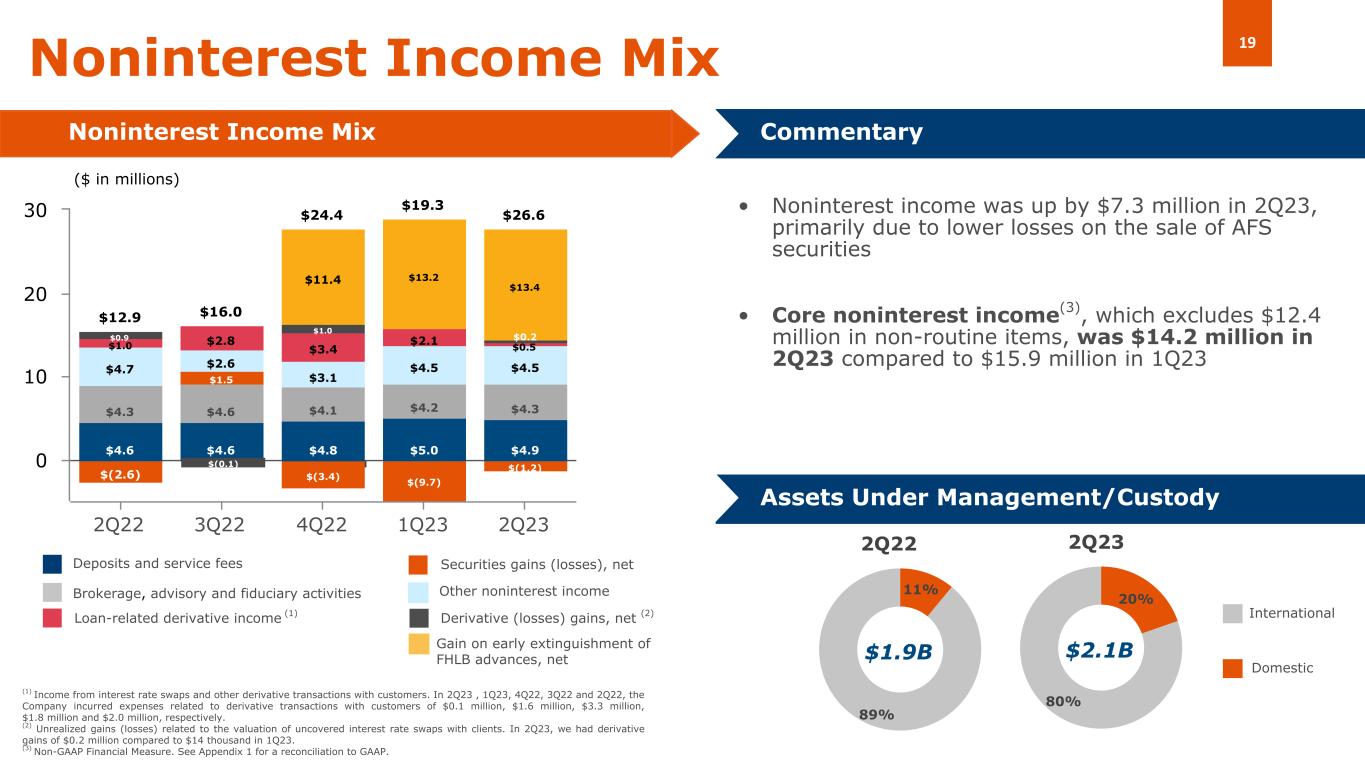
19 $12.9 $16.0 $24.4 $19.3 $26.6 $4.6 $4.6 $4.8 $5.0 $4.9 $4.3 $4.6 $4.1 $4.2 $4.3 $(2.6) $1.5 $(3.4) $(9.7) $(1.2) $4.7 $2.6 $3.1 $4.5 $4.5 $1.0 $2.8 $3.4 $2.1 $0.5 $0.9 $1.0 $11.4 $13.2 $13.4 2Q22 3Q22 4Q22 1Q23 2Q23 0 10 20 30 11% 89% 20% 80% Noninterest Income Mix Noninterest Income Mix Commentary Assets Under Management/Custody Deposits and service fees Brokerage, advisory and fiduciary activities Other noninterest income $2.1B Domestic International 2Q232Q22 $1.9B ($ in millions) Securities gains (losses), net (1) Income from interest rate swaps and other derivative transactions with customers. In 2Q23 , 1Q23, 4Q22, 3Q22 and 2Q22, the Company incurred expenses related to derivative transactions with customers of $0.1 million, $1.6 million, $3.3 million, $1.8 million and $2.0 million, respectively. (2) Unrealized gains (losses) related to the valuation of uncovered interest rate swaps with clients. In 2Q23, we had derivative gains of $0.2 million compared to $14 thousand in 1Q23. (3) Non-GAAP Financial Measure. See Appendix 1 for a reconciliation to GAAP. Loan-related derivative income (1) Derivative (losses) gains, net (2) $62.4 Gain on early extinguishment of FHLB advances, net • Noninterest income was up by $7.3 million in 2Q23, primarily due to lower losses on the sale of AFS securities • Core noninterest income(3), which excludes $12.4 million in non-routine items, was $14.2 million in 2Q23 compared to $15.9 million in 1Q23 $(0.1) $0.2
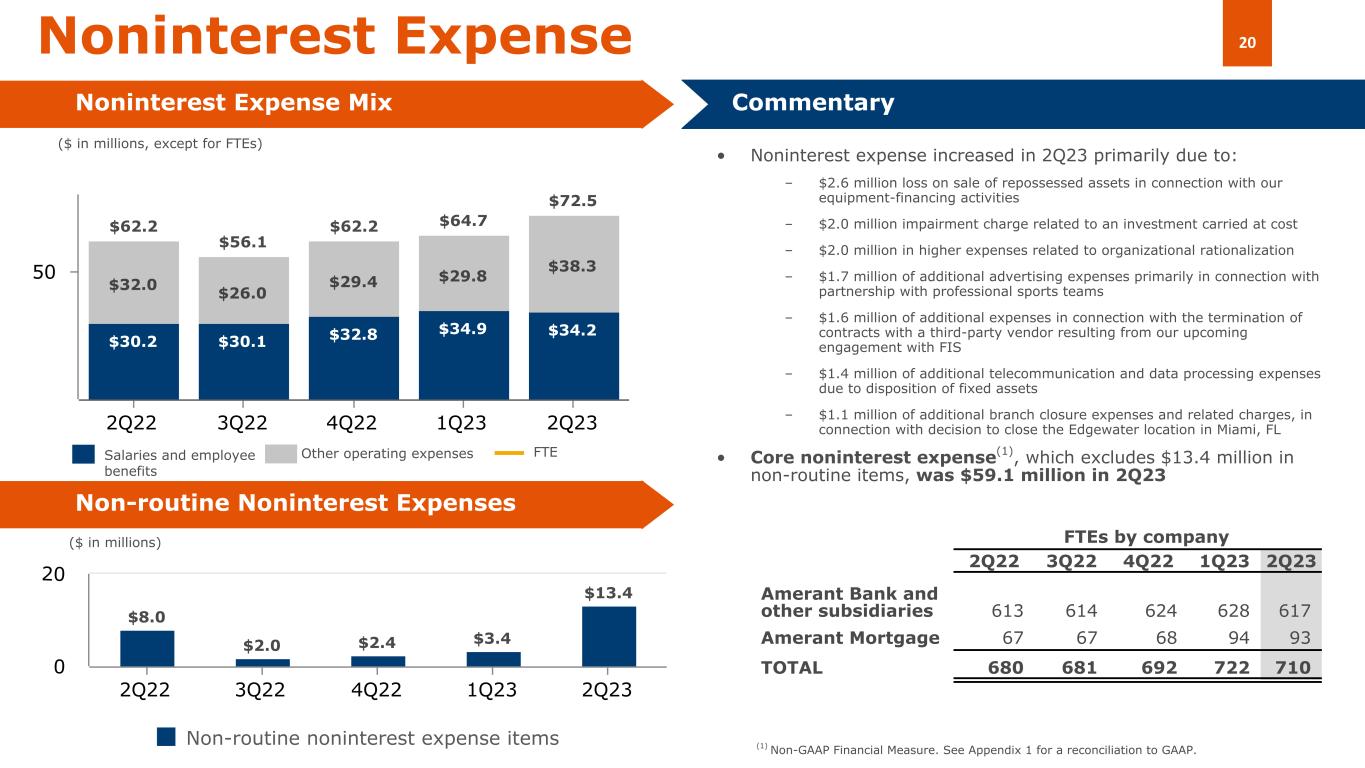
20 • Noninterest expense increased in 2Q23 primarily due to: – $2.6 million loss on sale of repossessed assets in connection with our equipment-financing activities – $2.0 million impairment charge related to an investment carried at cost – $2.0 million in higher expenses related to organizational rationalization – $1.7 million of additional advertising expenses primarily in connection with partnership with professional sports teams – $1.6 million of additional expenses in connection with the termination of contracts with a third-party vendor resulting from our upcoming engagement with FIS – $1.4 million of additional telecommunication and data processing expenses due to disposition of fixed assets – $1.1 million of additional branch closure expenses and related charges, in connection with decision to close the Edgewater location in Miami, FL • Core noninterest expense(1), which excludes $13.4 million in non-routine items, was $59.1 million in 2Q23 $62.2 $56.1 $62.2 $64.7 $72.5 $30.2 $30.1 $32.8 $34.9 $34.2 $32.0 $26.0 $29.4 $29.8 $38.3 2Q22 3Q22 4Q22 1Q23 2Q23 50 Noninterest Expense Noninterest Expense Mix Commentary Other operating expensesSalaries and employee benefits FTE ($ in millions, except for FTEs) FTEs by company 2Q22 3Q22 4Q22 1Q23 2Q23 Amerant Bank and other subsidiaries 613 614 624 628 617 Amerant Mortgage 67 67 68 94 93 TOTAL 680 681 692 722 710 (1) Non-GAAP Financial Measure. See Appendix 1 for a reconciliation to GAAP. Non-routine Noninterest Expenses $8.0 $2.0 $2.4 $3.4 $13.4 Non-routine noninterest expense items 2Q22 3Q22 4Q22 1Q23 2Q23 0 20 ($ in millions)
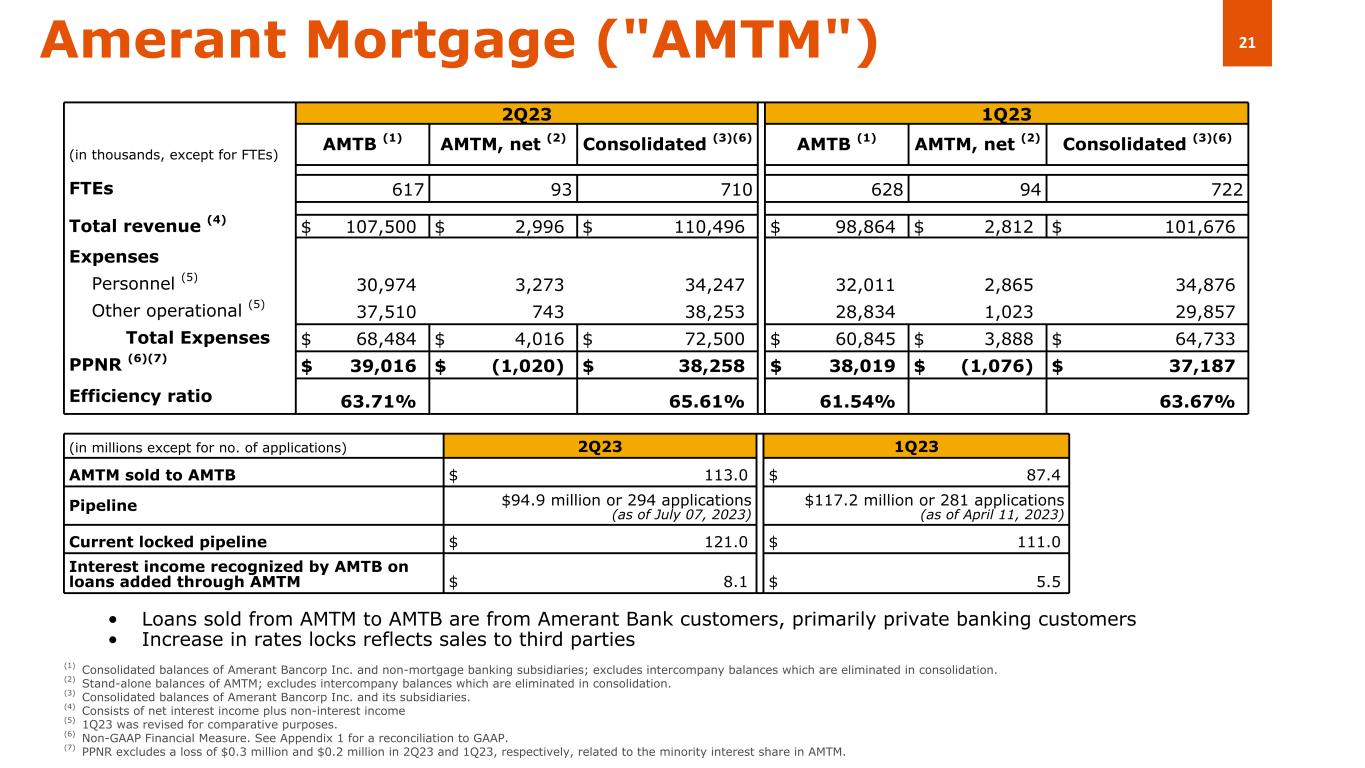
21Amerant Mortgage ("AMTM") 2Q23 1Q23 (in thousands, except for FTEs) AMTB (1) AMTM, net (2) Consolidated (3)(6) AMTB (1) AMTM, net (2) Consolidated (3)(6) FTEs 617 93 710 628 94 722 Total revenue (4) $ 107,500 $ 2,996 $ 110,496 $ 98,864 $ 2,812 $ 101,676 Expenses Personnel (5) 30,974 3,273 34,247 32,011 2,865 34,876 Other operational (5) 37,510 743 38,253 28,834 1,023 29,857 Total Expenses $ 68,484 $ 4,016 $ 72,500 $ 60,845 $ 3,888 $ 64,733 PPNR (6)(7) $ 39,016 $ (1,020) $ 38,258 $ 38,019 $ (1,076) $ 37,187 Efficiency ratio 63.71 % 65.61 % 61.54 % 63.67 % (1) Consolidated balances of Amerant Bancorp Inc. and non-mortgage banking subsidiaries; excludes intercompany balances which are eliminated in consolidation. (2) Stand-alone balances of AMTM; excludes intercompany balances which are eliminated in consolidation. (3) Consolidated balances of Amerant Bancorp Inc. and its subsidiaries. (4) Consists of net interest income plus non-interest income (5) 1Q23 was revised for comparative purposes. (6) Non-GAAP Financial Measure. See Appendix 1 for a reconciliation to GAAP. (7) PPNR excludes a loss of $0.3 million and $0.2 million in 2Q23 and 1Q23, respectively, related to the minority interest share in AMTM. (in millions except for no. of applications) 2Q23 1Q23 AMTM sold to AMTB $ 113.0 $ 87.4 Pipeline $94.9 million or 294 applications (as of July 07, 2023) $117.2 million or 281 applications (as of April 11, 2023) Current locked pipeline $ 121.0 $ 111.0 Interest income recognized by AMTB on loans added through AMTM $ 8.1 $ 5.5 • Loans sold from AMTM to AMTB are from Amerant Bank customers, primarily private banking customers • Increase in rates locks reflects sales to third parties

Closing Remarks

Supplemental Loan Portfolio Information
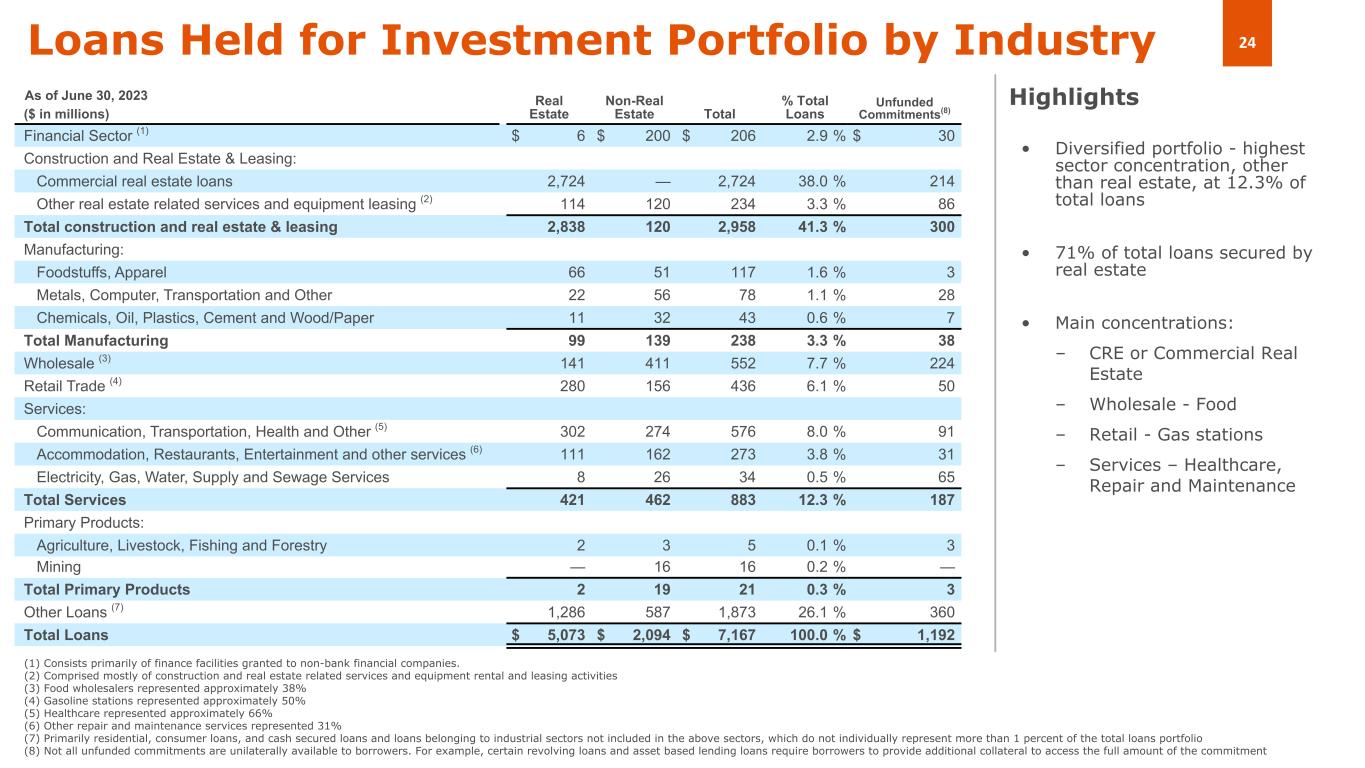
24Loans Held for Investment Portfolio by Industry • Diversified portfolio - highest sector concentration, other than real estate, at 12.3% of total loans • 71% of total loans secured by real estate • Main concentrations: – CRE or Commercial Real Estate – Wholesale - Food – Retail - Gas stations – Services – Healthcare, Repair and Maintenance Highlights (1) Consists primarily of finance facilities granted to non-bank financial companies. (2) Comprised mostly of construction and real estate related services and equipment rental and leasing activities (3) Food wholesalers represented approximately 38% (4) Gasoline stations represented approximately 50% (5) Healthcare represented approximately 66% (6) Other repair and maintenance services represented 31% (7) Primarily residential, consumer loans, and cash secured loans and loans belonging to industrial sectors not included in the above sectors, which do not individually represent more than 1 percent of the total loans portfolio (8) Not all unfunded commitments are unilaterally available to borrowers. For example, certain revolving loans and asset based lending loans require borrowers to provide additional collateral to access the full amount of the commitment ($ in millions) Real Estate Non-Real Estate Total % Total Loans Unfunded Commitments(8) Financial Sector (1) $ 6 $ 200 $ 206 2.9 % $ 30 Construction and Real Estate & Leasing: Commercial real estate loans 2,724 — 2,724 38.0 % 214 Other real estate related services and equipment leasing (2) 114 120 234 3.3 % 86 Total construction and real estate & leasing 2,838 120 2,958 41.3 % 300 Manufacturing: Foodstuffs, Apparel 66 51 117 1.6 % 3 Metals, Computer, Transportation and Other 22 56 78 1.1 % 28 Chemicals, Oil, Plastics, Cement and Wood/Paper 11 32 43 0.6 % 7 Total Manufacturing 99 139 238 3.3 % 38 Wholesale (3) 141 411 552 7.7 % 224 Retail Trade (4) 280 156 436 6.1 % 50 Services: Communication, Transportation, Health and Other (5) 302 274 576 8.0 % 91 Accommodation, Restaurants, Entertainment and other services (6) 111 162 273 3.8 % 31 Electricity, Gas, Water, Supply and Sewage Services 8 26 34 0.5 % 65 Total Services 421 462 883 12.3 % 187 Primary Products: Agriculture, Livestock, Fishing and Forestry 2 3 5 0.1 % 3 Mining — 16 16 0.2 % — Total Primary Products 2 19 21 0.3 % 3 Other Loans (7) 1,286 587 1,873 26.1 % 360 Total Loans $ 5,073 $ 2,094 $ 7,167 100.0 % $ 1,192 As of June 30, 2023
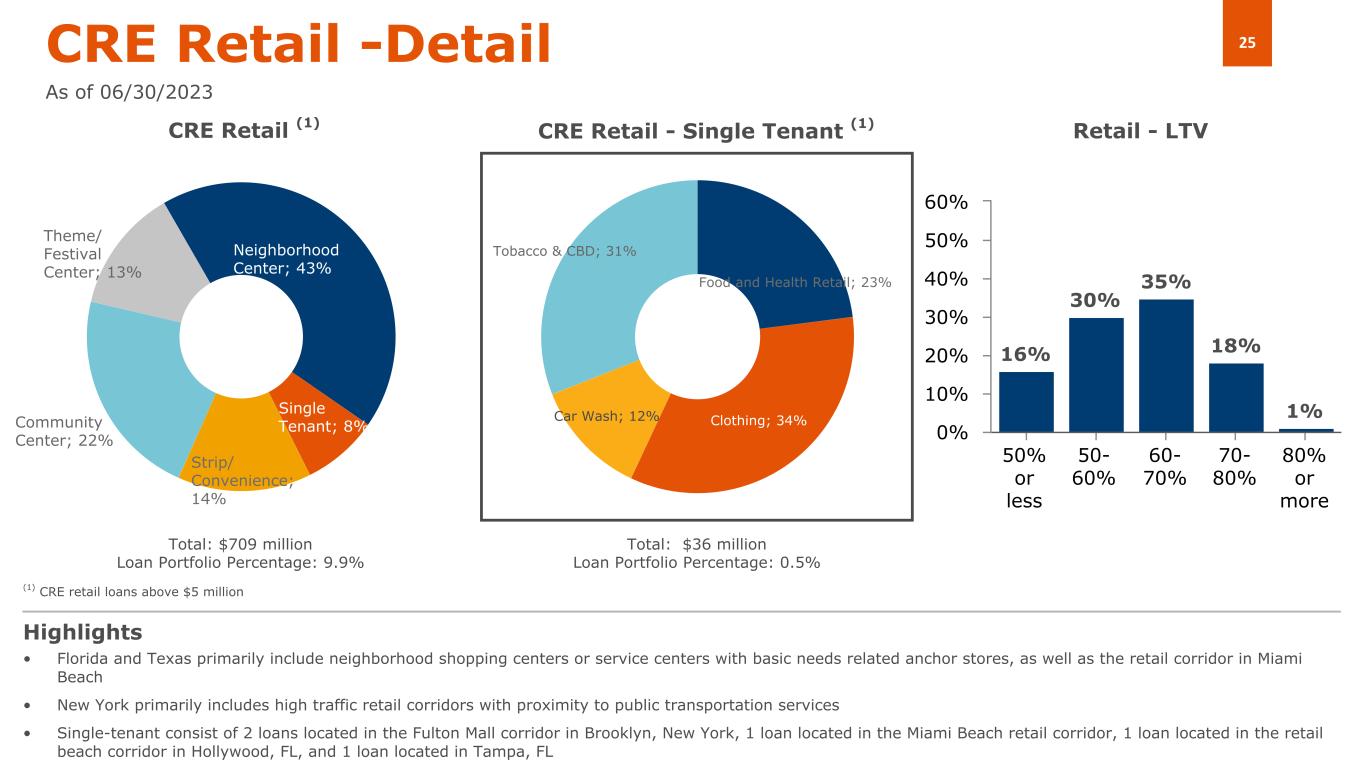
25 16% 30% 35% 18% 1% 50% or less 50- 60% 60- 70% 70- 80% 80% or more 0% 10% 20% 30% 40% 50% 60% CRE Retail -Detail As of 06/30/2023 • Florida and Texas primarily include neighborhood shopping centers or service centers with basic needs related anchor stores, as well as the retail corridor in Miami Beach • New York primarily includes high traffic retail corridors with proximity to public transportation services • Single-tenant consist of 2 loans located in the Fulton Mall corridor in Brooklyn, New York, 1 loan located in the Miami Beach retail corridor, 1 loan located in the retail beach corridor in Hollywood, FL, and 1 loan located in Tampa, FL Highlights CRE Retail (1) Retail - LTV Food and Health Retail; 23% Clothing; 34%Car Wash; 12% Tobacco & CBD; 31% CRE Retail - Single Tenant (1) (1) CRE retail loans above $5 million Total: $709 million Loan Portfolio Percentage: 9.9% Total: $36 million Loan Portfolio Percentage: 0.5% Neighborhood Center; 43% Single Tenant; 8% Strip/ Convenience; 14% Community Center; 22% Theme/ Festival Center; 13%
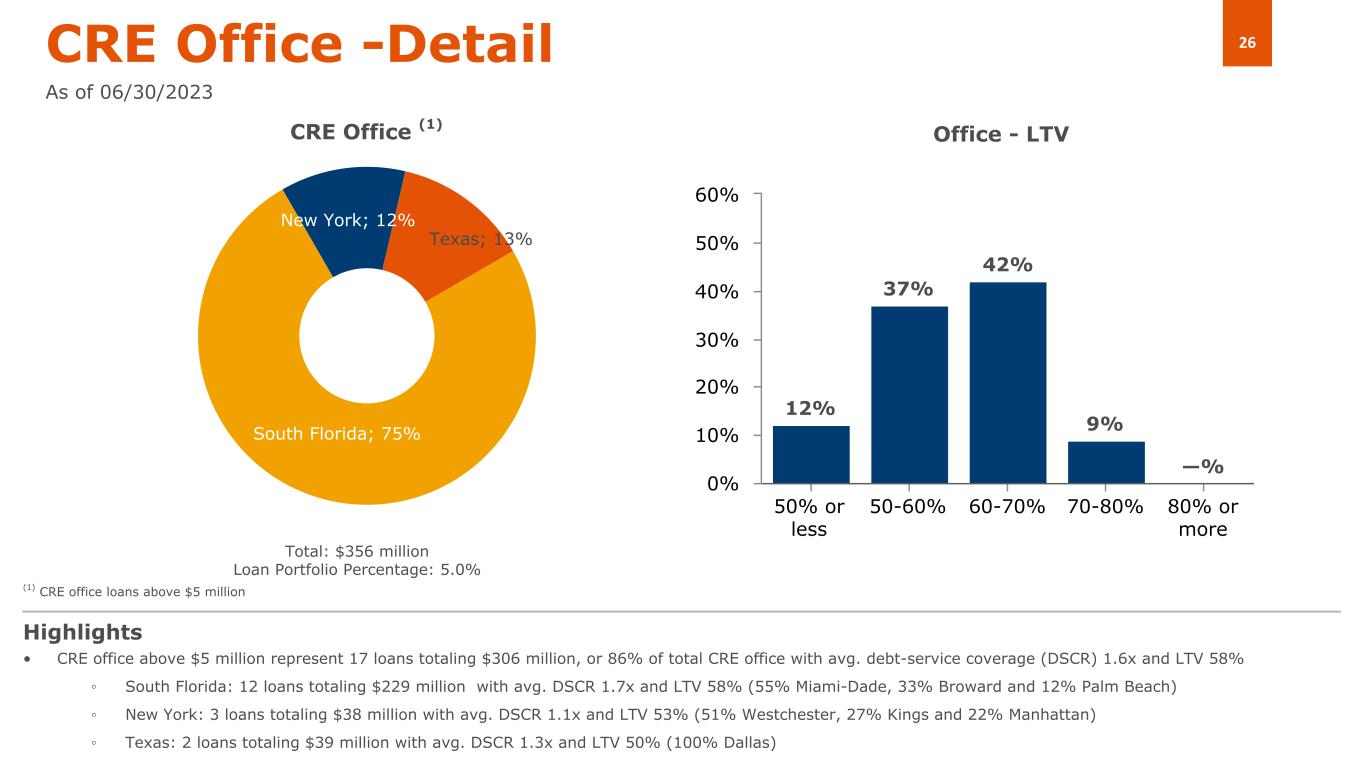
26 New York; 12% Texas; 13% South Florida; 75% 12% 37% 42% 9% —% 50% or less 50-60% 60-70% 70-80% 80% or more 0% 10% 20% 30% 40% 50% 60% CRE Office -Detail As of 06/30/2023 • CRE office above $5 million represent 17 loans totaling $306 million, or 86% of total CRE office with avg. debt-service coverage (DSCR) 1.6x and LTV 58% ◦ South Florida: 12 loans totaling $229 million with avg. DSCR 1.7x and LTV 58% (55% Miami-Dade, 33% Broward and 12% Palm Beach) ◦ New York: 3 loans totaling $38 million with avg. DSCR 1.1x and LTV 53% (51% Westchester, 27% Kings and 22% Manhattan) ◦ Texas: 2 loans totaling $39 million with avg. DSCR 1.3x and LTV 50% (100% Dallas) Highlights CRE Office (1) Office - LTV (1) CRE office loans above $5 million Total: $356 million Loan Portfolio Percentage: 5.0%
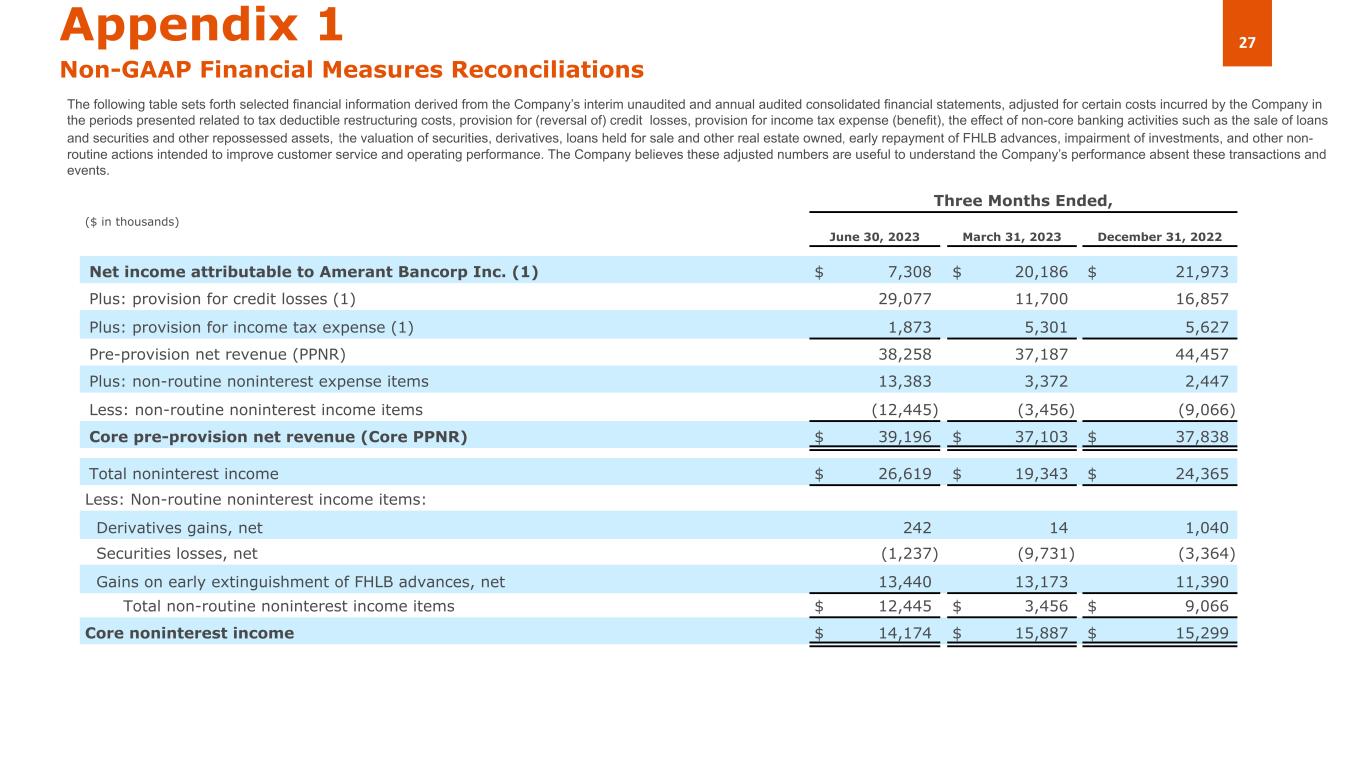
27Appendix 1 Non-GAAP Financial Measures Reconciliations The following table sets forth selected financial information derived from the Company’s interim unaudited and annual audited consolidated financial statements, adjusted for certain costs incurred by the Company in the periods presented related to tax deductible restructuring costs, provision for (reversal of) credit losses, provision for income tax expense (benefit), the effect of non-core banking activities such as the sale of loans and securities and other repossessed assets, the valuation of securities, derivatives, loans held for sale and other real estate owned, early repayment of FHLB advances, impairment of investments, and other non- routine actions intended to improve customer service and operating performance. The Company believes these adjusted numbers are useful to understand the Company’s performance absent these transactions and events. Three Months Ended, ($ in thousands) June 30, 2023 March 31, 2023 December 31, 2022 Net income attributable to Amerant Bancorp Inc. (1) $ 7,308 $ 20,186 $ 21,973 Plus: provision for credit losses (1) 29,077 11,700 16,857 Plus: provision for income tax expense (1) 1,873 5,301 5,627 Pre-provision net revenue (PPNR) 38,258 37,187 44,457 Plus: non-routine noninterest expense items 13,383 3,372 2,447 Less: non-routine noninterest income items (12,445) (3,456) (9,066) Core pre-provision net revenue (Core PPNR) $ 39,196 $ 37,103 $ 37,838 Total noninterest income $ 26,619 $ 19,343 $ 24,365 Less: Non-routine noninterest income items: Derivatives gains, net 242 14 1,040 Securities losses, net (1,237) (9,731) (3,364) Gains on early extinguishment of FHLB advances, net 13,440 13,173 11,390 Total non-routine noninterest income items $ 12,445 $ 3,456 $ 9,066 Core noninterest income $ 14,174 $ 15,887 $ 15,299
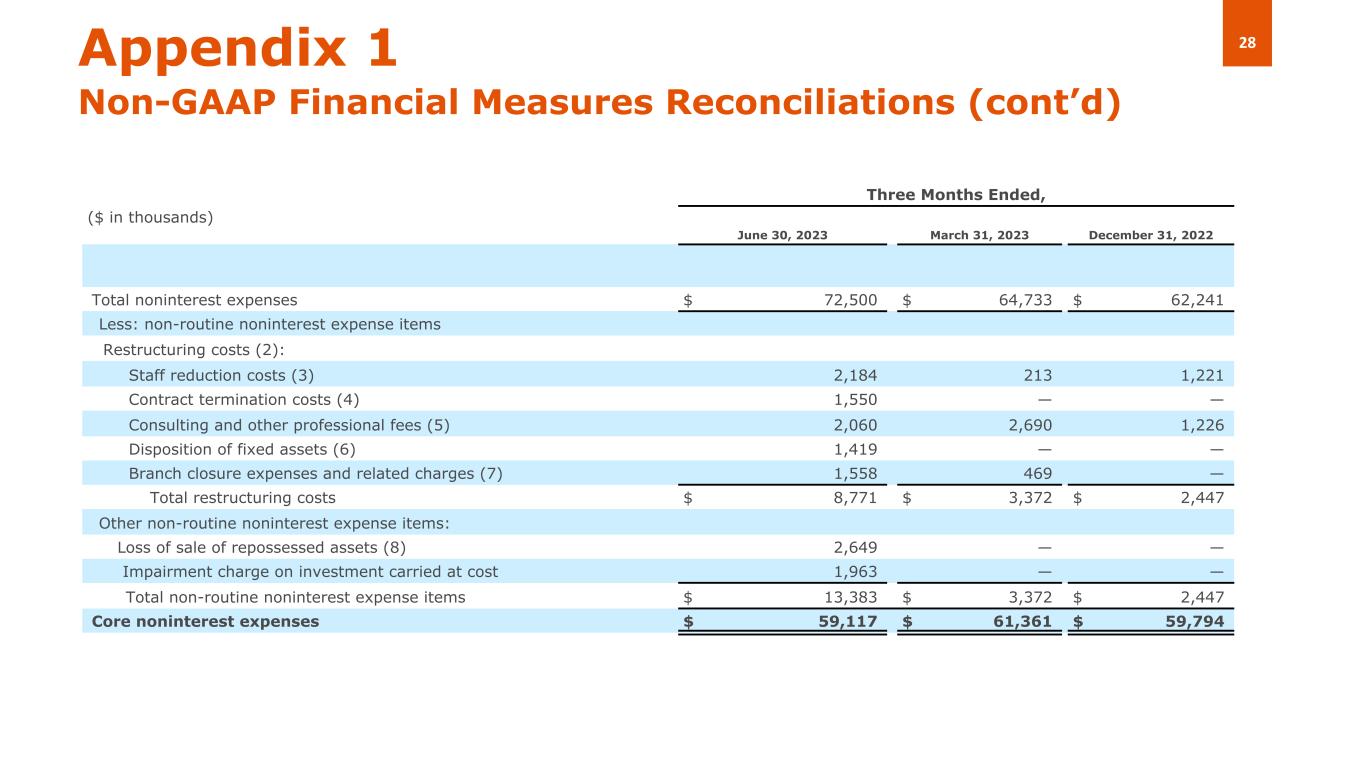
28 Three Months Ended, ($ in thousands) June 30, 2023 March 31, 2023 December 31, 2022 Total noninterest expenses $ 72,500 $ 64,733 $ 62,241 Less: non-routine noninterest expense items Restructuring costs (2): Staff reduction costs (3) 2,184 213 1,221 Contract termination costs (4) 1,550 — — Consulting and other professional fees (5) 2,060 2,690 1,226 Disposition of fixed assets (6) 1,419 — — Branch closure expenses and related charges (7) 1,558 469 — Total restructuring costs $ 8,771 $ 3,372 $ 2,447 Other non-routine noninterest expense items: Loss of sale of repossessed assets (8) 2,649 — — Impairment charge on investment carried at cost 1,963 — — Total non-routine noninterest expense items $ 13,383 $ 3,372 $ 2,447 Core noninterest expenses $ 59,117 $ 61,361 $ 59,794 Appendix 1 Non-GAAP Financial Measures Reconciliations (cont’d)
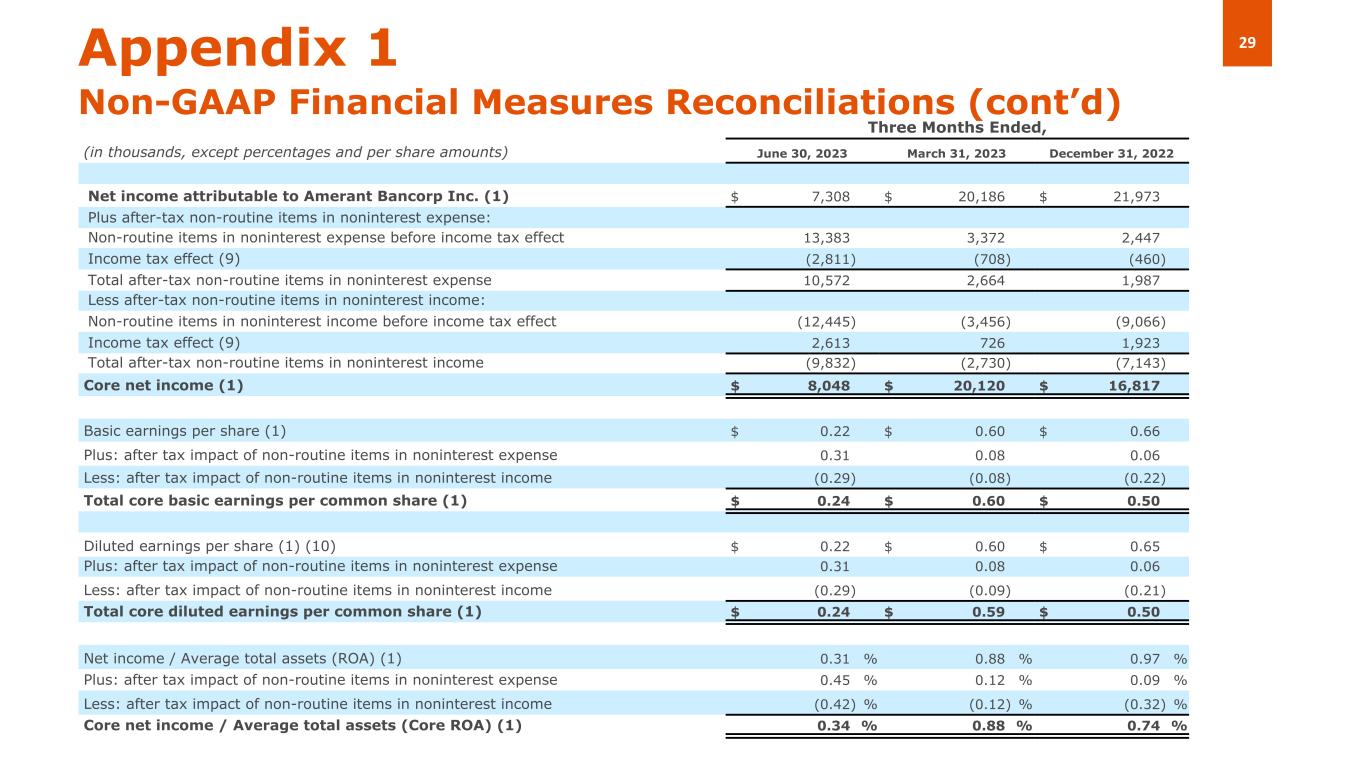
29Appendix 1 Non-GAAP Financial Measures Reconciliations (cont’d) Three Months Ended, (in thousands, except percentages and per share amounts) June 30, 2023 March 31, 2023 December 31, 2022 Net income attributable to Amerant Bancorp Inc. (1) $ 7,308 $ 20,186 $ 21,973 Plus after-tax non-routine items in noninterest expense: Non-routine items in noninterest expense before income tax effect 13,383 3,372 2,447 Income tax effect (9) (2,811) (708) (460) Total after-tax non-routine items in noninterest expense 10,572 2,664 1,987 Less after-tax non-routine items in noninterest income: Non-routine items in noninterest income before income tax effect (12,445) (3,456) (9,066) Income tax effect (9) 2,613 726 1,923 Total after-tax non-routine items in noninterest income (9,832) (2,730) (7,143) Core net income (1) $ 8,048 $ 20,120 $ 16,817 Basic earnings per share (1) $ 0.22 $ 0.60 $ 0.66 Plus: after tax impact of non-routine items in noninterest expense 0.31 0.08 0.06 Less: after tax impact of non-routine items in noninterest income (0.29) (0.08) (0.22) Total core basic earnings per common share (1) $ 0.24 $ 0.60 $ 0.50 Diluted earnings per share (1) (10) $ 0.22 $ 0.60 $ 0.65 Plus: after tax impact of non-routine items in noninterest expense 0.31 0.08 0.06 Less: after tax impact of non-routine items in noninterest income (0.29) (0.09) (0.21) Total core diluted earnings per common share (1) $ 0.24 $ 0.59 $ 0.50 Net income / Average total assets (ROA) (1) 0.31 % 0.88 % 0.97 % Plus: after tax impact of non-routine items in noninterest expense 0.45 % 0.12 % 0.09 % Less: after tax impact of non-routine items in noninterest income (0.42) % (0.12) % (0.32) % Core net income / Average total assets (Core ROA) (1) 0.34 % 0.88 % 0.74 %
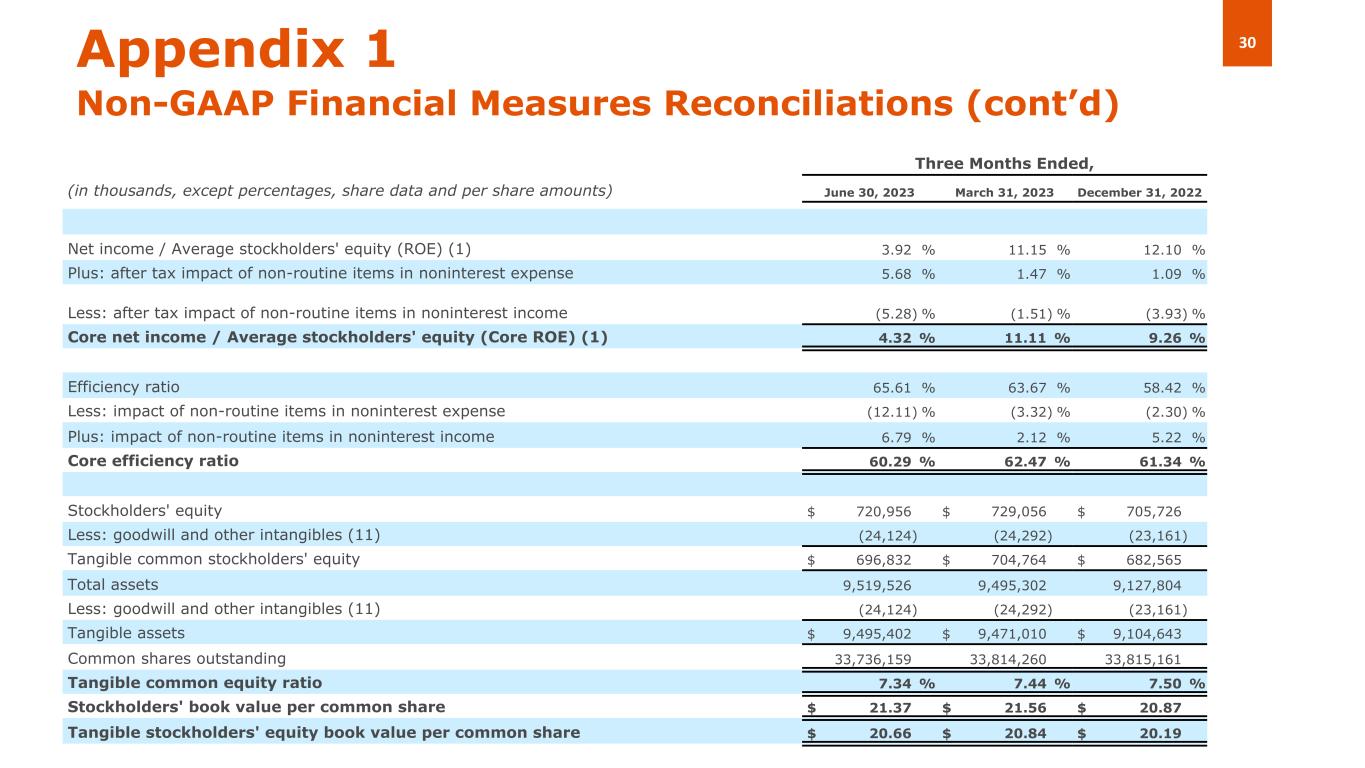
30Appendix 1 Non-GAAP Financial Measures Reconciliations (cont’d) Three Months Ended, (in thousands, except percentages, share data and per share amounts) June 30, 2023 March 31, 2023 December 31, 2022 Net income / Average stockholders' equity (ROE) (1) 3.92 % 11.15 % 12.10 % Plus: after tax impact of non-routine items in noninterest expense 5.68 % 1.47 % 1.09 % Less: after tax impact of non-routine items in noninterest income (5.28) % (1.51) % (3.93) % Core net income / Average stockholders' equity (Core ROE) (1) 4.32 % 11.11 % 9.26 % Efficiency ratio 65.61 % 63.67 % 58.42 % Less: impact of non-routine items in noninterest expense (12.11) % (3.32) % (2.30) % Plus: impact of non-routine items in noninterest income 6.79 % 2.12 % 5.22 % Core efficiency ratio 60.29 % 62.47 % 61.34 % Stockholders' equity $ 720,956 $ 729,056 $ 705,726 Less: goodwill and other intangibles (11) (24,124) (24,292) (23,161) Tangible common stockholders' equity $ 696,832 $ 704,764 $ 682,565 Total assets 9,519,526 9,495,302 9,127,804 Less: goodwill and other intangibles (11) (24,124) (24,292) (23,161) Tangible assets $ 9,495,402 $ 9,471,010 $ 9,104,643 Common shares outstanding 33,736,159 33,814,260 33,815,161 Tangible common equity ratio 7.34 % 7.44 % 7.50 % Stockholders' book value per common share $ 21.37 $ 21.56 $ 20.87 Tangible stockholders' equity book value per common share $ 20.66 $ 20.84 $ 20.19
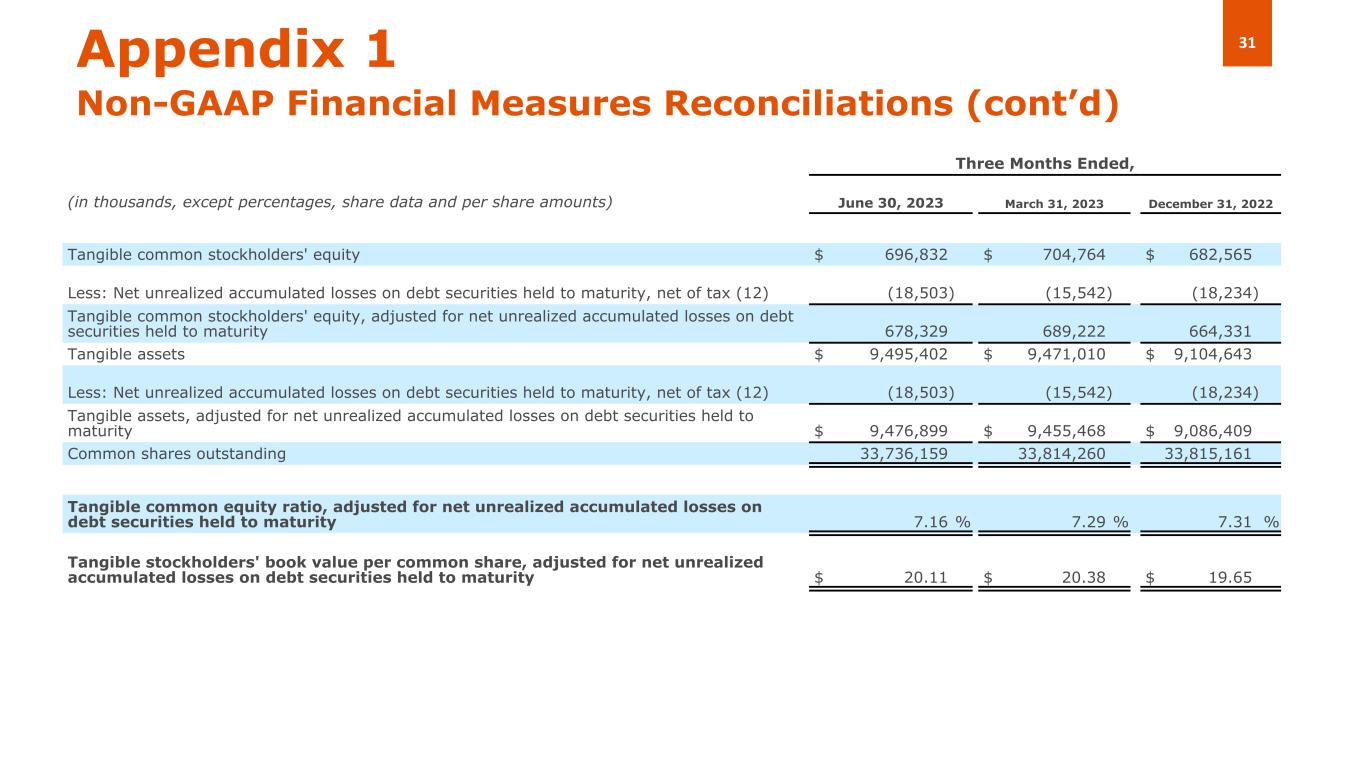
31Appendix 1 Non-GAAP Financial Measures Reconciliations (cont’d) Three Months Ended, (in thousands, except percentages, share data and per share amounts) June 30, 2023 March 31, 2023 December 31, 2022 Tangible common stockholders' equity $ 696,832 $ 704,764 $ 682,565 Less: Net unrealized accumulated losses on debt securities held to maturity, net of tax (12) (18,503) (15,542) (18,234) Tangible common stockholders' equity, adjusted for net unrealized accumulated losses on debt securities held to maturity 678,329 689,222 664,331 Tangible assets $ 9,495,402 $ 9,471,010 $ 9,104,643 Less: Net unrealized accumulated losses on debt securities held to maturity, net of tax (12) (18,503) (15,542) (18,234) Tangible assets, adjusted for net unrealized accumulated losses on debt securities held to maturity $ 9,476,899 $ 9,455,468 $ 9,086,409 Common shares outstanding 33,736,159 33,814,260 33,815,161 Tangible common equity ratio, adjusted for net unrealized accumulated losses on debt securities held to maturity 7.16 % 7.29 % 7.31 % Tangible stockholders' book value per common share, adjusted for net unrealized accumulated losses on debt securities held to maturity $ 20.11 $ 20.38 $ 19.65
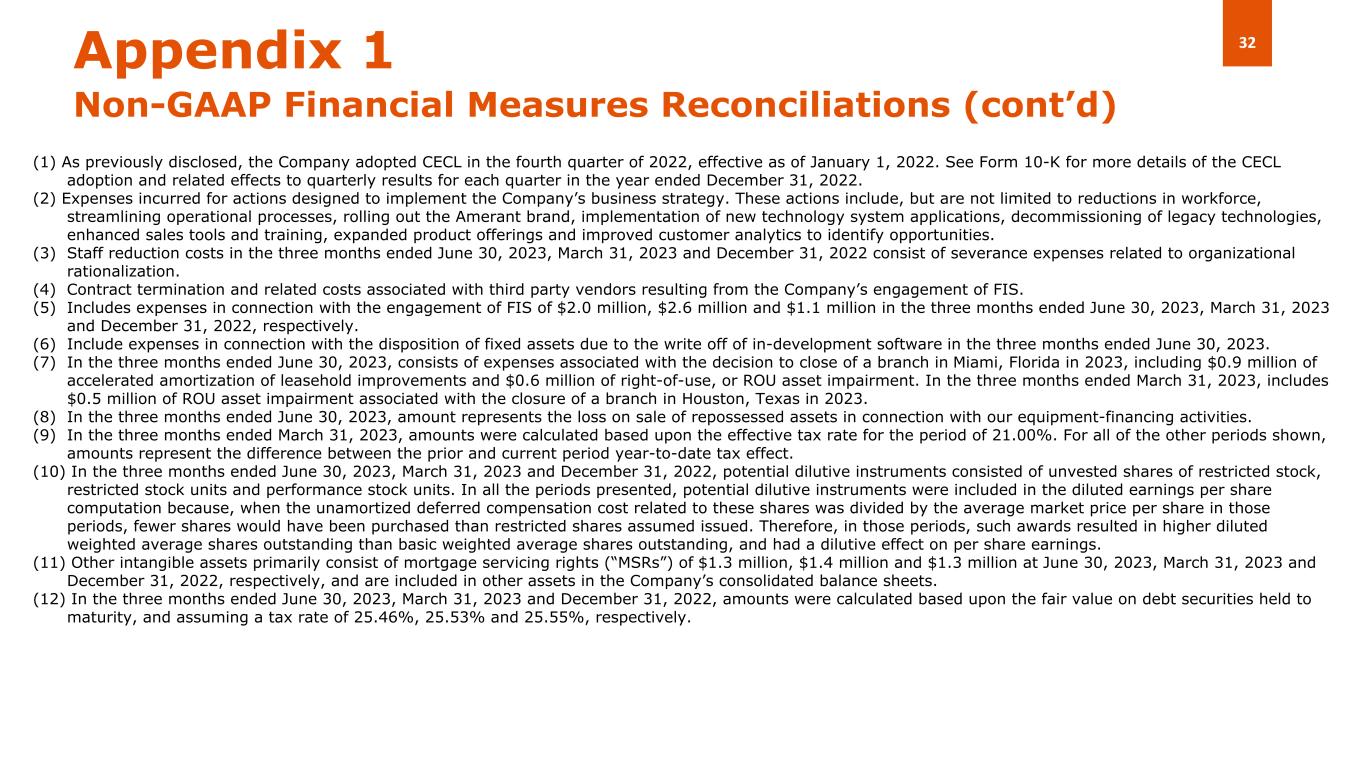
32Appendix 1 Non-GAAP Financial Measures Reconciliations (cont’d) (1) As previously disclosed, the Company adopted CECL in the fourth quarter of 2022, effective as of January 1, 2022. See Form 10-K for more details of the CECL adoption and related effects to quarterly results for each quarter in the year ended December 31, 2022. (2) Expenses incurred for actions designed to implement the Company’s business strategy. These actions include, but are not limited to reductions in workforce, streamlining operational processes, rolling out the Amerant brand, implementation of new technology system applications, decommissioning of legacy technologies, enhanced sales tools and training, expanded product offerings and improved customer analytics to identify opportunities. (3) Staff reduction costs in the three months ended June 30, 2023, March 31, 2023 and December 31, 2022 consist of severance expenses related to organizational rationalization. (4) Contract termination and related costs associated with third party vendors resulting from the Company’s engagement of FIS. (5) Includes expenses in connection with the engagement of FIS of $2.0 million, $2.6 million and $1.1 million in the three months ended June 30, 2023, March 31, 2023 and December 31, 2022, respectively. (6) Include expenses in connection with the disposition of fixed assets due to the write off of in-development software in the three months ended June 30, 2023. (7) In the three months ended June 30, 2023, consists of expenses associated with the decision to close of a branch in Miami, Florida in 2023, including $0.9 million of accelerated amortization of leasehold improvements and $0.6 million of right-of-use, or ROU asset impairment. In the three months ended March 31, 2023, includes $0.5 million of ROU asset impairment associated with the closure of a branch in Houston, Texas in 2023. (8) In the three months ended June 30, 2023, amount represents the loss on sale of repossessed assets in connection with our equipment-financing activities. (9) In the three months ended March 31, 2023, amounts were calculated based upon the effective tax rate for the period of 21.00%. For all of the other periods shown, amounts represent the difference between the prior and current period year-to-date tax effect. (10) In the three months ended June 30, 2023, March 31, 2023 and December 31, 2022, potential dilutive instruments consisted of unvested shares of restricted stock, restricted stock units and performance stock units. In all the periods presented, potential dilutive instruments were included in the diluted earnings per share computation because, when the unamortized deferred compensation cost related to these shares was divided by the average market price per share in those periods, fewer shares would have been purchased than restricted shares assumed issued. Therefore, in those periods, such awards resulted in higher diluted weighted average shares outstanding than basic weighted average shares outstanding, and had a dilutive effect on per share earnings. (11) Other intangible assets primarily consist of mortgage servicing rights (“MSRs”) of $1.3 million, $1.4 million and $1.3 million at June 30, 2023, March 31, 2023 and December 31, 2022, respectively, and are included in other assets in the Company’s consolidated balance sheets. (12) In the three months ended June 30, 2023, March 31, 2023 and December 31, 2022, amounts were calculated based upon the fair value on debt securities held to maturity, and assuming a tax rate of 25.46%, 25.53% and 25.55%, respectively.
Thank you Investor Relations InvestorRelations@amerantbank.com