
amerantbank.com Strategic Sale of Houston Franchise April 17, 2024 1
Important Notices and Disclaimers 2 Forward-Looking Statements This presentation contains “forward-looking statements” including statements with respect to the Amerant Bancorp Inc.’s (the “Company’s”) objectives, expectations and intentions and other statements that are not historical facts. All statements other than statements of historical fact are statements that could be forward-looking statements. Forward-looking statements include the Company’s strategic rationale for, and proposed benefits of, the Company’s sale of its Houston franchise (the “Sale Transaction”), the Company’s ability to consummate the Sale Transaction on terms acceptable to the Company, if at all, the Company’s expected use of proceeds from the Sale Transaction, the Company’s business strategy following the consummation of the Sale Transaction, and the Company’s growth initiatives in Florida, including expectations regarding the labor market in Florida. You can identify these forward-looking statements through our use of words such as “may,” “will,” “anticipate,” “assume,” “should,” “indicate,” “would,” “believe,” “contemplate,” “expect,” “estimate,” “continue,” “plan,” “point to,” “project,” “could,” “intend,” “target,” “goals,” “outlooks,” “modeled,” “dedicated,” “create,” and other similar words and expressions of the future. Forward-looking statements, including those relating to our beliefs, plans, objectives, goals, expectations, anticipations, estimates and intentions, involve risks, uncertainties and other factors, which may be beyond our control, and which may cause the Company’s actual results, performance, achievements, or financial condition to be materially different from future results, performance, achievements, or financial condition expressed or implied by such forward-looking statements. You should not rely on any forward-looking statements as predictions of future events. You should not expect us to update any forward-looking statements, except as required by law. All written or oral forward-looking statements attributable to us are expressly qualified in their entirety by this cautionary notice, together with those risks and uncertainties described in “Risk factors” in our annual report on Form 10-K for the fiscal year ended December 31, 2023 filed on March 7, 2024 (the "Form 10-K"), our quarterly report on Form 10-Q, and in our other filings with the U.S. Securities and Exchange Commission (the “SEC”), which are available at the SEC’s website www.sec.gov. Non-GAAP Financial Measures The Company supplements its financial results that are determined in accordance with accounting principles generally accepted in the United States of America (“GAAP”) with non-GAAP financial measures, such as tangible common equity ("TCE"), tangible assets (“TA”) and tangible book value per share ("TBVPS"). This supplemental information is not required by or is not presented in accordance with GAAP. The Company refers to these financial measures and ratios as “non-GAAP financial measures” and they should not be considered in isolation or as a substitute for the GAAP measures presented herein. We use certain non-GAAP financial measures, including those mentioned above, both to explain our results to shareholders and the investment community and in the internal evaluation and management of our businesses. Our management believes that these non-GAAP financial measures and the information they provide are useful to investors since these measures permit investors to view our performance using the same tools that our management uses to evaluate our past performance and prospects for future performance. While we believe that these non-GAAP financial measures are useful in evaluating our performance, this information should be considered as supplemental and not as a substitute for or superior to the related financial information prepared in accordance with GAAP. Additionally, these non-GAAP financial measures may differ from similar measures presented by other companies. Page 13 in the appendix reconciles these non-GAAP financial measures to reported GAAP results.
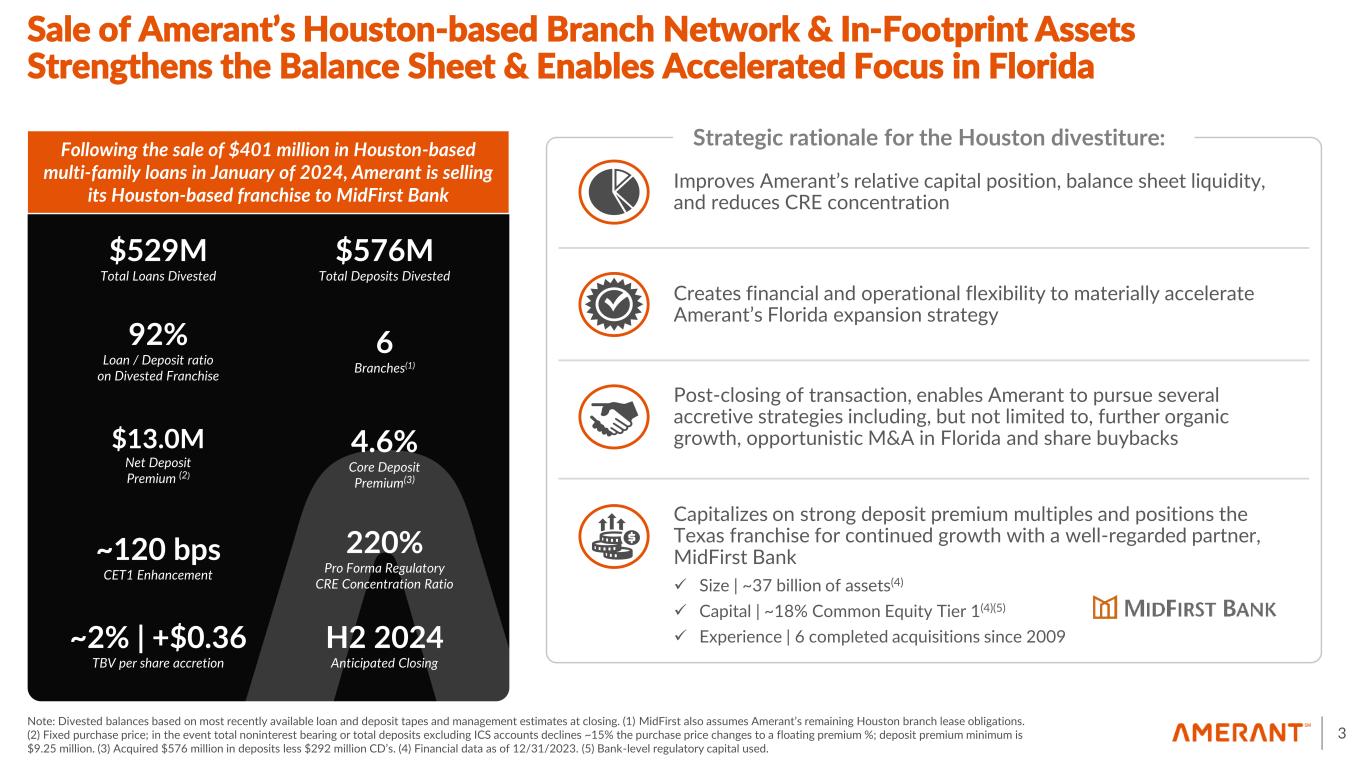
Sale of Amerant’s Houston-based Branch Network & In-Footprint Assets Strengthens the Balance Sheet & Enables Accelerated Focus in Florida 3 Note: Divested balances based on most recently available loan and deposit tapes and management estimates at closing. (1) MidFirst also assumes Amerant’s remaining Houston branch lease obligations. (2) Fixed purchase price; in the event total noninterest bearing or total deposits excluding ICS accounts declines ~15% the purchase price changes to a floating premium %; deposit premium minimum is $9.25 million. (3) Acquired $576 million in deposits less $292 million CD’s. (4) Financial data as of 12/31/2023. (5) Bank-level regulatory capital used. Strategic rationale for the Houston divestiture: Post-closing of transaction, enables Amerant to pursue several accretive strategies including, but not limited to, further organic growth, opportunistic M&A in Florida and share buybacks Capitalizes on strong deposit premium multiples and positions the Texas franchise for continued growth with a well-regarded partner, MidFirst Bank ✓ Size | ~37 billion of assets(4) ✓ Capital | ~18% Common Equity Tier 1(4)(5) ✓ Experience | 6 completed acquisitions since 2009 Improves Amerant’s relative capital position, balance sheet liquidity, and reduces CRE concentration Creates financial and operational flexibility to materially accelerate Amerant’s Florida expansion strategy Following the sale of $401 million in Houston-based multi-family loans in January of 2024, Amerant is selling its Houston-based franchise to MidFirst Bank $529M Total Loans Divested $576M Total Deposits Divested 92% Loan / Deposit ratio on Divested Franchise 6 Branches(1) $13.0M Net Deposit Premium (2) 4.6% Core Deposit Premium(3) ~120 bps CET1 Enhancement ~2% | +$0.36 TBV per share accretion H2 2024 Anticipated Closing 220% Pro Forma Regulatory CRE Concentration Ratio
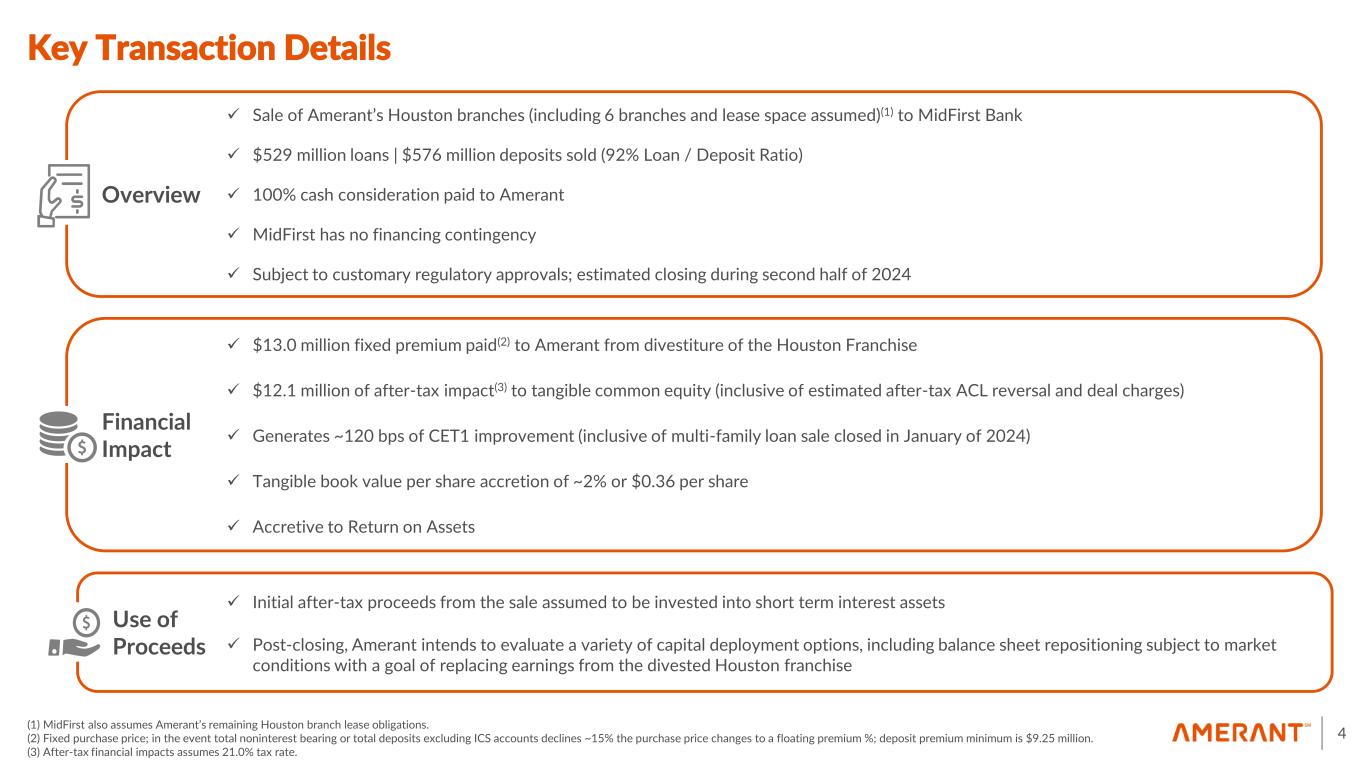
Key Transaction Details (1) MidFirst also assumes Amerant’s remaining Houston branch lease obligations. (2) Fixed purchase price; in the event total noninterest bearing or total deposits excluding ICS accounts declines ~15% the purchase price changes to a floating premium %; deposit premium minimum is $9.25 million. (3) After-tax financial impacts assumes 21.0% tax rate. 4 Use of Proceeds ✓ Initial after-tax proceeds from the sale assumed to be invested into short term interest assets ✓ Post-closing, Amerant intends to evaluate a variety of capital deployment options, including balance sheet repositioning subject to market conditions with a goal of replacing earnings from the divested Houston franchise ✓ Tangible book value per share accretion of ~2% or $0.36 per share Financial Impact ✓ $13.0 million fixed premium paid(2) to Amerant from divestiture of the Houston Franchise ✓ $12.1 million of after-tax impact(3) to tangible common equity (inclusive of estimated after-tax ACL reversal and deal charges) ✓ Generates ~120 bps of CET1 improvement (inclusive of multi-family loan sale closed in January of 2024) Overview ✓ Sale of Amerant’s Houston branches (including 6 branches and lease space assumed)(1) to MidFirst Bank ✓ 100% cash consideration paid to Amerant ✓ MidFirst has no financing contingency ✓ Subject to customary regulatory approvals; estimated closing during second half of 2024 ✓ $529 million loans | $576 million deposits sold (92% Loan / Deposit Ratio) ✓ Accretive to Return on Assets
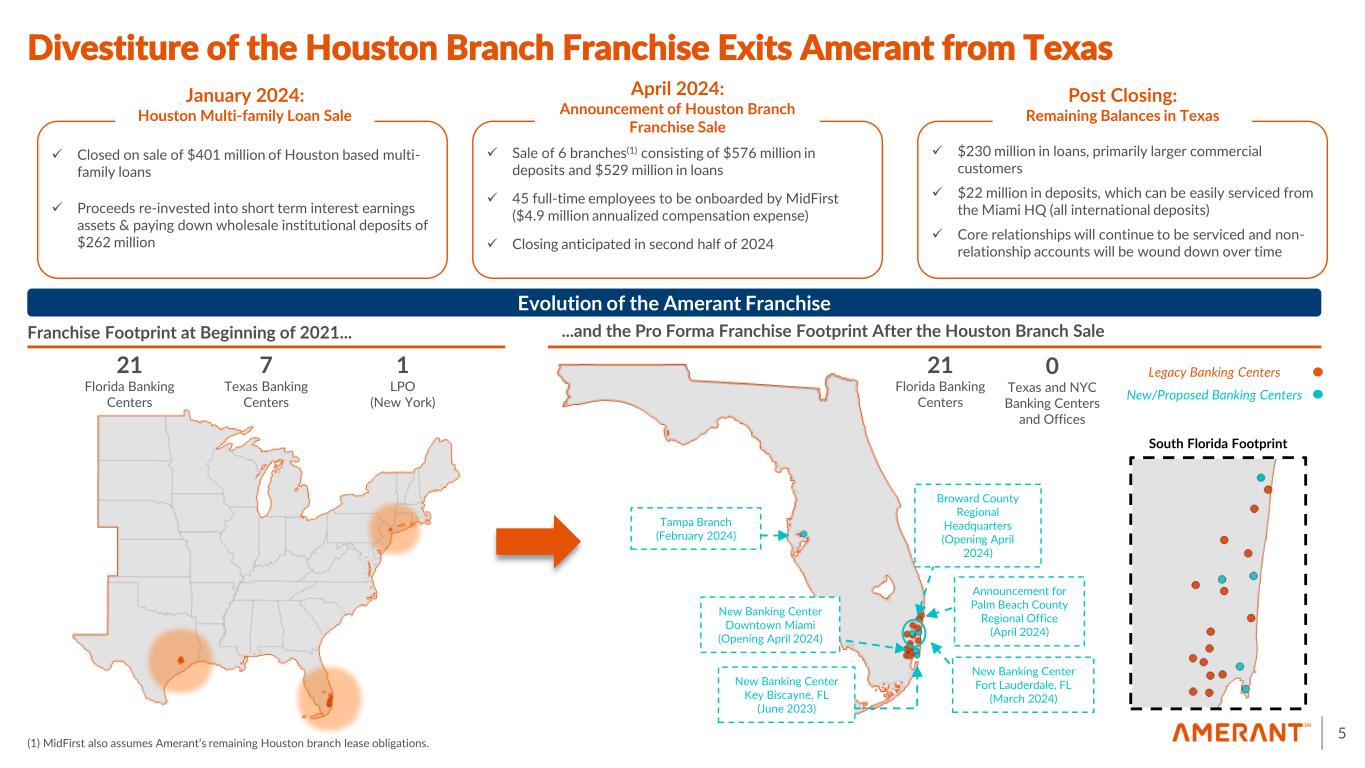
21 Florida Banking Centers 0 Texas and NYC Banking Centers and Offices ...and the Pro Forma Franchise Footprint After the Houston Branch SaleFranchise Footprint at Beginning of 2021... 21 Florida Banking Centers 7 Texas Banking Centers 1 LPO (New York) Divestiture of the Houston Branch Franchise Exits Amerant from Texas Evolution of the Amerant Franchise (1) MidFirst also assumes Amerant’s remaining Houston branch lease obligations. 5 ✓ $230 million in loans, primarily larger commercial customers ✓ $22 million in deposits, which can be easily serviced from the Miami HQ (all international deposits) ✓ Core relationships will continue to be serviced and non- relationship accounts will be wound down over time ✓ Closed on sale of $401 million of Houston based multi- family loans ✓ Proceeds re-invested into short term interest earnings assets & paying down wholesale institutional deposits of $262 million January 2024: Houston Multi-family Loan Sale ✓ Sale of 6 branches(1) consisting of $576 million in deposits and $529 million in loans ✓ 45 full-time employees to be onboarded by MidFirst ($4.9 million annualized compensation expense) ✓ Closing anticipated in second half of 2024 April 2024: Announcement of Houston Branch Franchise Sale Post Closing: Remaining Balances in Texas New Banking Center Fort Lauderdale, FL (March 2024) New Banking Center Key Biscayne, FL (June 2023) New Banking Center Downtown Miami (Opening April 2024) Legacy Banking Centers New/Proposed Banking Centers Broward County Regional Headquarters (Opening April 2024) Announcement for Palm Beach County Regional Office (April 2024) Tampa Branch (February 2024) South Florida Footprint
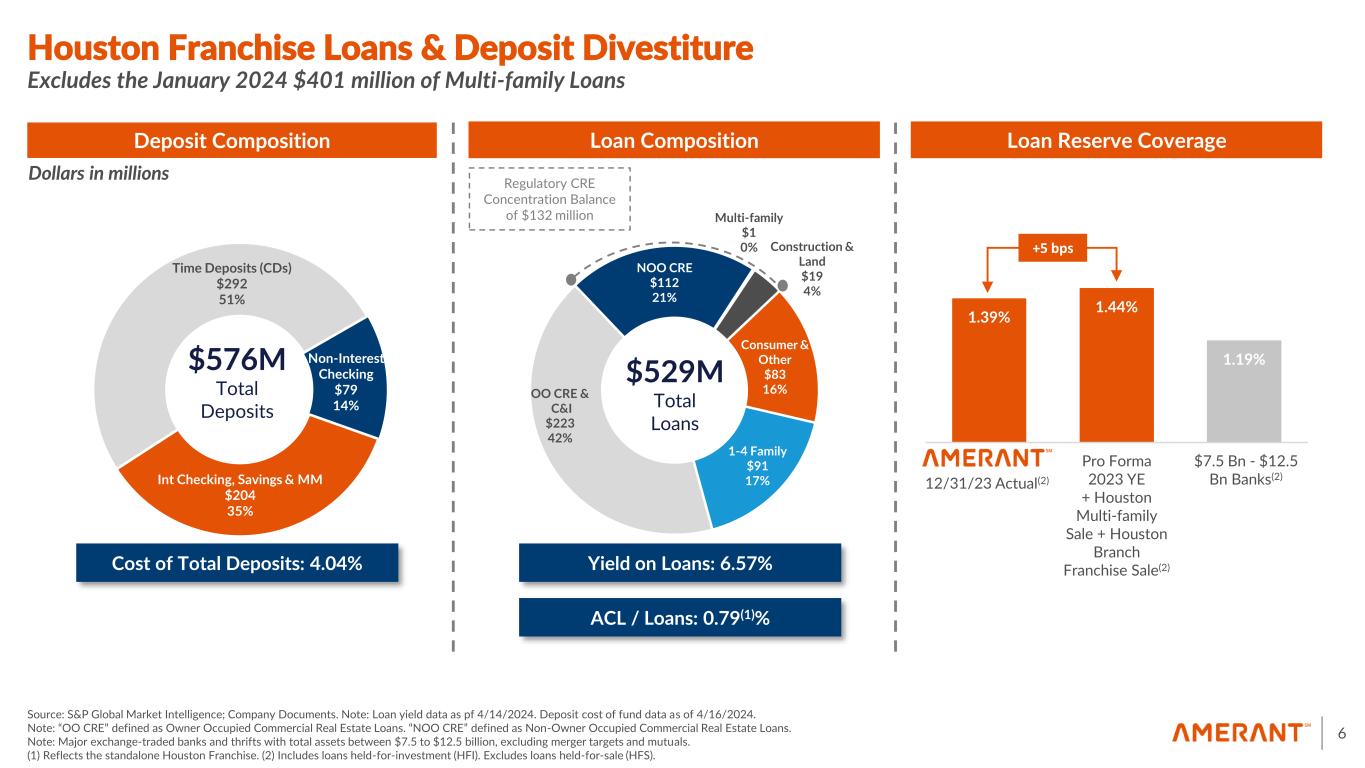
Houston Franchise Loans & Deposit Divestiture 6 Source: S&P Global Market Intelligence; Company Documents. Note: Loan yield data as pf 4/14/2024. Deposit cost of fund data as of 4/16/2024. Note: “OO CRE” defined as Owner Occupied Commercial Real Estate Loans. “NOO CRE” defined as Non-Owner Occupied Commercial Real Estate Loans. Note: Major exchange-traded banks and thrifts with total assets between $7.5 to $12.5 billion, excluding merger targets and mutuals. (1) Reflects the standalone Houston Franchise. (2) Includes loans held-for-investment (HFI). Excludes loans held-for-sale (HFS). Excludes the January 2024 $401 million of Multi-family Loans Non-Interest Checking $79 14% Int Checking, Savings & MM $204 35% Time Deposits (CDs) $292 51% $576M Total Deposits Dollars in millions Cost of Total Deposits: 4.04% Deposit Composition Yield on Loans: 6.57% Loan Composition $529M Total Loans 0 Regulatory CRE Concentration Balance of $132 million ACL / Loans: 0.79(1)% Loan Reserve Coverage 1.39% 1.44% 1.19% Standalone 2023YE Pro Forma $7.5B - $12.5 Bn Banks Pro Forma 2023 YE + Houston Multi-family Sale + Houston Branch Franchise Sale(2) 12/31/23 Actual(2) $7.5 Bn - $12.5 Bn Banks(2) +5 bps 1-4 Family $91 17% OO CRE & C&I $223 42% NOO CRE $112 21% Multi-family $1 0% Construction & Land $19 4% Consumer & Other $83 16%
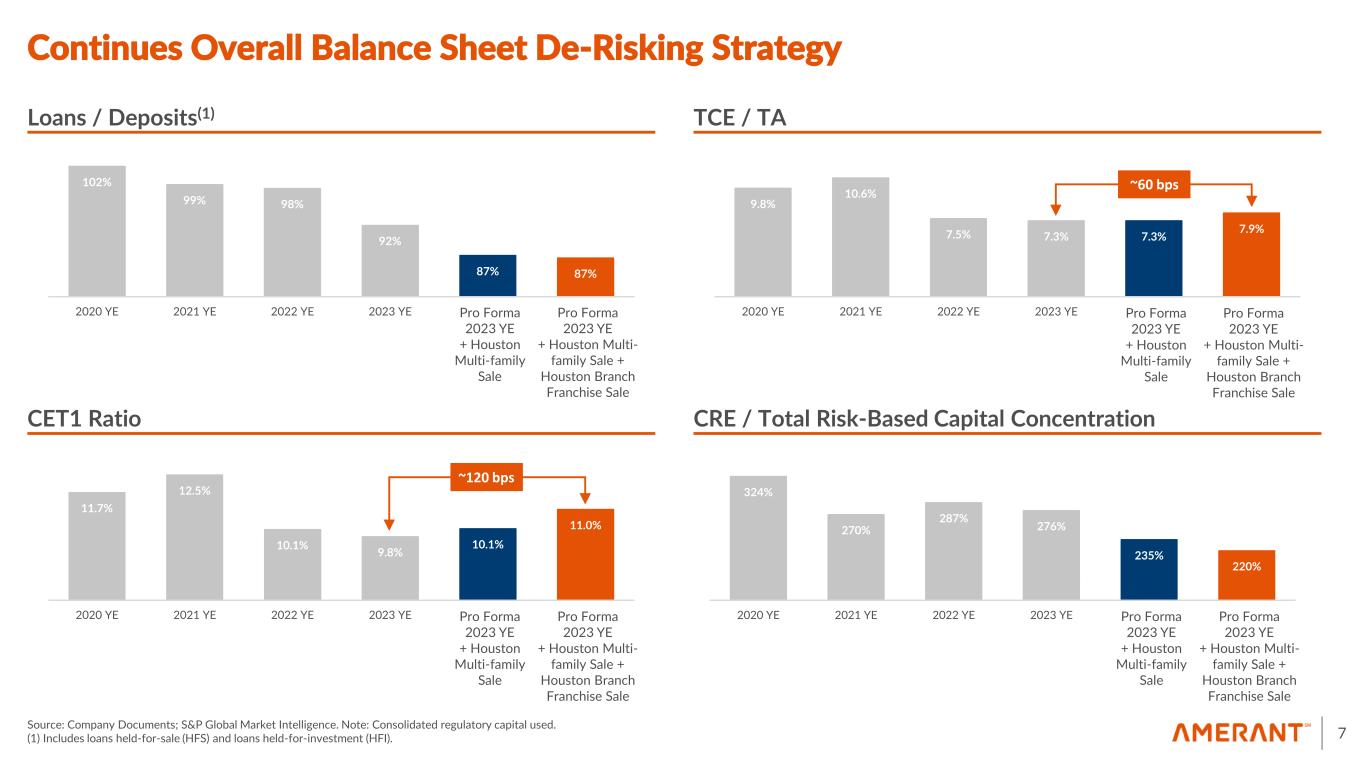
9.8% 10.6% 7.5% 7.3% 7.3% 7.9% 2020 YE 2021 YE 2022 YE 2023 YE Pro Forma Pro Forma 324% 270% 287% 276% 235% 220% 2020 YE 2021 YE 2022 YE 2023 YE Pro Forma Pro Forma 102% 99% 98% 92% 87% 87% 2020 YE 2021 YE 2022 YE 2023 YE Pro Forma Pro Forma 11.7% 12.5% 10.1% 9.8% 10.1% 11.0% 2020 YE 2021 YE 2022 YE 2023 YE Pro Forma Pro Forma Continues Overall Balance Sheet De-Risking Strategy Source: Company Documents; S&P Global Market Intelligence. Note: Consolidated regulatory capital used. (1) Includes loans held-for-sale (HFS) and loans held-for-investment (HFI). 7 Loans / Deposits(1) TCE / TA CRE / Total Risk-Based Capital ConcentrationCET1 Ratio ~120 bps ~60 bps r rma 2023 YE + Houston Multi-family Sale r rma 2023 YE + Houston Multi- family Sale + Houston Branch Franchise Sale r rma 2023 YE + Houston Multi-family Sale r rma 2023 YE + Houston Multi- family Sale + Houston Branch Franchise Sale r rma 2023 YE + Houston Multi-family Sale r rma 2023 YE + Houston Multi- family Sale + Houston Branch Franchise Sale r rma 2023 YE + Houston Multi-family Sale r rma 2023 YE + Houston Multi- family Sale + Houston Branch Franchise Sale
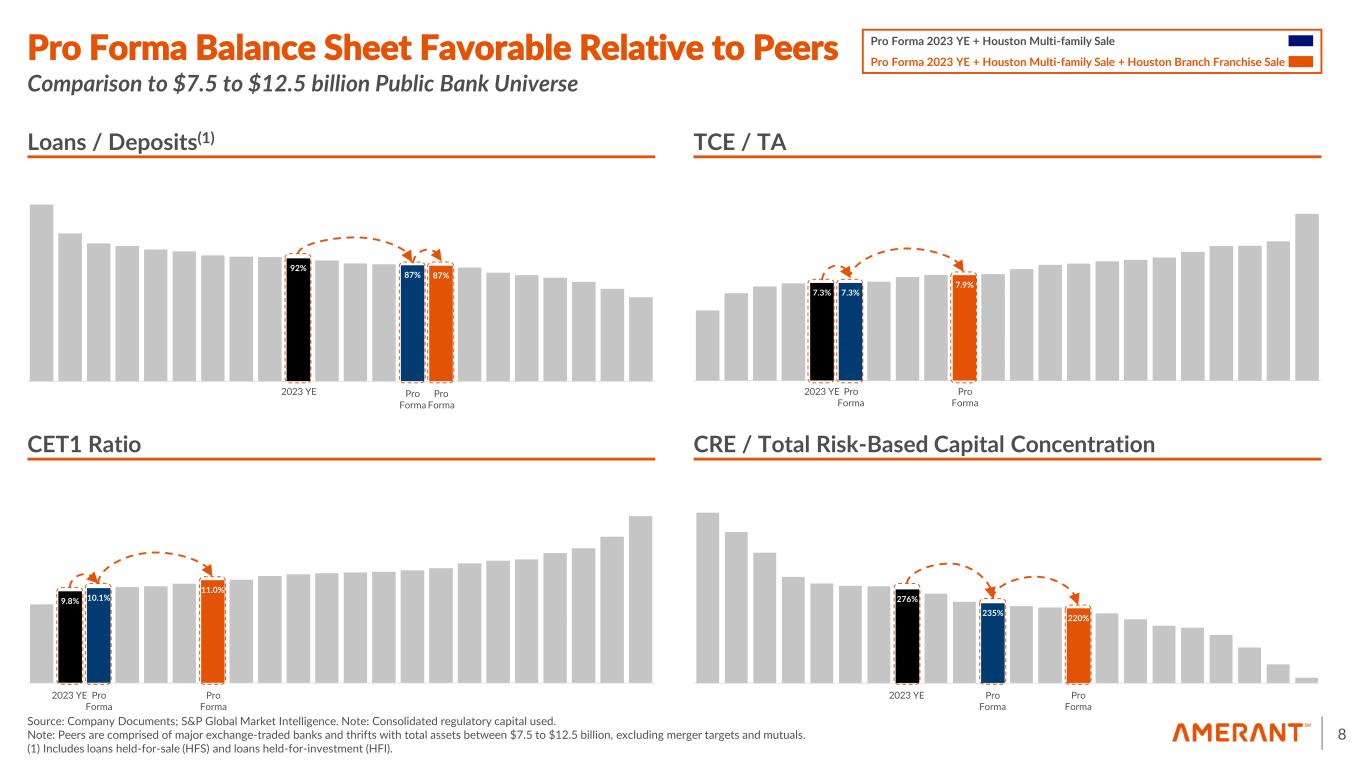
276% 235% 220% 9.8% 10.1% 11.0% 7.3% 7.3% 7.9% 92% 87% 87% Pro Forma Pro Forma Balance Sheet Favorable Relative to Peers Source: Company Documents; S&P Global Market Intelligence. Note: Consolidated regulatory capital used. Note: Peers are comprised of major exchange-traded banks and thrifts with total assets between $7.5 to $12.5 billion, excluding merger targets and mutuals. (1) Includes loans held-for-sale (HFS) and loans held-for-investment (HFI). 8 Comparison to $7.5 to $12.5 billion Public Bank Universe Loans / Deposits(1) TCE / TA CRE / Total Risk-Based Capital ConcentrationCET1 Ratio Pro Forma 2023 YE + Houston Multi-family Sale Pro Forma 2023 YE + Houston Multi-family Sale + Houston Branch Franchise Sale 2023 YE Pro Forma Pro Forma 2023 YE Pro Forma 2023 YE Pro Forma Pro Forma 2023 YE Pro Forma Pro Forma
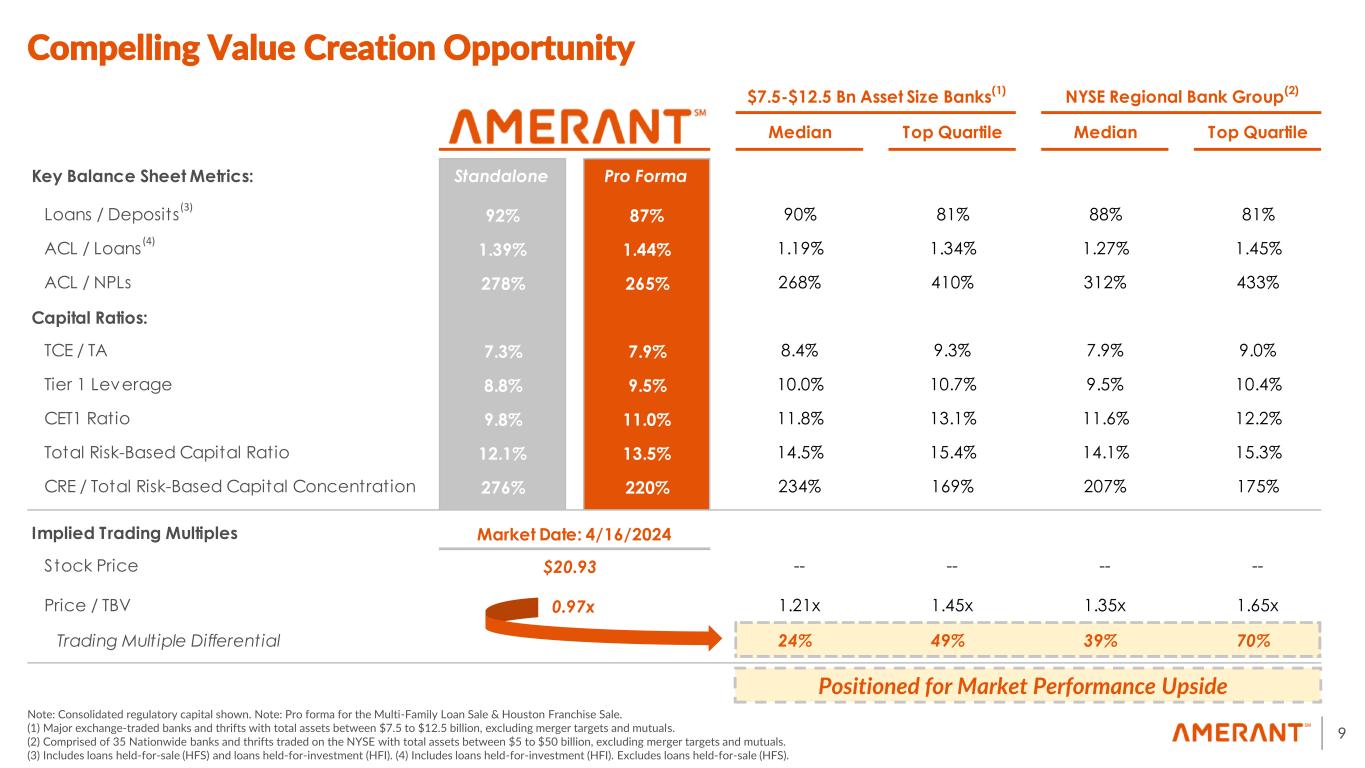
Positioned for Market Performance Upside Compelling Value Creation Opportunity Note: Consolidated regulatory capital shown. Note: Pro forma for the Multi-Family Loan Sale & Houston Franchise Sale. (1) Major exchange-traded banks and thrifts with total assets between $7.5 to $12.5 billion, excluding merger targets and mutuals. (2) Comprised of 35 Nationwide banks and thrifts traded on the NYSE with total assets between $5 to $50 billion, excluding merger targets and mutuals. (3) Includes loans held-for-sale (HFS) and loans held-for-investment (HFI). (4) Includes loans held-for-investment (HFI). Excludes loans held-for-sale (HFS). 9 Positioned for Market Performance Upside (4) (3) $7.5-$12.5 Bn Asset Size Banks (1) NYSE Regional Bank Group (2) Median Top Quartile Median Top Quartile Key Balance Sheet Metrics: Standalone Pro Forma Loans / Deposits 92% 87% 90% 81% 88% 81% ACL / Loans 1.39% 1.44% 1.19% 1.34% 1.27% 1.45% ACL / NPLs 278% 265% 268% 410% 312% 433% Capital Ratios: TCE / TA 7.3% 7.9% 8.4% 9.3% 7.9% 9.0% Tier 1 Leverage 8.8% 9.5% 10.0% 10.7% 9.5% 10.4% CET1 Ratio 9.8% 11.0% 11.8% 13.1% 11.6% 12.2% Total Risk-Based Capital Ratio 12.1% 13.5% 14.5% 15.4% 14.1% 15.3% CRE / Total Risk-Based Capital Concentration 276% 220% 234% 169% 207% 175% Implied Trading Multiples Market Date: 4/16/2024 Stock Price $20.93 -- -- -- -- Price / TBV 0.97x 1.21x 1.45x 1.35x 1.65x Trading Multiple Differential 24% 49% 39% 70%
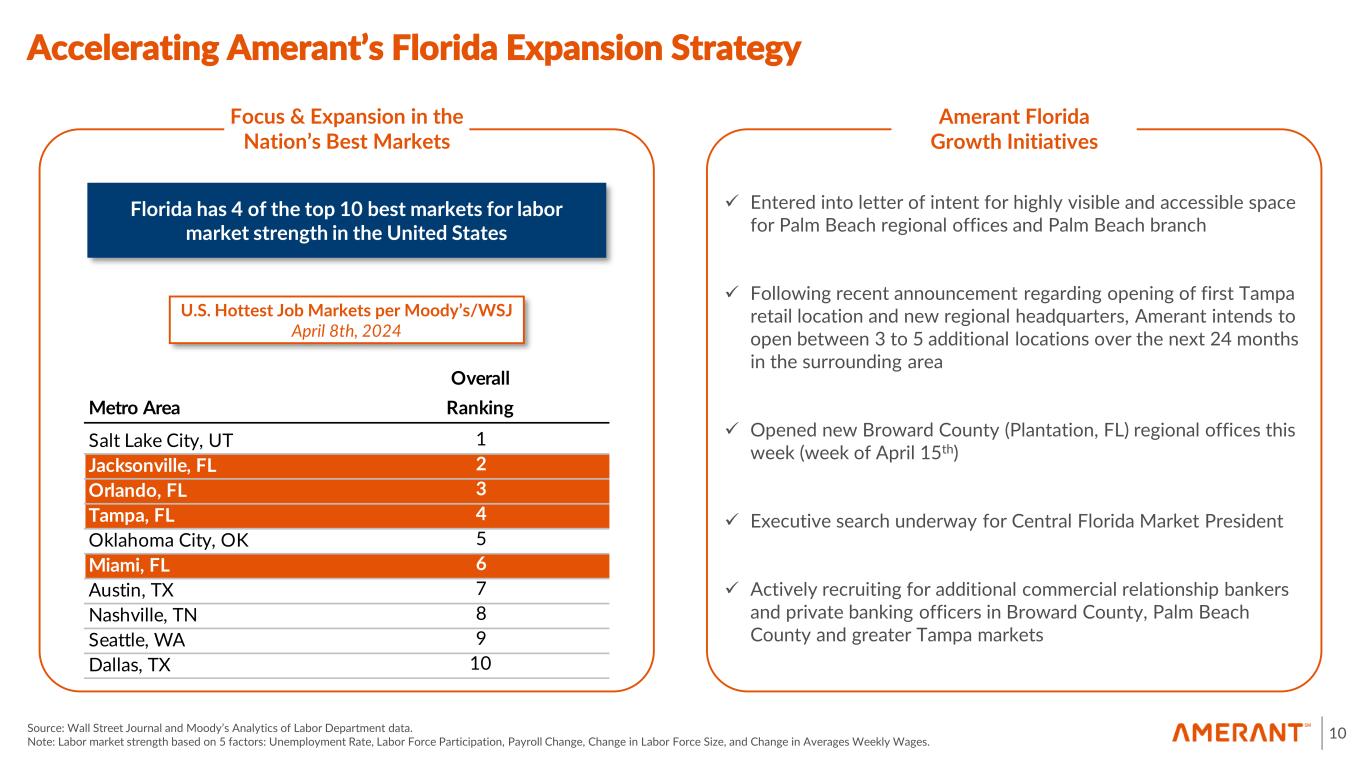
Accelerating Amerant’s Florida Expansion Strategy 10 ✓ Entered into letter of intent for highly visible and accessible space for Palm Beach regional offices and Palm Beach branch ✓ Following recent announcement regarding opening of first Tampa retail location and new regional headquarters, Amerant intends to open between 3 to 5 additional locations over the next 24 months in the surrounding area ✓ Opened new Broward County (Plantation, FL) regional offices this week (week of April 15th) ✓ Executive search underway for Central Florida Market President ✓ Actively recruiting for additional commercial relationship bankers and private banking officers in Broward County, Palm Beach County and greater Tampa markets Metro Area Overall Ranking Salt Lake City, UT 1 Jacksonville, FL 2 Orlando, FL 3 Tampa, FL 4 Oklahoma City, OK 5 Miami, FL 6 Austin, TX 7 Nashville, TN 8 Seattle, WA 9 Dallas, TX 10 Source: Wall Street Journal and Moody’s Analytics of Labor Department data. Note: Labor market strength based on 5 factors: Unemployment Rate, Labor Force Participation, Payroll Change, Change in Labor Force Size, and Change in Averages Weekly Wages. Focus & Expansion in the Nation’s Best Markets Amerant Florida Growth Initiatives U.S. Hottest Job Markets per Moody’s/WSJ April 8th, 2024 Florida has 4 of the top 10 best markets for labor market strength in the United States
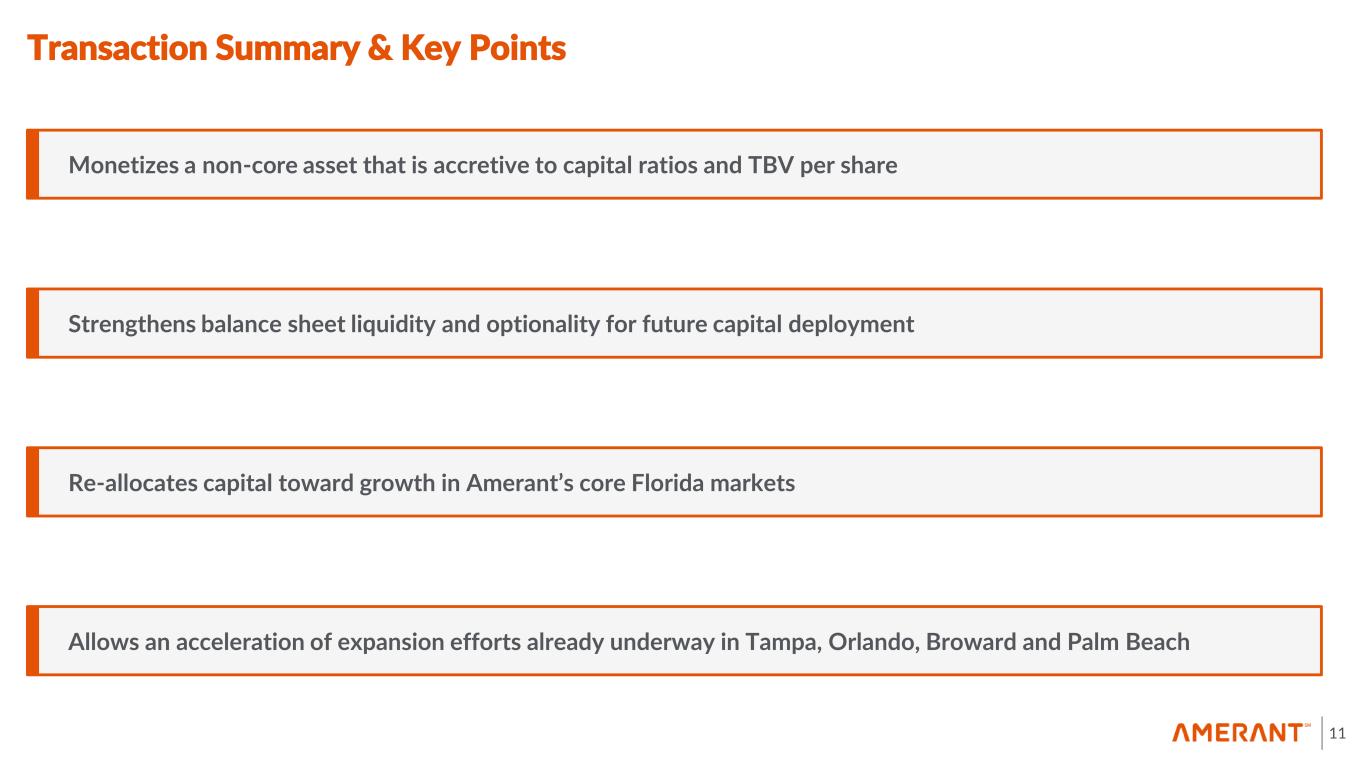
Transaction Summary & Key Points 11 Monetizes a non-core asset that is accretive to capital ratios and TBV per share Strengthens balance sheet liquidity and optionality for future capital deployment Re-allocates capital toward growth in Amerant’s core Florida markets Allows an acceleration of expansion efforts already underway in Tampa, Orlando, Broward and Palm Beach

Appendices 12
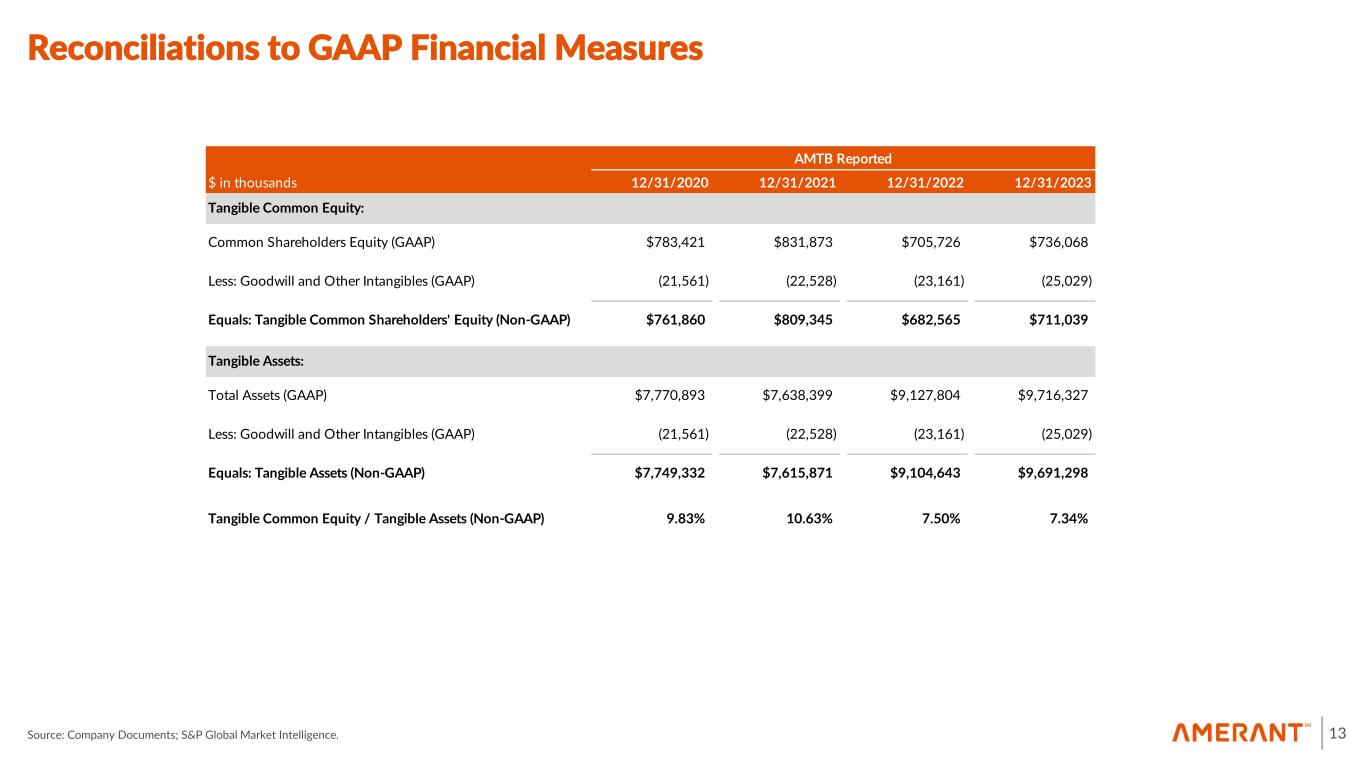
Reconciliations to GAAP Financial Measures Source: Company Documents; S&P Global Market Intelligence. 13 AMTB Reported $ in thousands 12/31/2020 12/31/2021 12/31/2022 12/31/2023 Tangible Common Equity: Common Shareholders Equity (GAAP) $783,421 $831,873 $705,726 $736,068 Less: Goodwill and Other Intangibles (GAAP) (21,561) (22,528) (23,161) (25,029) Equals: Tangible Common Shareholders' Equity (Non-GAAP) $761,860 $809,345 $682,565 $711,039 Tangible Assets: Total Assets (GAAP) $7,770,893 $7,638,399 $9,127,804 $9,716,327 Less: Goodwill and Other Intangibles (GAAP) (21,561) (22,528) (23,161) (25,029) Equals: Tangible Assets (Non-GAAP) $7,749,332 $7,615,871 $9,104,643 $9,691,298 Tangible Common Equity / Tangible Assets (Non-GAAP) 9.83% 10.63% 7.50% 7.34%
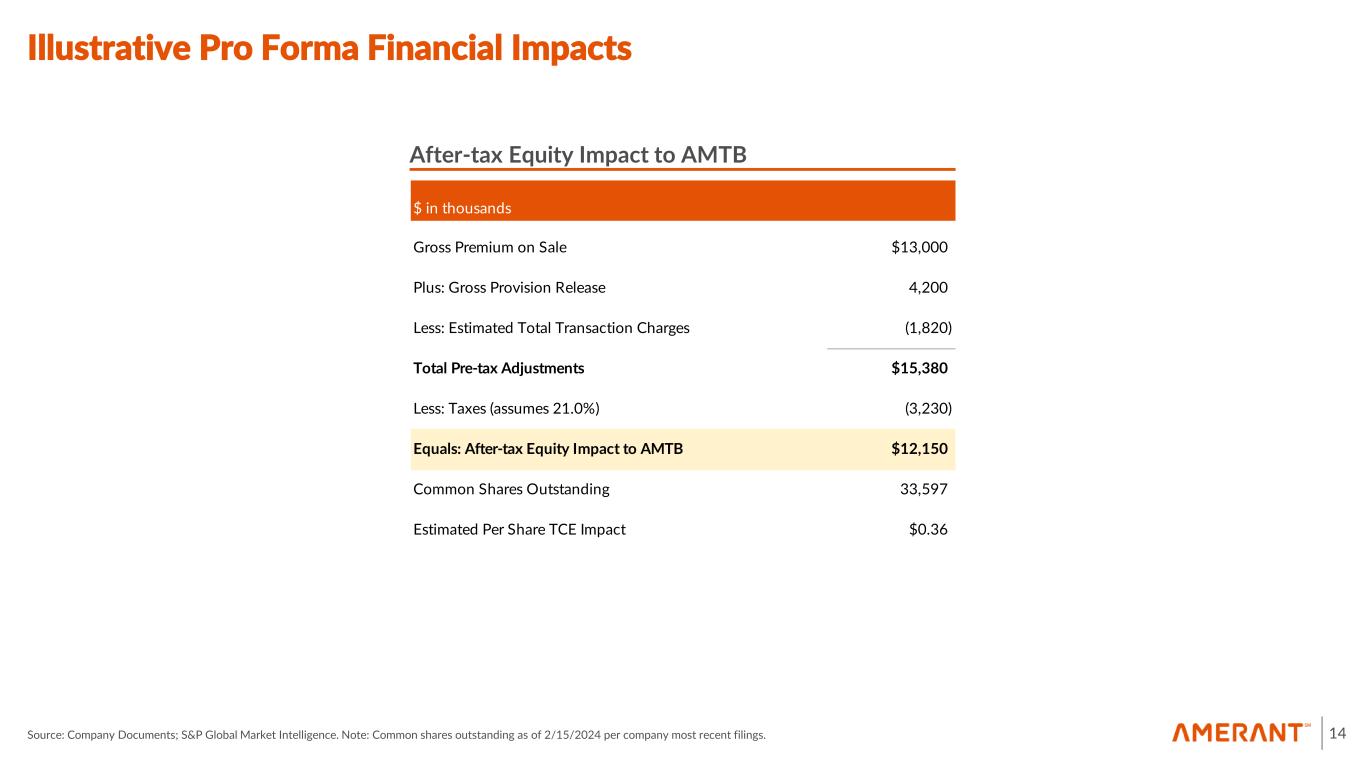
Illustrative Pro Forma Financial Impacts Source: Company Documents; S&P Global Market Intelligence. Note: Common shares outstanding as of 2/15/2024 per company most recent filings. 14 After-tax Equity Impact to AMTB $ in thousands Gross Premium on Sale $13,000 Plus: Gross Provision Release 4,200 Less: Estimated Total Transaction Charges (1,820) Total Pre-tax Adjustments $15,380 Less: Taxes (assumes 21.0%) (3,230) Equals: After-tax Equity Impact to AMTB $12,150 Common Shares Outstanding 33,597 Estimated Per Share TCE Impact $0.36
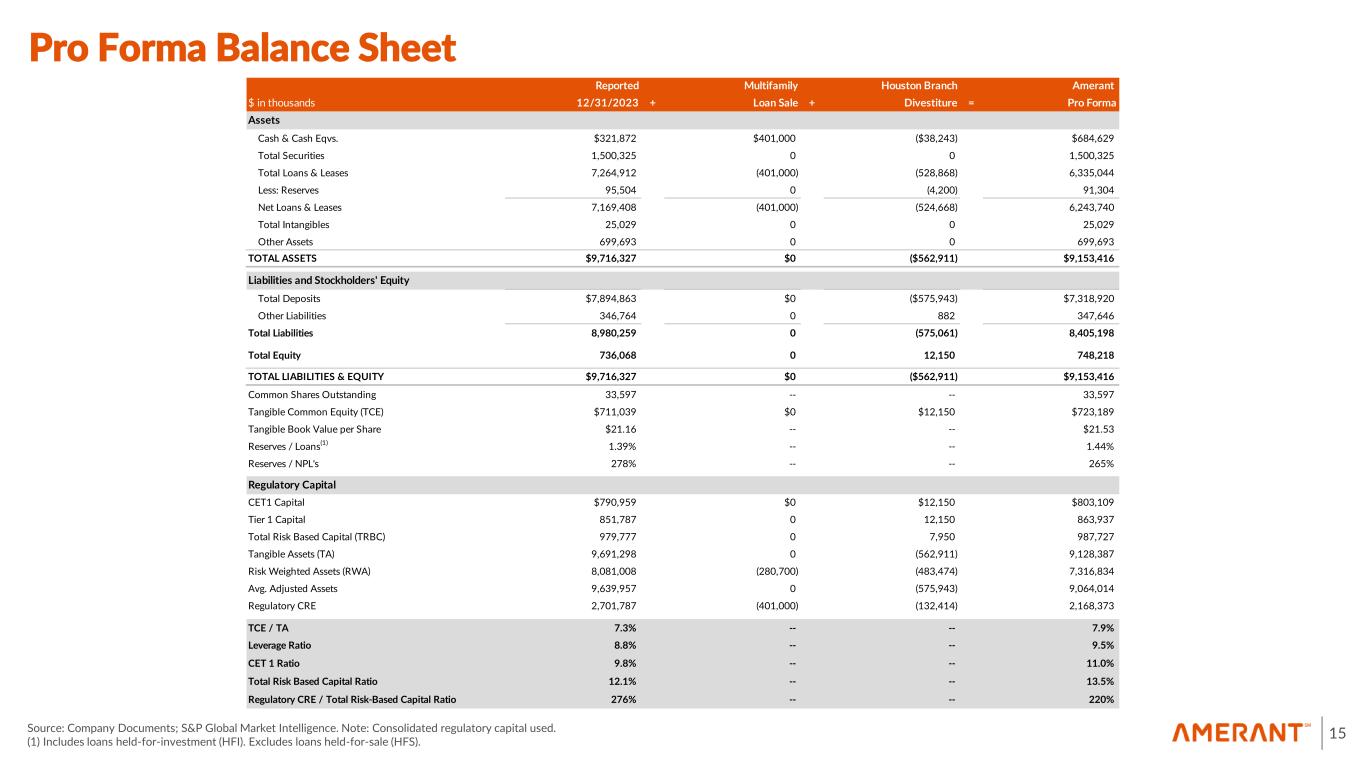
Pro Forma Balance Sheet 15 Reported Multifamily Houston Branch Amerant $ in thousands 12/31/2023 + Loan Sale + Divestiture = Pro Forma Assets Cash & Cash Eqvs. $321,872 $401,000 ($38,243) $684,629 Total Securities 1,500,325 0 0 1,500,325 Total Loans & Leases 7,264,912 (401,000) (528,868) 6,335,044 Less: Reserves 95,504 0 (4,200) 91,304 Net Loans & Leases 7,169,408 (401,000) (524,668) 6,243,740 Total Intangibles 25,029 0 0 25,029 Other Assets 699,693 0 0 699,693 TOTAL ASSETS $9,716,327 $0 ($562,911) $9,153,416 Liabilities and Stockholders' Equity Total Deposits $7,894,863 $0 ($575,943) $7,318,920 Other Liabilities 346,764 0 882 347,646 Total Liabilities 8,980,259 0 (575,061) 8,405,198 Total Equity 736,068 0 12,150 748,218 TOTAL LIABILITIES & EQUITY $9,716,327 $0 ($562,911) $9,153,416 Common Shares Outstanding 33,597 -- -- 33,597 Tangible Common Equity (TCE) $711,039 $0 $12,150 $723,189 Tangible Book Value per Share $21.16 -- -- $21.53 Reserves / Loans(1) 1.39% -- -- 1.44% Reserves / NPL's 278% -- -- 265% Regulatory Capital CET1 Capital $790,959 $0 $12,150 $803,109 Tier 1 Capital 851,787 0 12,150 863,937 Total Risk Based Capital (TRBC) 979,777 0 7,950 987,727 Tangible Assets (TA) 9,691,298 0 (562,911) 9,128,387 Risk Weighted Assets (RWA) 8,081,008 (280,700) (483,474) 7,316,834 Avg. Adjusted Assets 9,639,957 0 (575,943) 9,064,014 Regulatory CRE 2,701,787 (401,000) (132,414) 2,168,373 TCE / TA 7.3% -- -- 7.9% Leverage Ratio 8.8% -- -- 9.5% CET 1 Ratio 9.8% -- -- 11.0% Total Risk Based Capital Ratio 12.1% -- -- 13.5% Regulatory CRE / Total Risk-Based Capital Ratio 276% -- -- 220% Source: Company Documents; S&P Global Market Intelligence. Note: Consolidated regulatory capital used. (1) Includes loans held-for-investment (HFI). Excludes loans held-for-sale (HFS).