First Quarter Earnings Presentation April 24, 2025
2 Important Notices and Disclaimers Forward-Looking Statements This presentation contains “forward-looking statements” including statements with respect to the Company’s objectives, expectations and intentions and other statements that are not historical facts. Examples of forward- looking statements include but are not limited to: our future operating or financial performance, including revenues, expenses, expense savings, income or loss and earnings or loss per share, and other financial items; statements regarding expectations, plans or objectives for future operations, products or services, and our expectations on our investment portfolio repositioning and loan recoveries or reaching positive resolutions on problem loans. All statements other than statements of historical fact are statements that could be forward-looking statements. You can identify these forward-looking statements through our use of words such as “may,” “will,” “anticipate,” “assume,” “should,” “indicate,” “would,” “believe,” “contemplate,” “expect,” “estimate,” “continue,” “plan,” “point to,” “project,” “could,” “intend,” “target,” “goals,” “outlooks,” “modeled,” “dedicated,” “create,” and other similar words and expressions of the future. Forward-looking statements, including those relating to our beliefs, plans, objectives, goals, expectations, anticipations, estimates and intentions, involve known and unknown risks, uncertainties and other factors, which may be beyond our control, and which may cause the Company’s actual results, performance, achievements, or financial condition to be materially different from future results, performance, achievements, or financial condition expressed or implied by such forward-looking statements. You should not rely on any forward-looking statements as predictions of future events. You should not expect us to update any forward-looking statements, except as required by law. All written or oral forward-looking statements attributable to us are expressly qualified in their entirety by this cautionary notice, together with those risks and uncertainties described in “Risk factors” in our annual report on Form 10-K for the fiscal year ended December 31, 2024 filed on March 5, 2025, and in our other filings with the U.S. Securities and Exchange Commission (the “SEC”), which are available at the SEC’s website www.sec.gov. Interim Financial Information Unaudited financial information as of and for interim periods, including the three -month periods ended March 31, 2025, December 31, 2024, and March 31, 2024, may not reflect our results of operations for our fiscal year ending, or financial condition as of December 31, 2025, or any other period of time or date. Non-GAAP Financial Measures The Company supplements its financial results that are determined in accordance with accounting principles generally accepted in the United States of America (“GAAP”) with non-GAAP financial measures, such as “pre- provision net revenue (PPNR)”, “core pre-provision net revenue (Core PPNR)”, “core noninterest income”, “core noninterest expense”, “core net income”, “core earnings per share (basic and diluted)”, “core return on assets (Core ROA)”, “core return on equity (Core ROE)”, “core efficiency ratio”, “tangible stockholders’ equity (book value) per common share”, “tangible common equity ratio, adjusted for net unrealized accumulated losses on debt securities held to maturity”, and “tangible stockholders' equity (book value) per common share, adjusted for net unrealized accumulated losses on debt securities held to maturity”. This supplemental information is not required by, or is not presented in accordance with GAAP. The Company refers to these financial measures and ratios as “non-GAAP financial measures”. We use certain non-GAAP financial measures, including those mentioned above, both to explain our results to shareholders and the investment community and in the internal evaluation and management of our business. Management believes that these supplementary non-GAAP financial measures and the information they provide are useful to investors since these measures permit investors to view our performance using the same tools that our management uses to evaluate our past performance and prospects for future performance. While we believe that these non-GAAP financial measures are useful in evaluating our performance, this information should be considered as supplemental and not as a substitute for or superior to the related financial information prepared in accordance with GAAP. Additionally, these non-GAAP financial measures may differ from similar measures presented by other companies. Appendix 1 reconciles these non-GAAP financial measures to reported results.
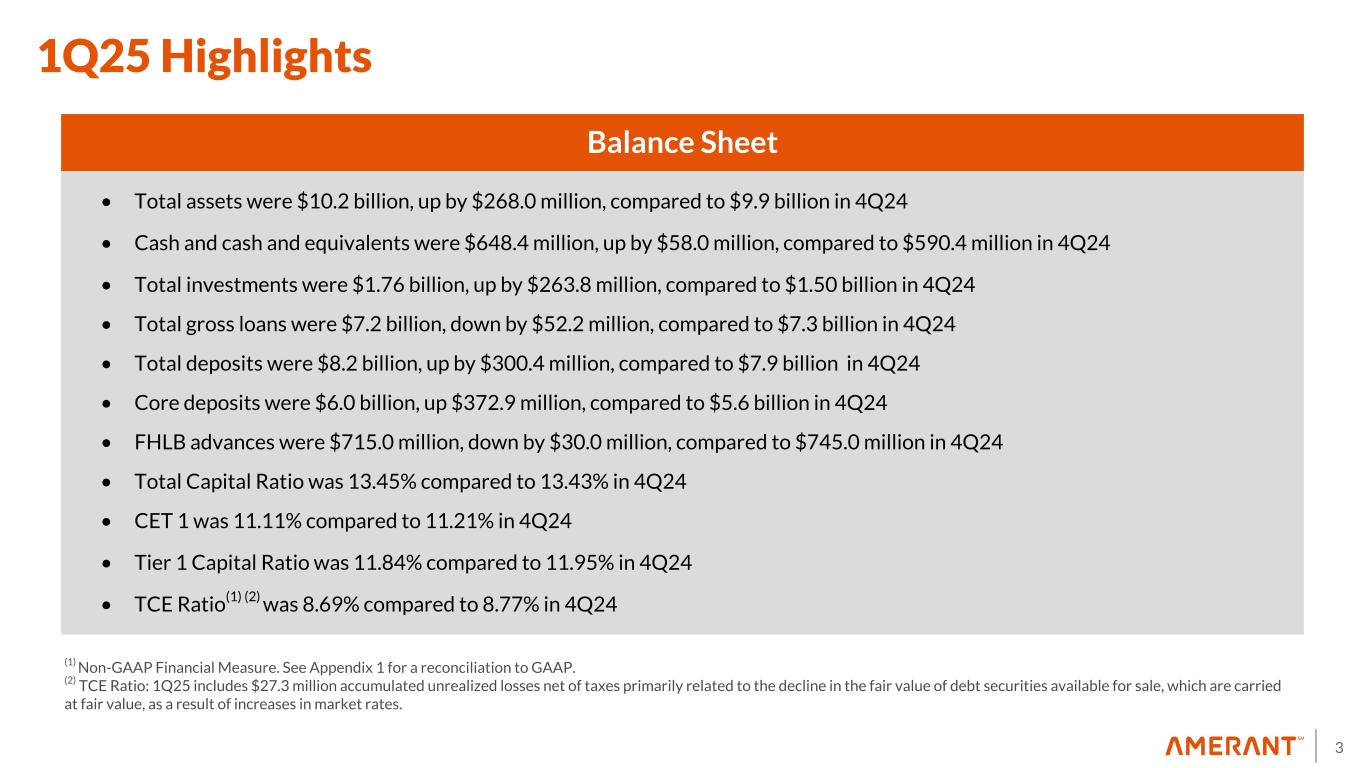
3 1Q25 Highlights Balance Sheet • Total assets were $10.2 billion, up by $268.0 million, compared to $9.9 billion in 4Q24 • Cash and cash and equivalents were $648.4 million, up by $58.0 million, compared to $590.4 million in 4Q24 • Total investments were $1.76 billion, up by $263.8 million, compared to $1.50 billion in 4Q24 • Total gross loans were $7.2 billion, down by $52.2 million, compared to $7.3 billion in 4Q24 • Total deposits were $8.2 billion, up by $300.4 million, compared to $7.9 billion in 4Q24 • Core deposits were $6.0 billion, up $372.9 million, compared to $5.6 billion in 4Q24 • FHLB advances were $715.0 million, down by $30.0 million, compared to $745.0 million in 4Q24 • Total Capital Ratio was 13.45% compared to 13.43% in 4Q24 • CET 1 was 11.11% compared to 11.21% in 4Q24 • Tier 1 Capital Ratio was 11.84% compared to 11.95% in 4Q24 • TCE Ratio(1) (2) was 8.69% compared to 8.77% in 4Q24 (1) Non-GAAP Financial Measure. See Appendix 1 for a reconciliation to GAAP. (2) TCE Ratio: 1Q25 includes $27.3 million accumulated unrealized losses net of taxes primarily related to the decline in the fair value of debt securities available for sale, which are carried at fair value, as a result of increases in market rates.
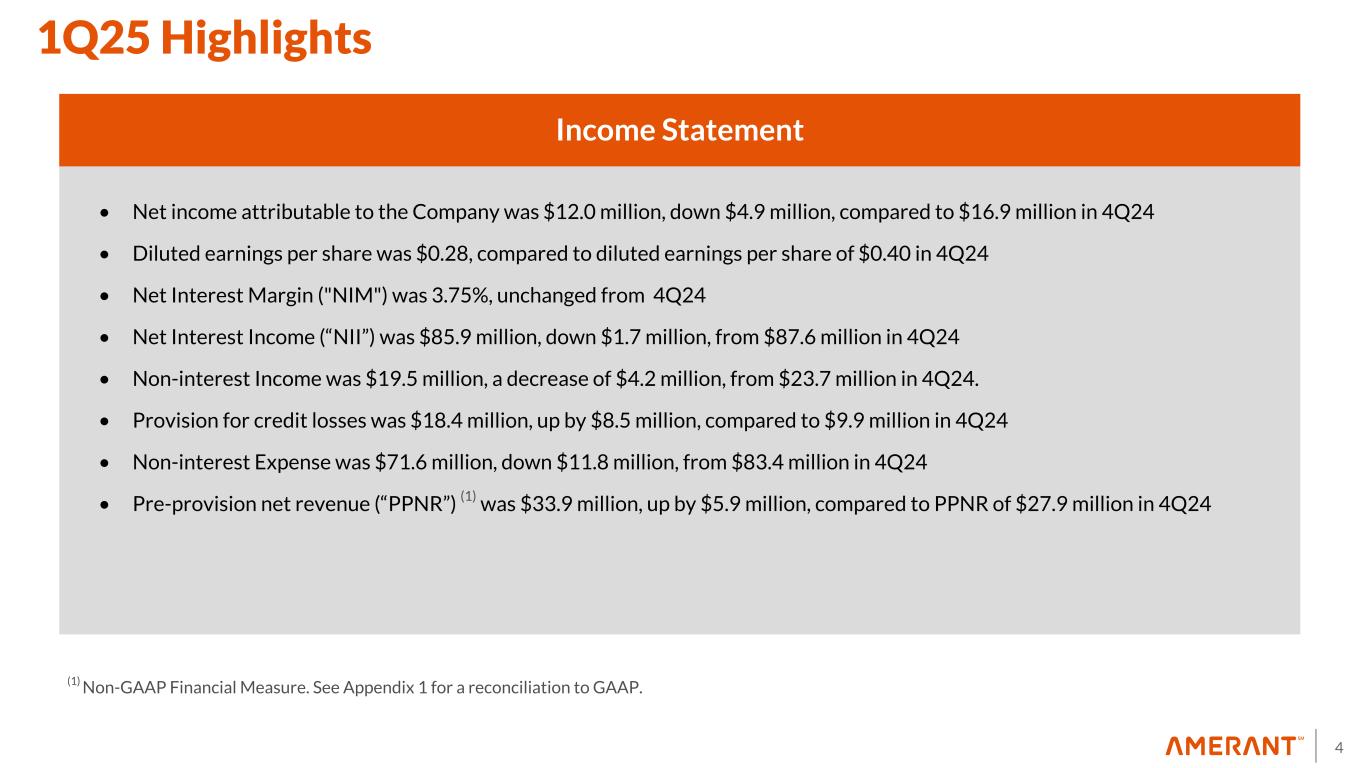
4 1Q25 Highlights Income Statement • Net income attributable to the Company was $12.0 million, down $4.9 million, compared to $16.9 million in 4Q24 • Diluted earnings per share was $0.28, compared to diluted earnings per share of $0.40 in 4Q24 • Net Interest Margin ("NIM") was 3.75%, unchanged from 4Q24 • Net Interest Income (“NII”) was $85.9 million, down $1.7 million, from $87.6 million in 4Q24 • Non-interest Income was $19.5 million, a decrease of $4.2 million, from $23.7 million in 4Q24. • Provision for credit losses was $18.4 million, up by $8.5 million, compared to $9.9 million in 4Q24 • Non-interest Expense was $71.6 million, down $11.8 million, from $83.4 million in 4Q24 • Pre-provision net revenue (“PPNR”) (1) was $33.9 million, up by $5.9 million, compared to PPNR of $27.9 million in 4Q24 (1) Non-GAAP Financial Measure. See Appendix 1 for a reconciliation to GAAP.
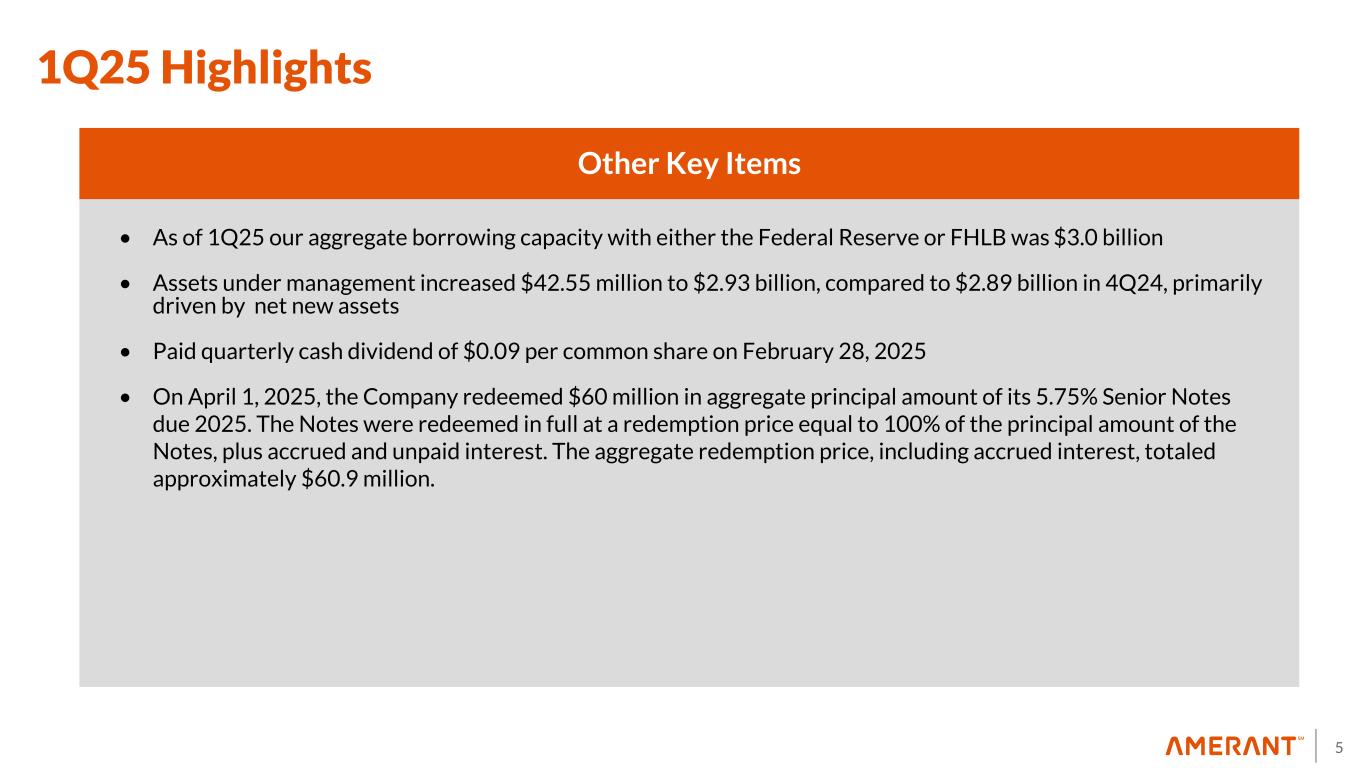
5 1Q25 Highlights Other Key Items • As of 1Q25 our aggregate borrowing capacity with either the Federal Reserve or FHLB was $3.0 billion • Assets under management increased $42.55 million to $2.93 billion, compared to $2.89 billion in 4Q24, primarily driven by net new assets • Paid quarterly cash dividend of $0.09 per common share on February 28, 2025 • On April 1, 2025, the Company redeemed $60 million in aggregate principal amount of its 5.75% Senior Notes due 2025. The Notes were redeemed in full at a redemption price equal to 100% of the principal amount of the Notes, plus accrued and unpaid interest. The aggregate redemption price, including accrued interest, totaled approximately $60.9 million.
6 Amerant Mortgage Updates Operating model transition: • Executing on a plan to reduce the size and scope of our mortgage business, transitioning from being a national mortgage originator to focusing on in-footprint mortgage lending to support Amerant's retail and private banking customer base • Currently, Amerant Mortgage operates as a subsidiary of Amerant Bank. As of 1Q25, it had 77 FTEs and licenses to operate in approximately 30 states, and most vendor contracts are short-term and mature within the next year • Expect to downsize and continue to operate business model at a much smaller scale. With reduced volume, we expect variable costs, such as vendor-related operating costs and personnel cost, to be lower, resulting in a reduction in non-interest expenses of approximately $2.5 million per quarter, starting in 3Q25 Key steps in the transition timeline (Next 120 days): – Progressively reducing FTE count to 20 – Transferring loans owned into our core platform – Exiting and/or modifying existing vendor contracts
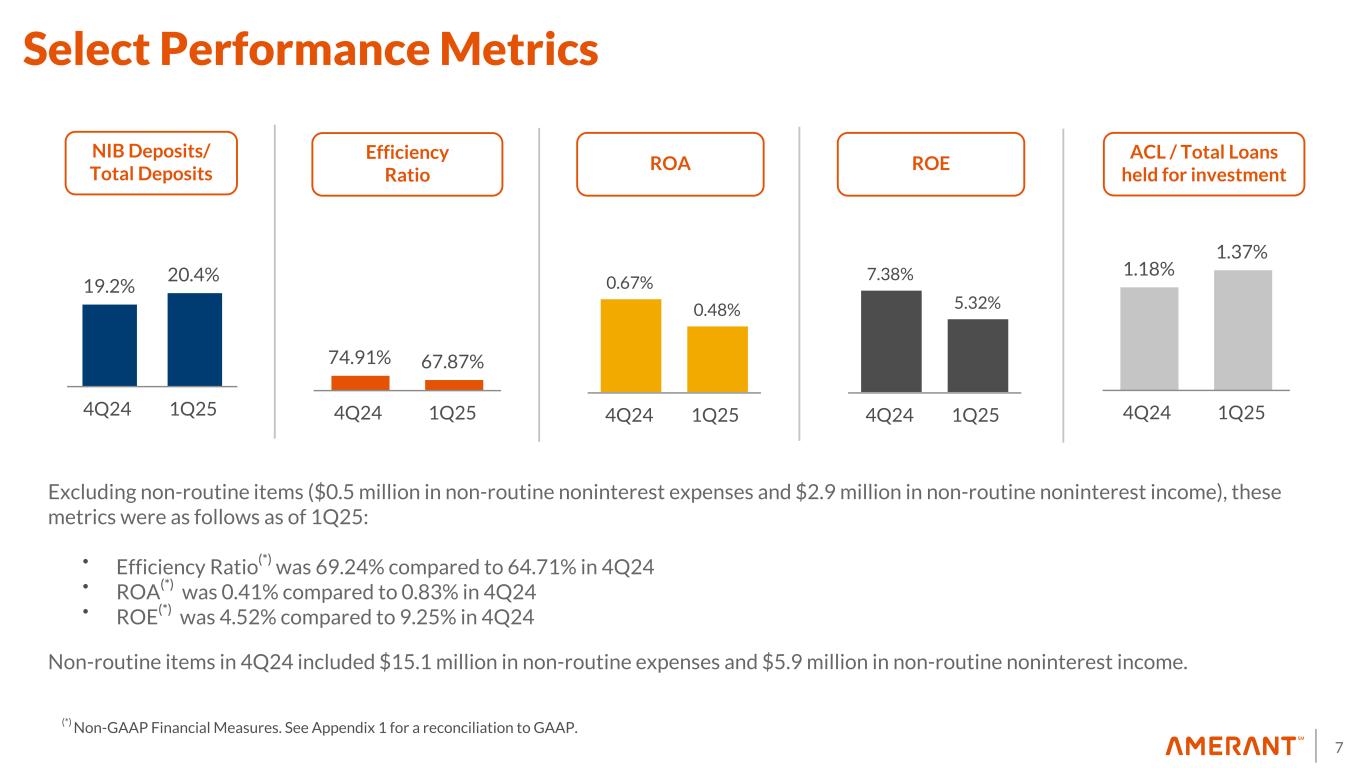
7 74.91% 67.87% 4Q24 1Q25 19.2% 20.4% 4Q24 1Q25 1.18% 1.37% 4Q24 1Q25 0.67% 0.48% 4Q24 1Q25 7.38% 5.32% 4Q24 1Q25 NIB Deposits/ Total Deposits Efficiency Ratio ACL / Total Loans held for investment ROA ROE Select Performance Metrics Excluding non-routine items ($0.5 million in non-routine noninterest expenses and $2.9 million in non-routine noninterest income), these metrics were as follows as of 1Q25: • Efficiency Ratio(*) was 69.24% compared to 64.71% in 4Q24 • ROA(*) was 0.41% compared to 0.83% in 4Q24 • ROE(*) was 4.52% compared to 9.25% in 4Q24 Non-routine items in 4Q24 included $15.1 million in non-routine expenses and $5.9 million in non-routine noninterest income. (*) Non-GAAP Financial Measures. See Appendix 1 for a reconciliation to GAAP.
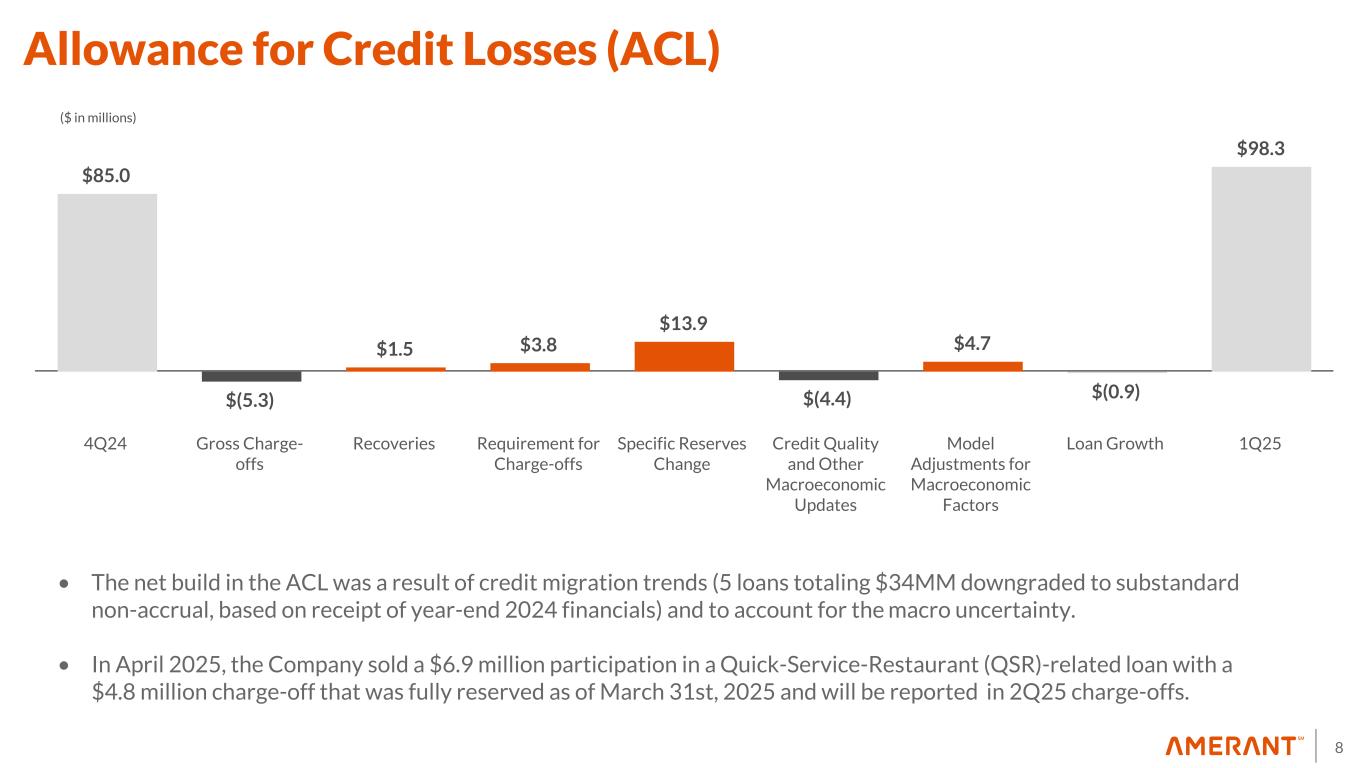
8 $85.0 $(5.3) $1.5 $3.8 $13.9 $(4.4) $4.7 $(0.9) $98.3 4Q24 Gross Charge- offs Recoveries Requirement for Charge-offs Specific Reserves Change Credit Quality and Other Macroeconomic Updates Model Adjustments for Macroeconomic Factors Loan Growth 1Q25 ($ in millions) Allowance for Credit Losses (ACL) • The net build in the ACL was a result of credit migration trends (5 loans totaling $34MM downgraded to substandard non-accrual, based on receipt of year-end 2024 financials) and to account for the macro uncertainty. • In April 2025, the Company sold a $6.9 million participation in a Quick-Service-Restaurant (QSR)-related loan with a $4.8 million charge-off that was fully reserved as of March 31st, 2025 and will be reported in 2Q25 charge-offs.
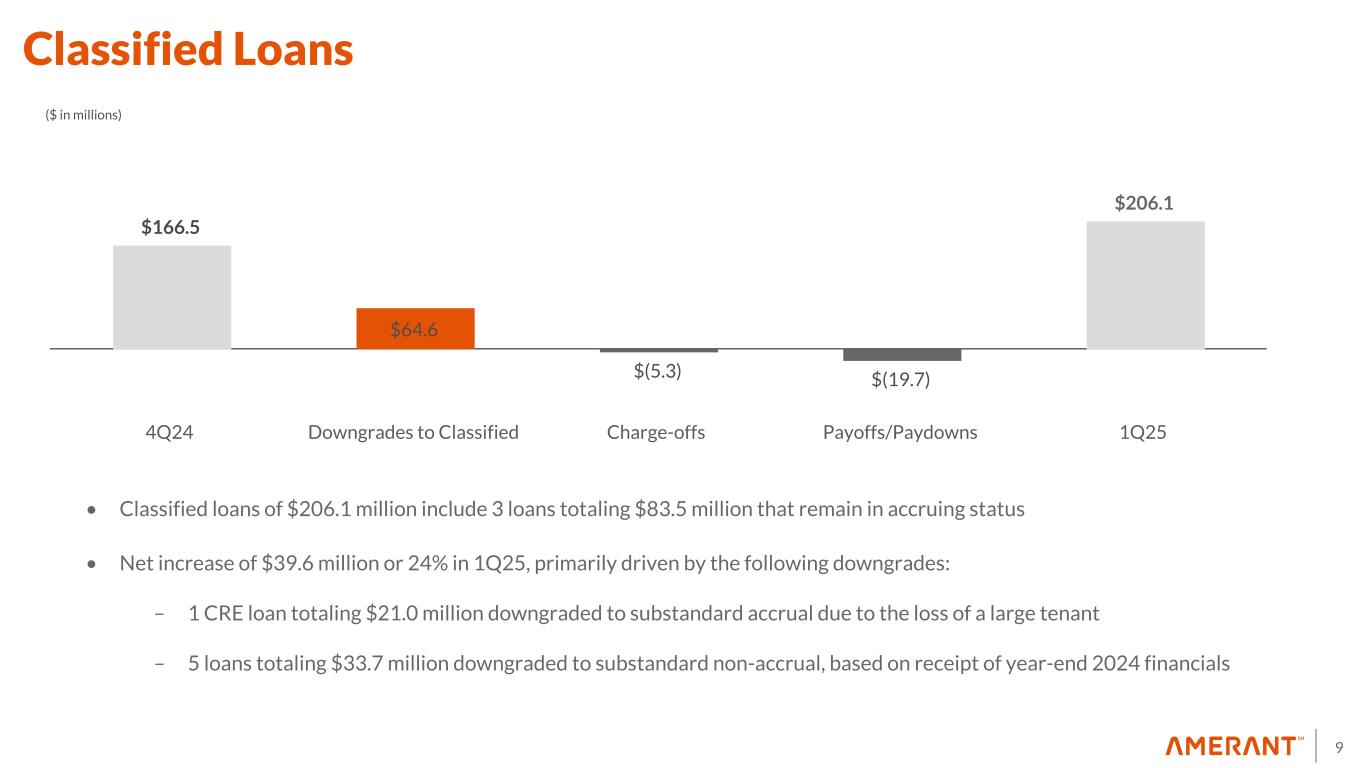
9 Classified Loans $166.5 $64.6 $(5.3) $(19.7) $206.1 4Q24 Downgrades to Classified Charge-offs Payoffs/Paydowns 1Q25 ($ in millions) • Classified loans of $206.1 million include 3 loans totaling $83.5 million that remain in accruing status • Net increase of $39.6 million or 24% in 1Q25, primarily driven by the following downgrades: – 1 CRE loan totaling $21.0 million downgraded to substandard accrual due to the loss of a large tenant – 5 loans totaling $33.7 million downgraded to substandard non-accrual, based on receipt of year-end 2024 financials
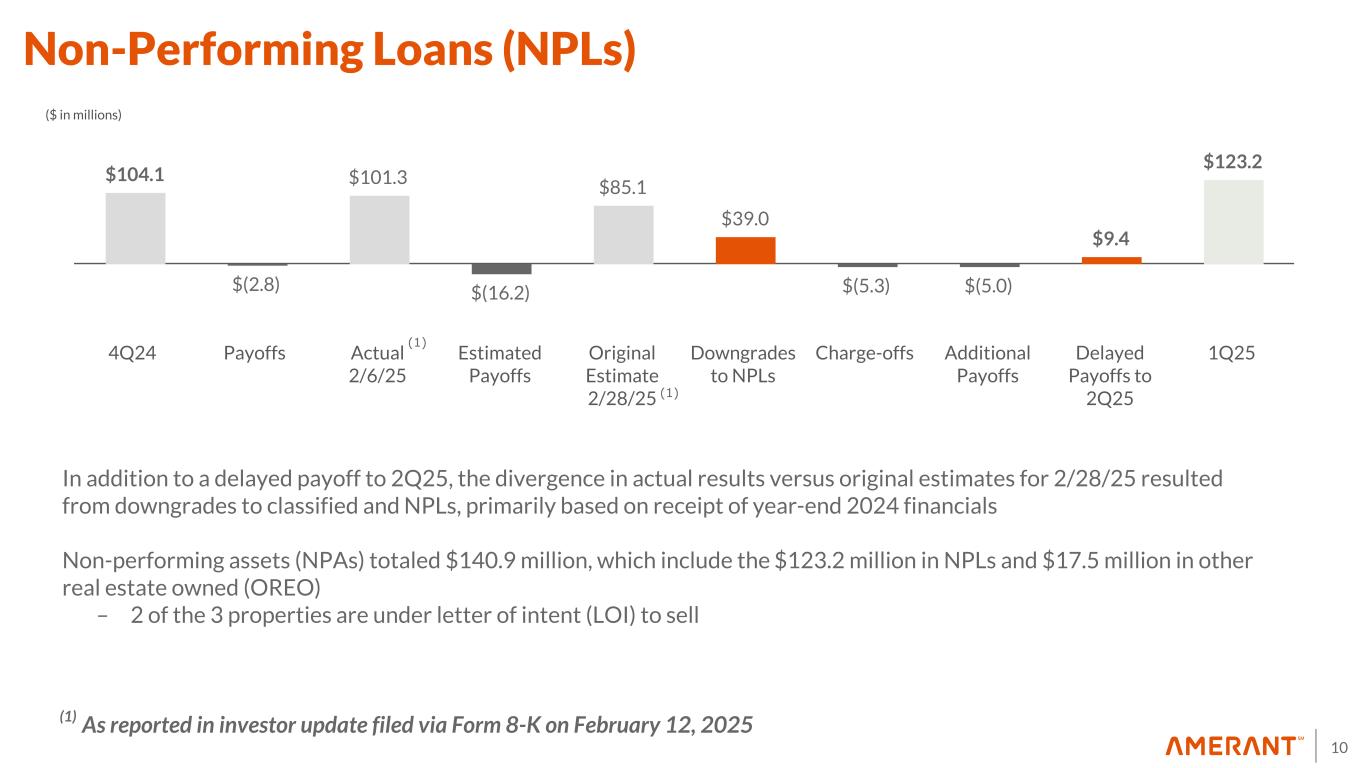
10 Non-Performing Loans (NPLs) ($ in millions) In addition to a delayed payoff to 2Q25, the divergence in actual results versus original estimates for 2/28/25 resulted from downgrades to classified and NPLs, primarily based on receipt of year-end 2024 financials Non-performing assets (NPAs) totaled $140.9 million, which include the $123.2 million in NPLs and $17.5 million in other real estate owned (OREO) – 2 of the 3 properties are under letter of intent (LOI) to sell $104.1 $(2.8) $101.3 $(16.2) $85.1 $39.0 $(5.3) $(5.0) $9.4 $123.2 4Q24 Payoffs Actual 2/6/25 Estimated Payoffs Original Estimate 2/28/25 Downgrades to NPLs Charge-offs Additional Payoffs Delayed Payoffs to 2Q25 1Q25 (1) (1) (1) As reported in investor update filed via Form 8-K on February 12, 2025
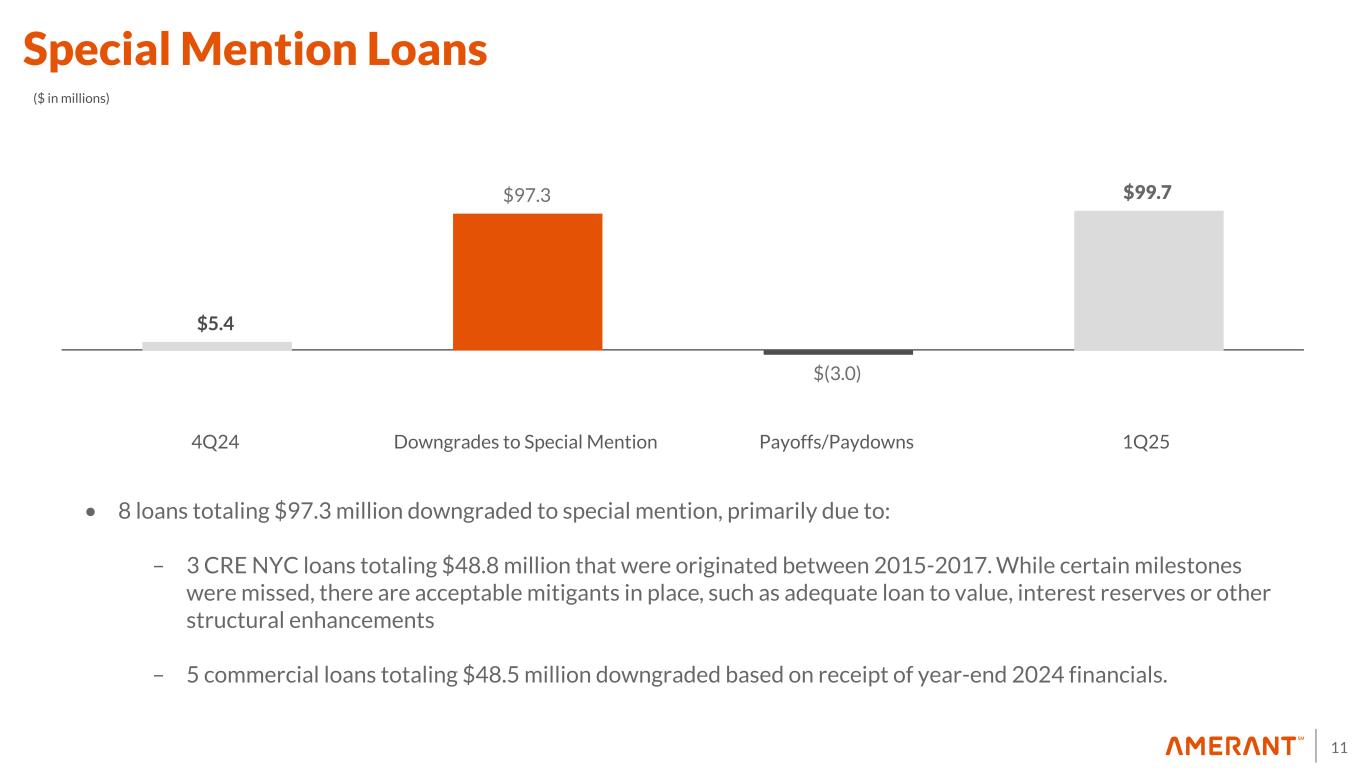
11 • 8 loans totaling $97.3 million downgraded to special mention, primarily due to: – 3 CRE NYC loans totaling $48.8 million that were originated between 2015-2017. While certain milestones were missed, there are acceptable mitigants in place, such as adequate loan to value, interest reserves or other structural enhancements – 5 commercial loans totaling $48.5 million downgraded based on receipt of year-end 2024 financials. Special Mention Loans $5.4 $97.3 $(3.0) $99.7 4Q24 Downgrades to Special Mention Payoffs/Paydowns 1Q25 ($ in millions)
12 2Q25 Outlook • Projected deposit growth in line with previous guidance of 15% annualized; continued focus on improving ratio of non-interest bearing to total deposits • Projected loan growth in the range of 10-15% by year end; temporary asset mix change (e.g. investment securities) would occur in the shorter-term if net loan growth occurs later in the year • Net interest margin projected to be in the mid-3.60% range in 2Q25 • Projected expenses in 2Q25 at similar levels than 1Q25, as certain cost reductions are expected to be offset with investment in continued expansion. Further cost reductions related to Amerant Mortgage expected in the second half of 2025 • Will continue execution of prudent capital management
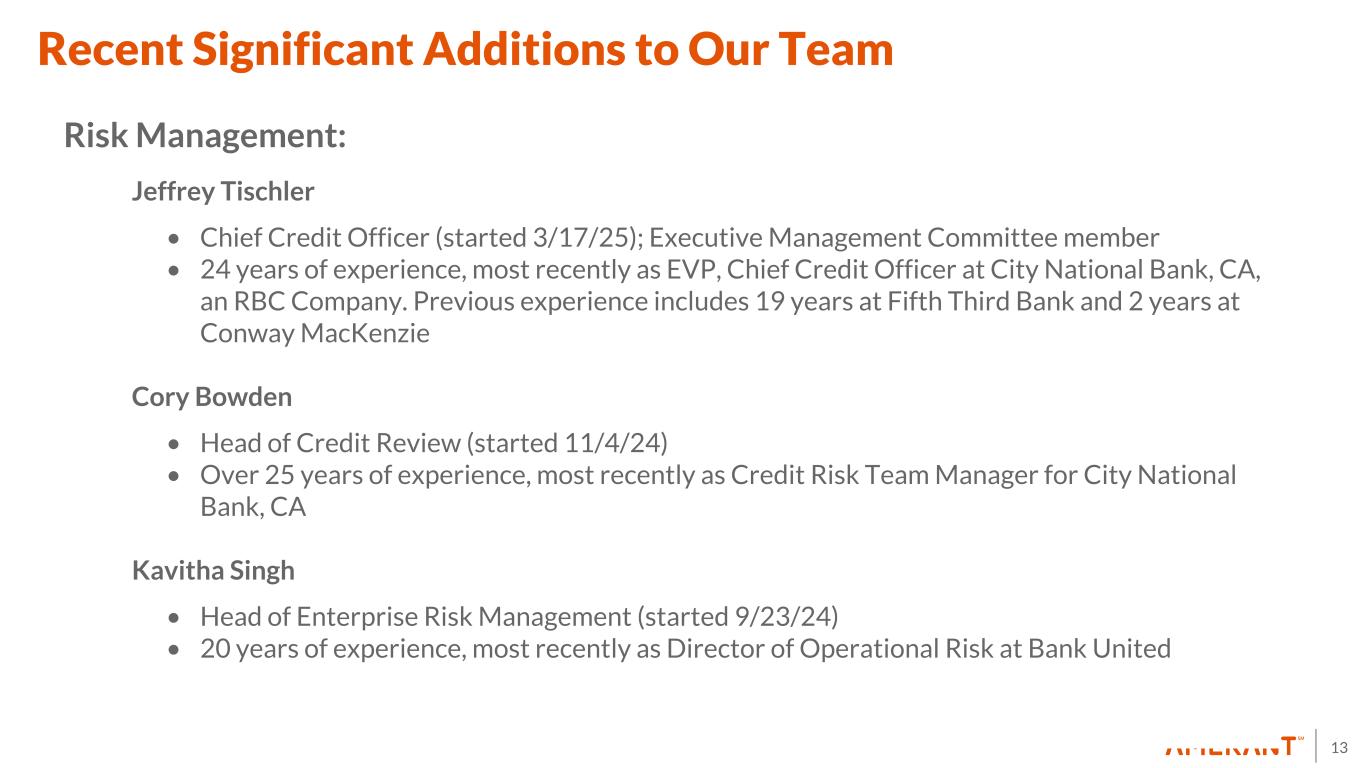
13 Recent Significant Additions to Our Team Risk Management: Jeffrey Tischler • Chief Credit Officer (started 3/17/25); Executive Management Committee member • 24 years of experience, most recently as EVP, Chief Credit Officer at City National Bank, CA, an RBC Company. Previous experience includes 19 years at Fifth Third Bank and 2 years at Conway MacKenzie Cory Bowden • Head of Credit Review (started 11/4/24) • Over 25 years of experience, most recently as Credit Risk Team Manager for City National Bank, CA Kavitha Singh • Head of Enterprise Risk Management (started 9/23/24) • 20 years of experience, most recently as Director of Operational Risk at Bank United
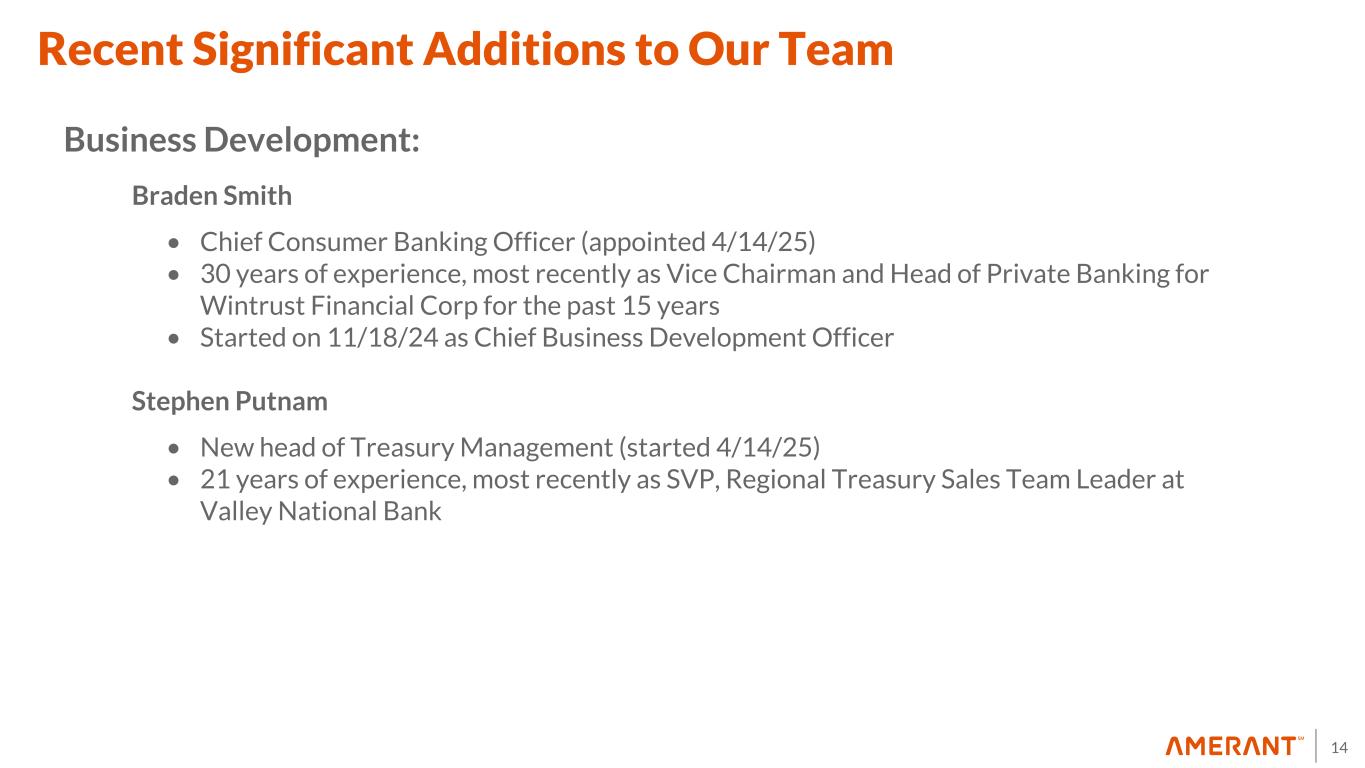
14 Recent Significant Additions to Our Team Business Development: Braden Smith • Chief Consumer Banking Officer (appointed 4/14/25) • 30 years of experience, most recently as Vice Chairman and Head of Private Banking for Wintrust Financial Corp for the past 15 years • Started on 11/18/24 as Chief Business Development Officer Stephen Putnam • New head of Treasury Management (started 4/14/25) • 21 years of experience, most recently as SVP, Regional Treasury Sales Team Leader at Valley National Bank
15 Strategic Update • Opened our new regional office and banking center in West Palm Beach in mid-April 2025 • Opening two new locations in Miami Beach and a second one in downtown Tampa in the next several months; continuing to opportunistically look at other locations • Hiring focus is on adding to business development personnel in Miami Beach, West Palm Beach and Tampa • Expect further additions to bolster credit support as part of bringing on new leadership

Supplemental Information
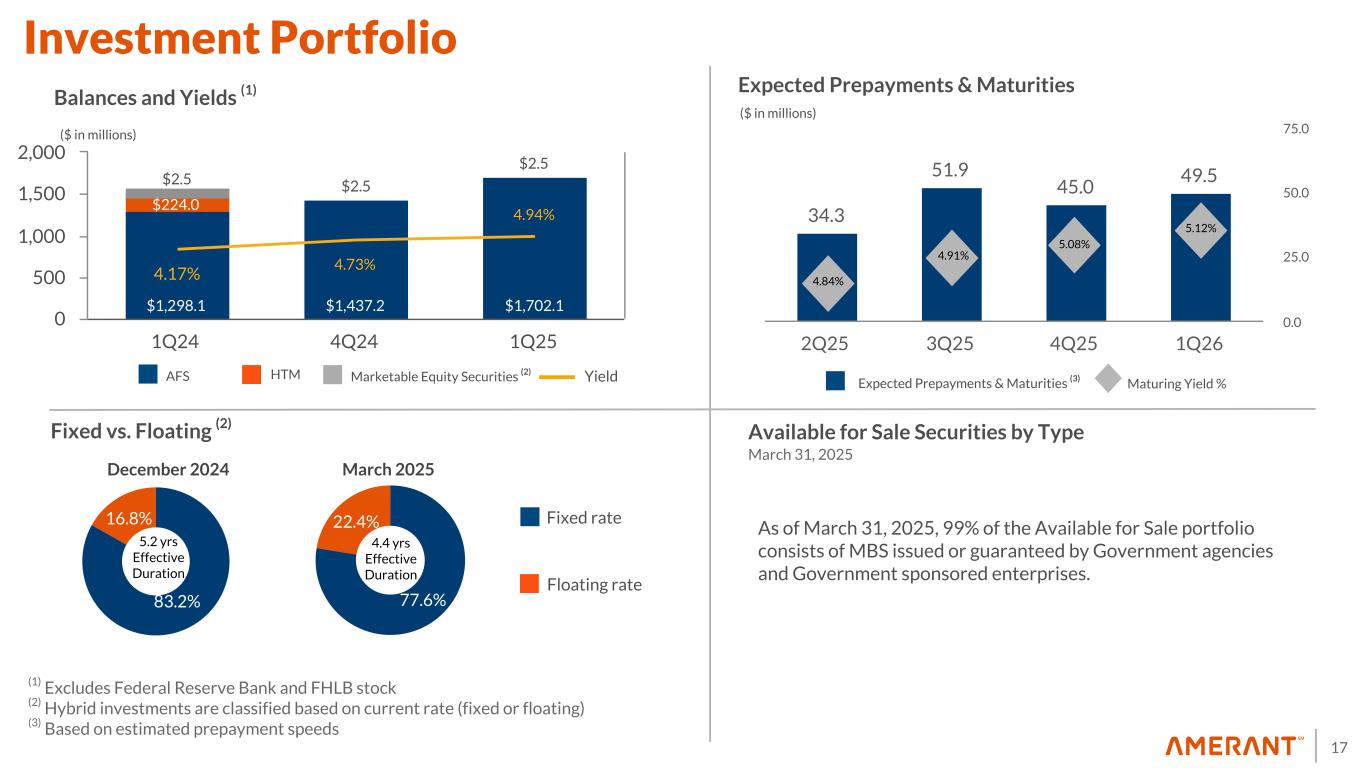
17 77.6% 22.4% $1,298.1 $1,437.2 $1,702.1 $224.0 $2.5 $2.5 $2.5 4.17% 4.73% 4.94% 1Q24 4Q24 1Q25 0 500 1,000 1,500 2,000 83.2% 16.8% Balances and Yields (1) AFS HTM Fixed vs. Floating (2) March 2025 Floating rate Fixed rate Available for Sale Securities by Type March 31, 2025 5.2 yrs Effective Duration ($ in millions) Marketable Equity Securities (2) (1) Excludes Federal Reserve Bank and FHLB stock (2) Hybrid investments are classified based on current rate (fixed or floating) (3) Based on estimated prepayment speeds Yield 4.4 yrs Effective Duration 34.3 51.9 45.0 49.5 2Q25 3Q25 4Q25 1Q26 0.0 25.0 50.0 75.0 ($ in millions) Expected Prepayments & Maturities Expected Prepayments & Maturities (3) Maturing Yield % Investment Portfolio 4.84% 4.91% 5.08% 5.12% December 2024 As of March 31, 2025, 99% of the Available for Sale portfolio consists of MBS issued or guaranteed by Government agencies and Government sponsored enterprises.
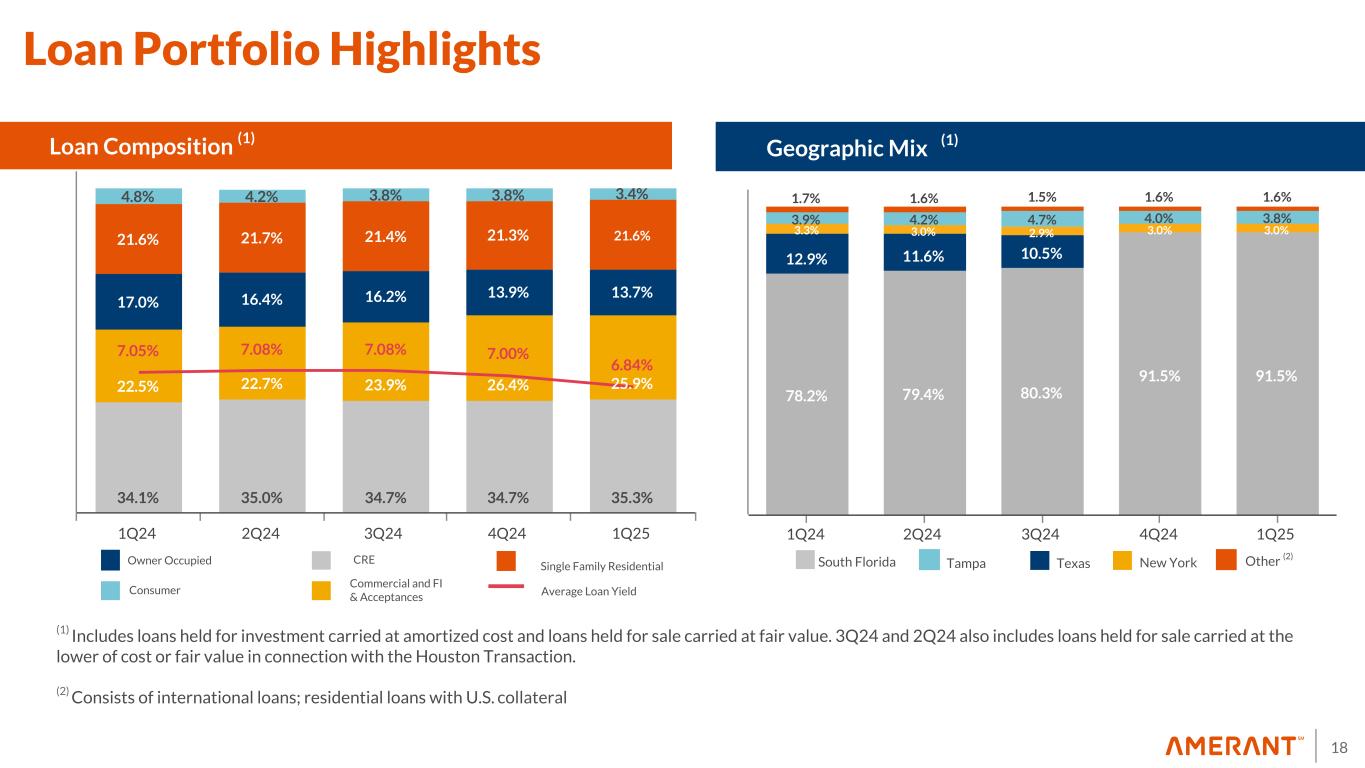
18 34.1% 35.0% 34.7% 34.7% 35.3% 22.5% 22.7% 23.9% 26.4% 25.9% 17.0% 16.4% 16.2% 13.9% 13.7% 21.6% 21.7% 21.4% 21.3% 21.6% 4.8% 4.2% 3.8% 3.8% 3.4% 7.05% 7.08% 7.08% 7.00% 6.84% 1Q24 2Q24 3Q24 4Q24 1Q25 78.2% 79.4% 80.3% 91.5% 91.5% 12.9% 11.6% 10.5% 3.3% 3.0% 2.9% 3.0% 3.0% 3.9% 4.2% 4.7% 4.0% 3.8% 1.7% 1.6% 1.5% 1.6% 1.6% 1Q24 2Q24 3Q24 4Q24 1Q25 Consumer CRE Commercial and FI & Acceptances Owner Occupied Single Family Residential Loan Composition (1) Geographic Mix (Domestic) Geographic ix (1) South Florida Texas New York Average Loan Yield Other (2) (1) Includes loans held for investment carried at amortized cost and loans held for sale carried at fair value. 3Q24 and 2Q24 also includes loans held for sale carried at the lower of cost or fair value in connection with the Houston Transaction. (2) Consists of international loans; residential loans with U.S. collateral Tampa Loan Portfolio Highlights
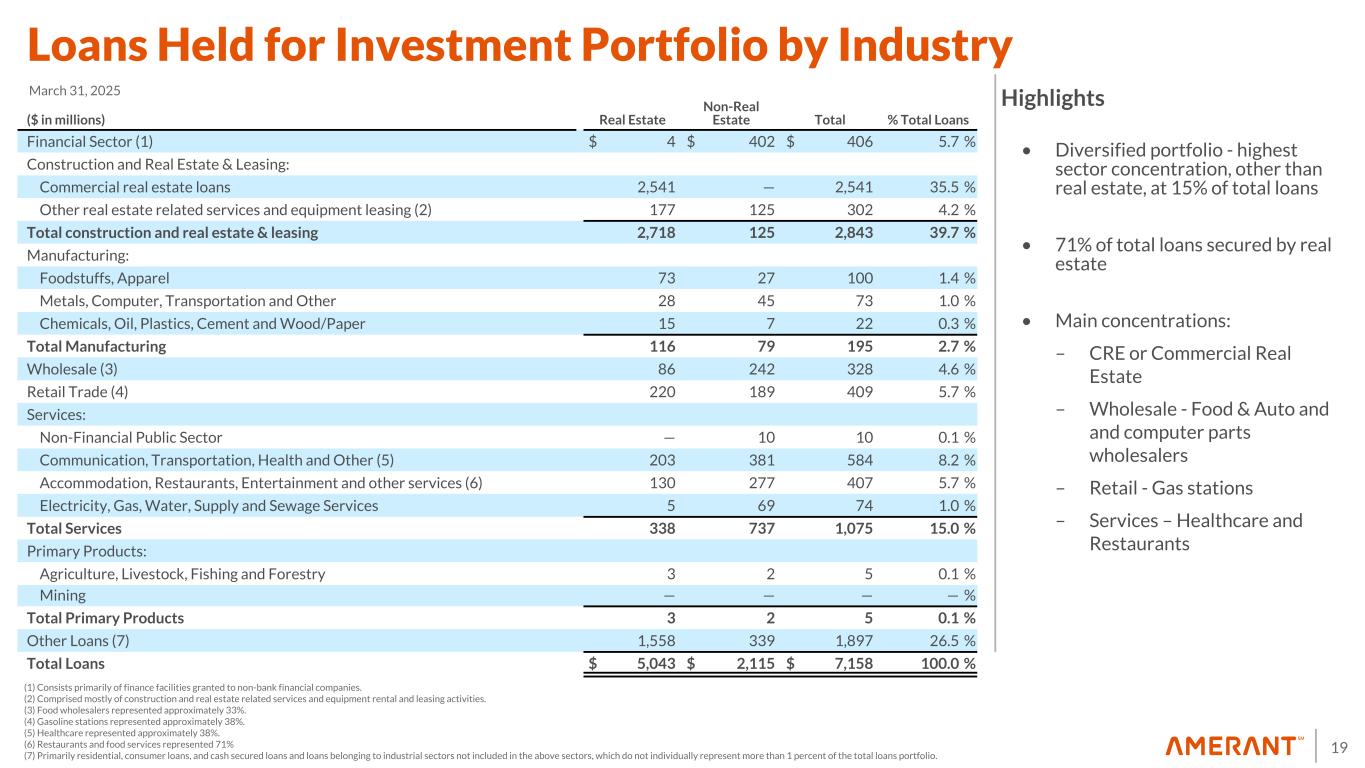
19 Loans Held for Investment Portfolio by Industry • Diversified portfolio - highest sector concentration, other than real estate, at 15% of total loans • 71% of total loans secured by real estate • Main concentrations: – CRE or Commercial Real Estate – Wholesale - Food & Auto and and computer parts wholesalers – Retail - Gas stations – Services – Healthcare and Restaurants Highlights (1) Consists primarily of finance facilities granted to non-bank financial companies. (2) Comprised mostly of construction and real estate related services and equipment rental and leasing activities. (3) Food wholesalers represented approximately 33%. (4) Gasoline stations represented approximately 38%. (5) Healthcare represented approximately 38%. (6) Restaurants and food services represented 71% (7) Primarily residential, consumer loans, and cash secured loans and loans belonging to industrial sectors not included in the above sectors, which do not individually represent more than 1 percent of the total loans portfolio. ($ in millions) Real Estate Non-Real Estate Total % Total Loans Financial Sector (1) $ 4 $ 402 $ 406 5.7 % Construction and Real Estate & Leasing: Commercial real estate loans 2,541 — 2,541 35.5 % Other real estate related services and equipment leasing (2) 177 125 302 4.2 % Total construction and real estate & leasing 2,718 125 2,843 39.7 % Manufacturing: Foodstuffs, Apparel 73 27 100 1.4 % Metals, Computer, Transportation and Other 28 45 73 1.0 % Chemicals, Oil, Plastics, Cement and Wood/Paper 15 7 22 0.3 % Total Manufacturing 116 79 195 2.7 % Wholesale (3) 86 242 328 4.6 % Retail Trade (4) 220 189 409 5.7 % Services: Non-Financial Public Sector — 10 10 0.1 % Communication, Transportation, Health and Other (5) 203 381 584 8.2 % Accommodation, Restaurants, Entertainment and other services (6) 130 277 407 5.7 % Electricity, Gas, Water, Supply and Sewage Services 5 69 74 1.0 % Total Services 338 737 1,075 15.0 % Primary Products: Agriculture, Livestock, Fishing and Forestry 3 2 5 0.1 % Mining — — — — % Total Primary Products 3 2 5 0.1 % Other Loans (7) 1,558 339 1,897 26.5 % Total Loans $ 5,043 $ 2,115 $ 7,158 100.0 % March 31, 2025
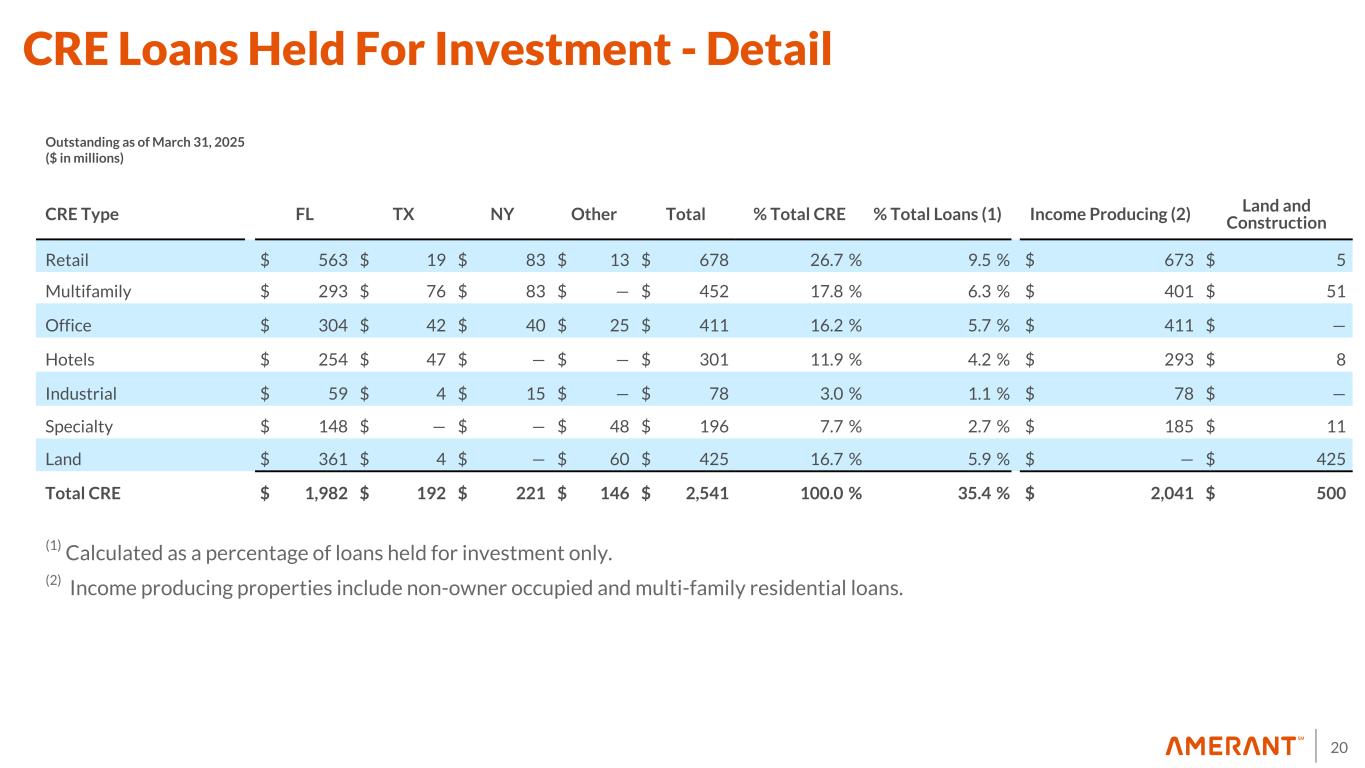
20 CRE Type FL TX NY Other Total % Total CRE % Total Loans (1) Income Producing (2) Land and Construction Retail $ 563 $ 19 $ 83 $ 13 $ 678 26.7 % 9.5 % $ 673 $ 5 Multifamily $ 293 $ 76 $ 83 $ — $ 452 17.8 % 6.3 % $ 401 $ 51 Office $ 304 $ 42 $ 40 $ 25 $ 411 16.2 % 5.7 % $ 411 $ — Hotels $ 254 $ 47 $ — $ — $ 301 11.9 % 4.2 % $ 293 $ 8 Industrial $ 59 $ 4 $ 15 $ — $ 78 3.0 % 1.1 % $ 78 $ — Specialty $ 148 $ — $ — $ 48 $ 196 7.7 % 2.7 % $ 185 $ 11 Land $ 361 $ 4 $ — $ 60 $ 425 16.7 % 5.9 % $ — $ 425 Total CRE $ 1,982 $ 192 $ 221 $ 146 $ 2,541 100.0 % 35.4 % $ 2,041 $ 500 Outstanding as of March 31, 2025 ($ in millions) (1) Calculated as a percentage of loans held for investment only. (2) Income producing properties include non-owner occupied and multi-family residential loans. CRE Loans Held For Investment - Detail
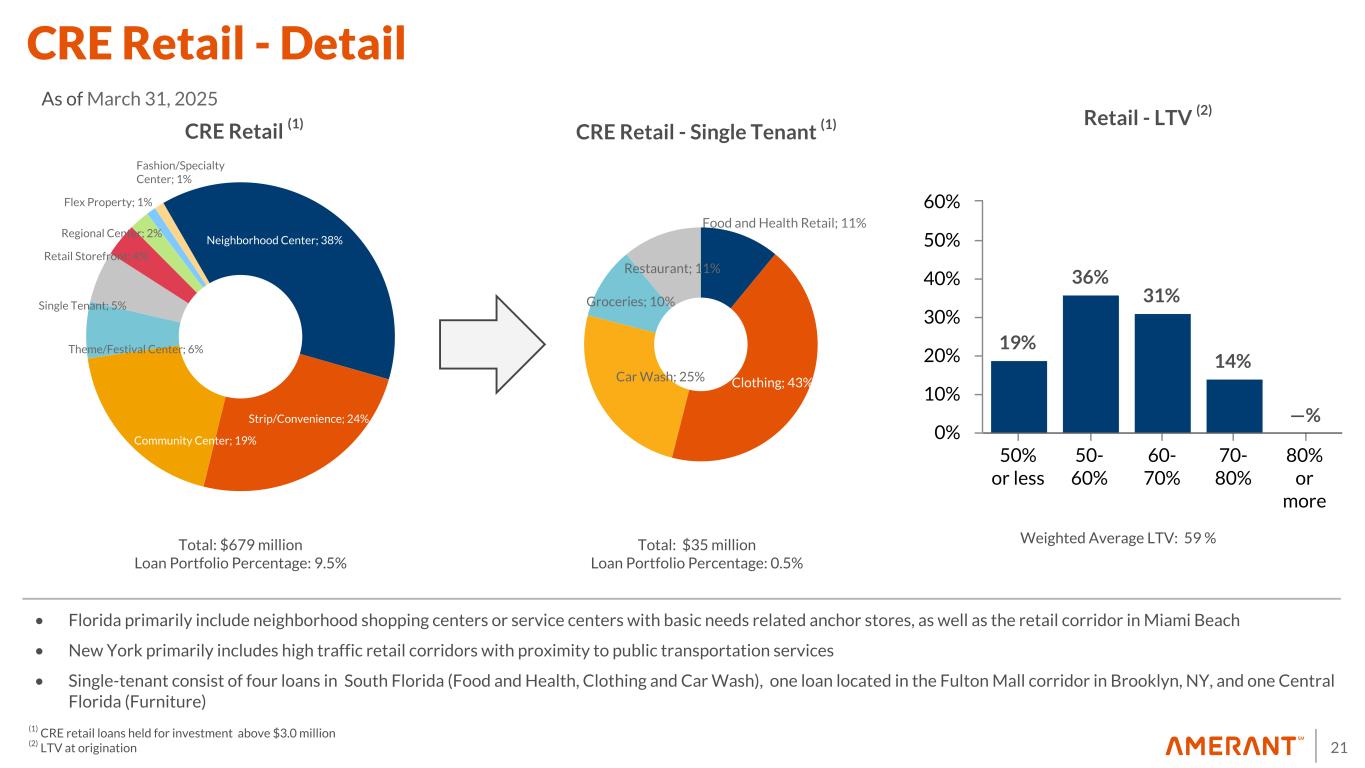
21 19% 36% 31% 14% —% 50% or less 50- 60% 60- 70% 70- 80% 80% or more 0% 10% 20% 30% 40% 50% 60% • Florida primarily include neighborhood shopping centers or service centers with basic needs related anchor stores, as well as the retail corridor in Miami Beach • New York primarily includes high traffic retail corridors with proximity to public transportation services • Single-tenant consist of four loans in South Florida (Food and Health, Clothing and Car Wash), one loan located in the Fulton Mall corridor in Brooklyn, NY, and one Central Florida (Furniture) CRE Retail (1) Retail - LTV (2) Food and Health Retail; 11% Clothing; 43%Car Wash; 25% Groceries; 10% Restaurant; 11% CRE Retail - Single Tenant (1) (1) CRE retail loans held for investment above $3.0 million (2) LTV at origination Total: $679 million Loan Portfolio Percentage: 9.5% Total: $35 million Loan Portfolio Percentage: 0.5% Neighborhood Center; 38% Strip/Convenience; 24% Community Center; 19% Theme/Festival Center; 6% Single Tenant; 5% Retail Storefront; 4% Regional Center; 2% Flex Property; 1% Fashion/Specialty Center; 1% CRE Retail - Detail As of March 31, 2025 Weighted Average LTV: 59 %
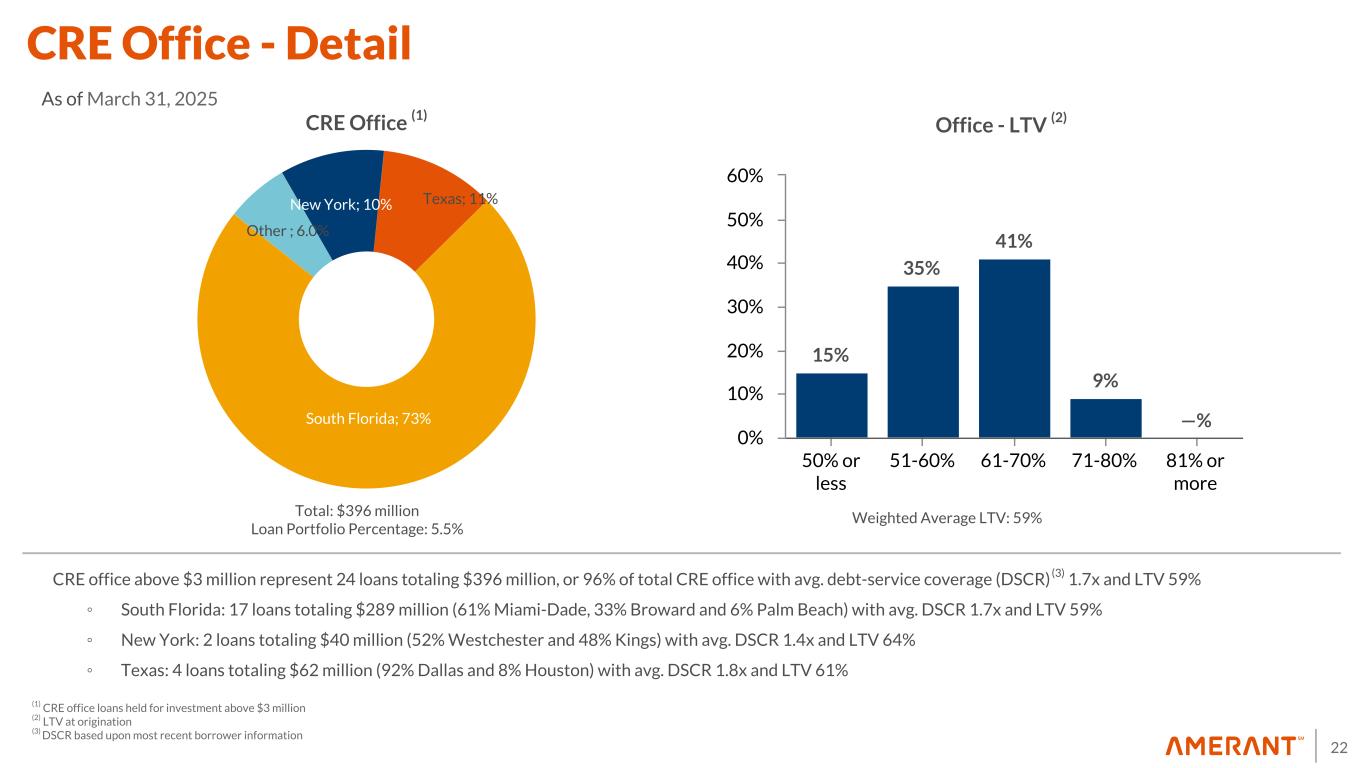
22 New York; 10% Texas; 11% South Florida; 73% Other ; 6.0% 15% 35% 41% 9% —% 50% or less 51-60% 61-70% 71-80% 81% or more 0% 10% 20% 30% 40% 50% 60% CRE office above $3 million represent 24 loans totaling $396 million, or 96% of total CRE office with avg. debt-service coverage (DSCR) (3) 1.7x and LTV 59% ◦ South Florida: 17 loans totaling $289 million (61% Miami-Dade, 33% Broward and 6% Palm Beach) with avg. DSCR 1.7x and LTV 59% ◦ New York: 2 loans totaling $40 million (52% Westchester and 48% Kings) with avg. DSCR 1.4x and LTV 64% ◦ Texas: 4 loans totaling $62 million (92% Dallas and 8% Houston) with avg. DSCR 1.8x and LTV 61% CRE Office (1) Office - LTV (2) (1) CRE office loans held for investment above $3 million (2) LTV at origination (3) DSCR based upon most recent borrower information Total: $396 million Loan Portfolio Percentage: 5.5% CRE Office - Detail As of March 31, 2025 Weighted Average LTV: 59%
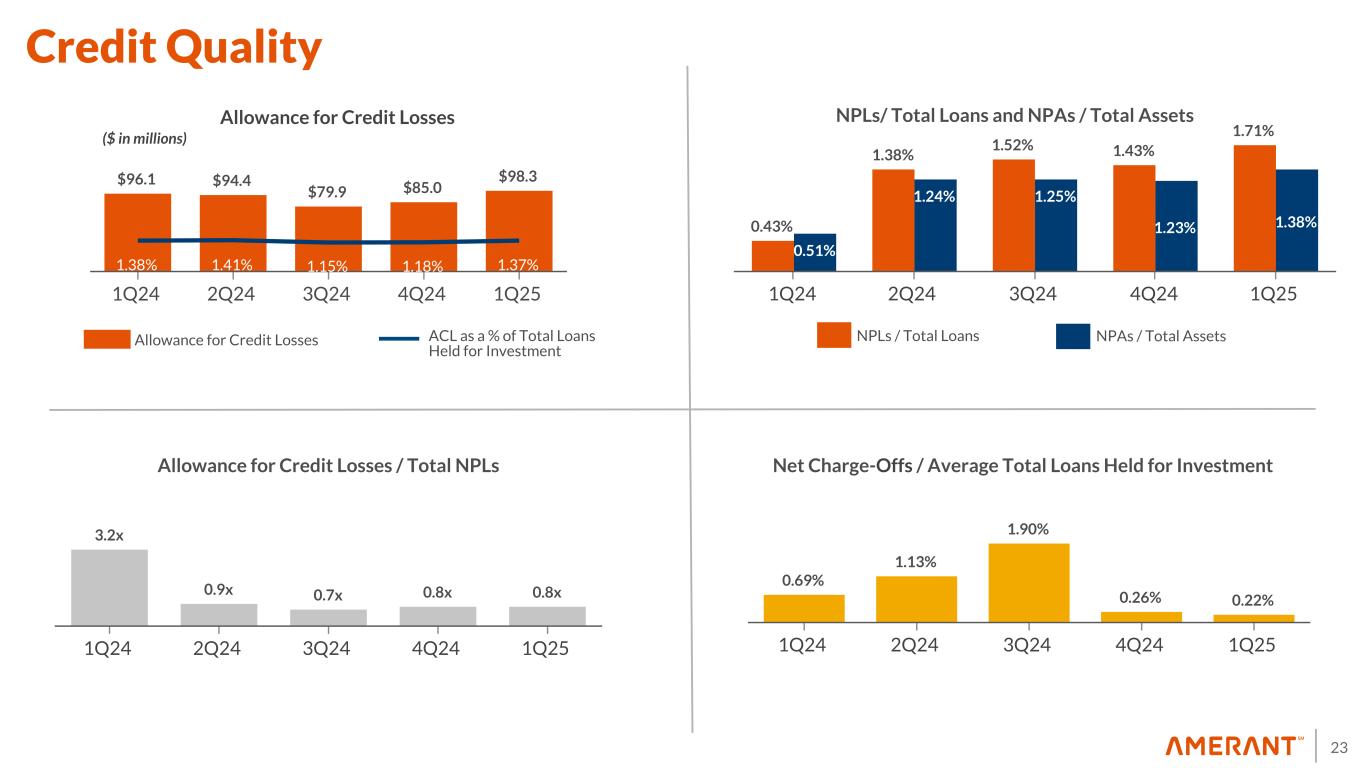
23 0.43% 1.38% 1.52% 1.43% 1.71% 0.51% 1.24% 1.25% 1.23% 1.38% 1Q24 2Q24 3Q24 4Q24 1Q25 3.2x 0.9x 0.7x 0.8x 0.8x 1Q24 2Q24 3Q24 4Q24 1Q25 $96.1 $94.4 $79.9 $85.0 $98.3 1.38% 1.41% 1.15% 1.18% 1.37% 1Q24 2Q24 3Q24 4Q24 1Q25 0.69% 1.13% 1.90% 0.26% 0.22% 1Q24 2Q24 3Q24 4Q24 1Q25 Net Charge-Offs / Average Total Loans Held for Investment Allowance for Credit Losses ($ in millions) NPLs/ Total Loans and NPAs / Total Assets Allowance for Credit Losses / Total NPLs Allowance for Credit Losses ACL as a % of Total Loans Held for Investment NPLs / Total Loans NPAs / Total Assets Credit Quality
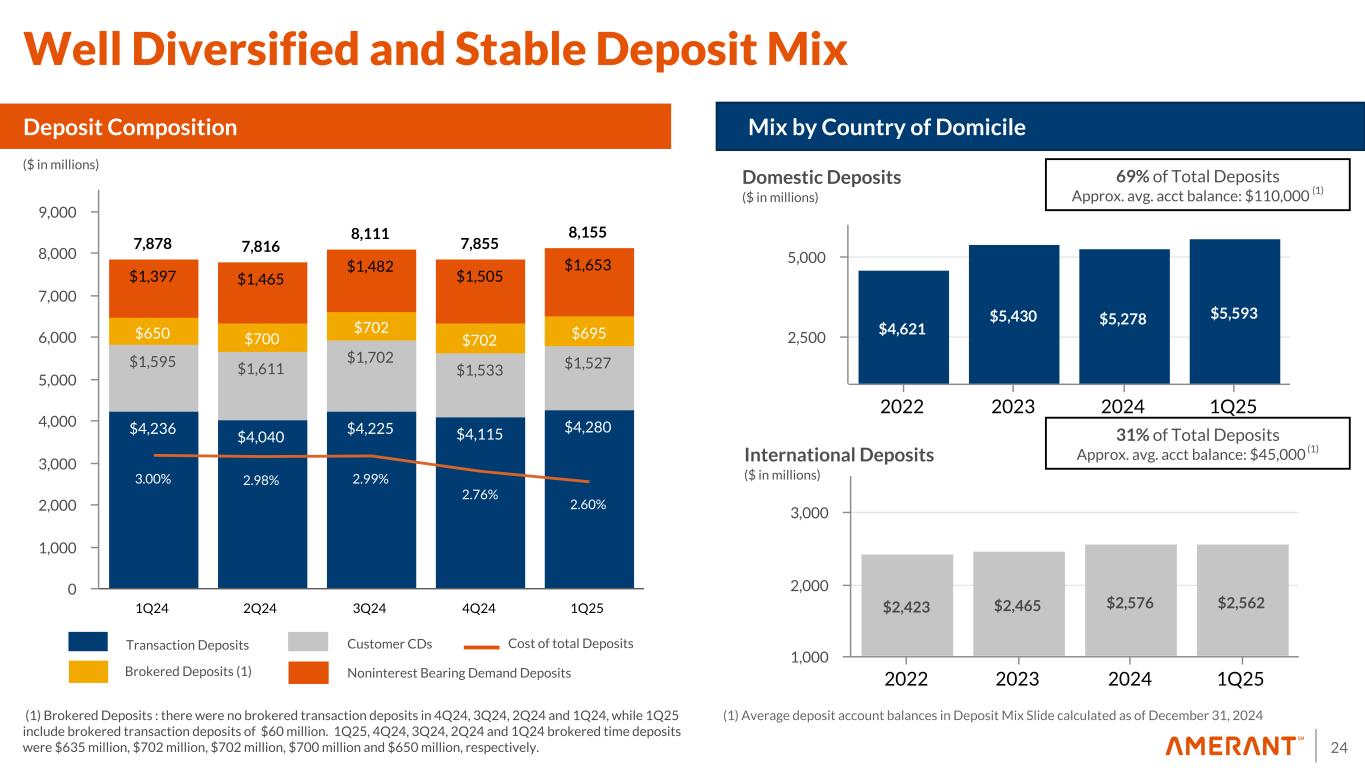
24 7,878 7,816 8,111 7,855 8,155 $4,236 $4,040 $4,225 $4,115 $4,280 $1,595 $1,611 $1,702 $1,533 $1,527 $650 $700 $702 $702 $695 $1,397 $1,465 $1,482 $1,505 $1,653 3.00% 2.98% 2.99% 2.76% 2.60% 1Q24 2Q24 3Q24 4Q24 1Q25 0 1,000 2,000 3,000 4,000 5,000 6,000 7,000 8,000 9,000 $2,423 $2,465 $2,576 $2,562 2022 2023 2024 1Q25 1,000 2,000 3,000 $4,621 $5,430 $5,278 $5,593 2022 2023 2024 1Q25 2,500 5,000 Domestic Deposits ($ in millions) Deposit Composition International Deposits ($ in millions) Mix by Country of Domicile Transaction Deposits Customer CDs Brokered Deposits (1) Cost of total Deposits ($ in millions) Noninterest Bearing Demand Deposits 31% of Total Deposits Approx. avg. acct balance: $45,000 (1) 69% of Total Deposits Approx. avg. acct balance: $110,000 (1) Well Diversified and Stable Deposit Mix (1) Average deposit account balances in Deposit Mix Slide calculated as of December 31, 2024 (1) Brokered Deposits : there were no brokered transaction deposits in 4Q24, 3Q24, 2Q24 and 1Q24, while 1Q25 include brokered transaction deposits of $60 million. 1Q25, 4Q24, 3Q24, 2Q24 and 1Q24 brokered time deposits were $635 million, $702 million, $702 million, $700 million and $650 million, respectively.
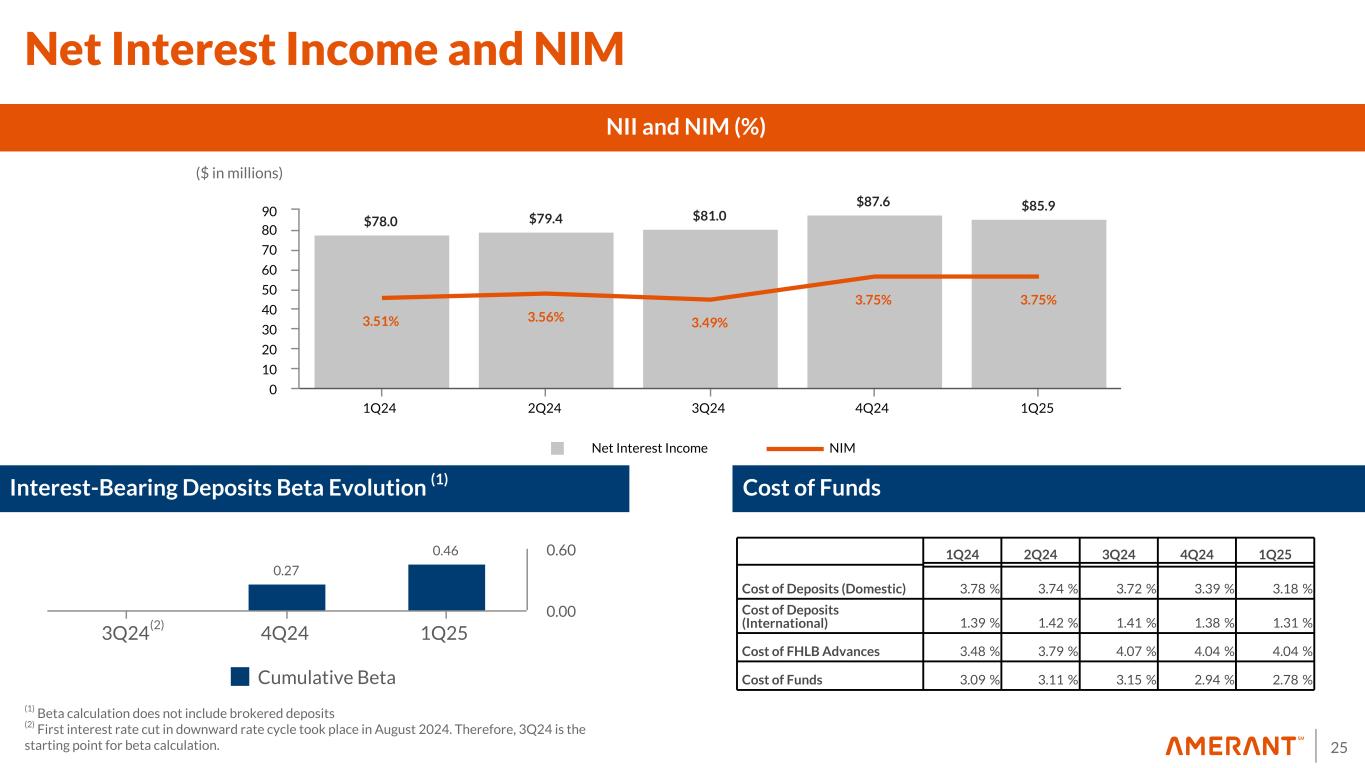
25 $78.0 $79.4 $81.0 $87.6 $85.9 3.51% 3.56% 3.49% 3.75% 3.75% Net Interest Income NIM 1Q24 2Q24 3Q24 4Q24 1Q25 0 10 20 30 40 50 60 70 80 90 NII and NIM (%) 25 ($ in millions) 1Q24 2Q24 3Q24 4Q24 1Q25 Cost of Deposits (Domestic) 3.78 % 3.74 % 3.72 % 3.39 % 3.18 % Cost of Deposits (International) 1.39 % 1.42 % 1.41 % 1.38 % 1.31 % Cost of FHLB Advances 3.48 % 3.79 % 4.07 % 4.04 % 4.04 % Cost of Funds 3.09 % 3.11 % 3.15 % 2.94 % 2.78 % 0.27 0.46 Cumulative Beta 3Q24 4Q24 1Q25 0.00 0.60 Net Interest Income and NIM Interest-Bearing Deposits Beta Evolution (1) Cost of Funds (1) Beta calculation does not include brokered deposits (2) First interest rate cut in downward rate cycle took place in August 2024. Therefore, 3Q24 is the starting point for beta calculation. (2)
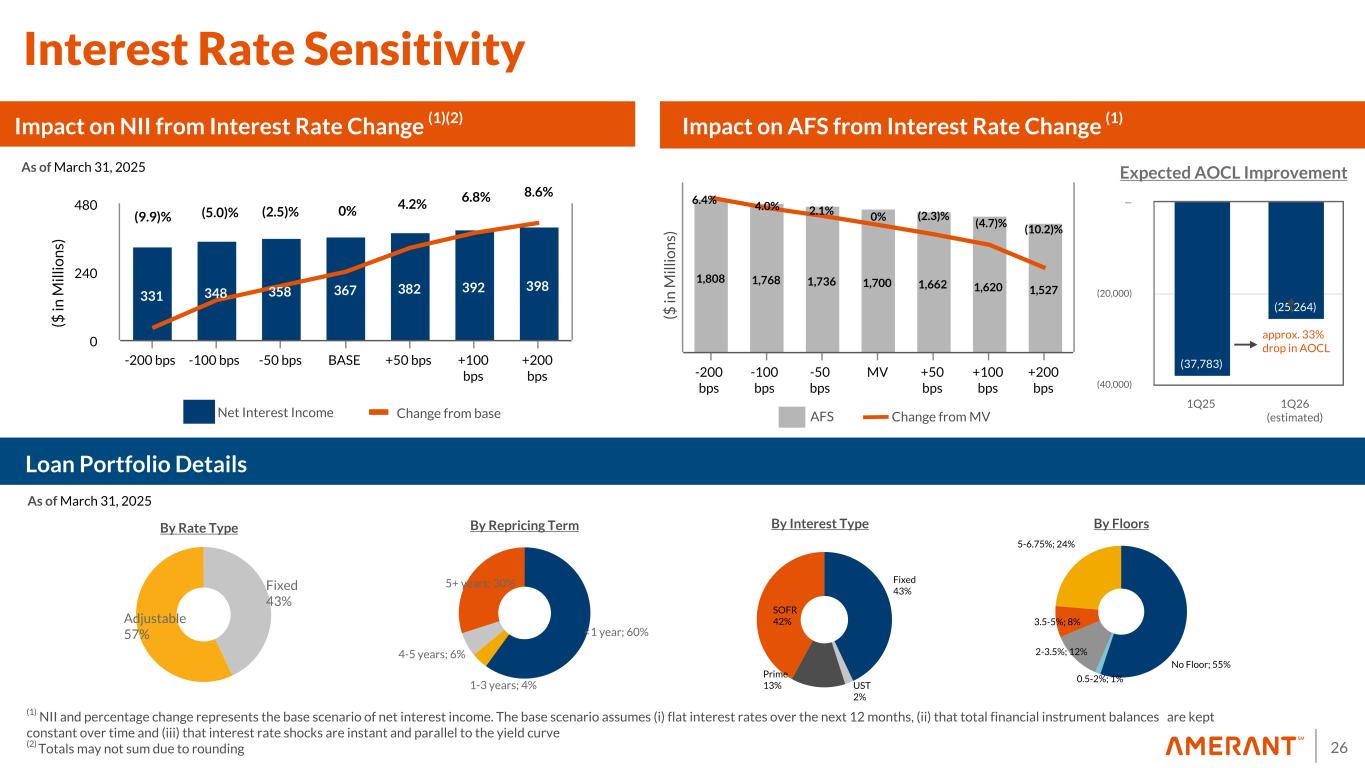
26 <1 year; 60% 1-3 years; 4% 4-5 years; 6% 5+ years; 30% 331 348 358 367 382 392 398 -200 bps -100 bps -50 bps BASE +50 bps +100 bps +200 bps 0 240 480 As of March 31, 2025 Fixed 43% Adjustable 57% 26 By Interest TypeBy Rate Type By Repricing Term (1) NII and percentage change represents the base scenario of net interest income. The base scenario assumes (i) flat interest rates over the next 12 months, (ii) that total financial instrument balances are kept constant over time and (iii) that interest rate shocks are instant and parallel to the yield curve (2) Totals may not sum due to rounding Loan Portfolio Details Impact on NII from Interest Rate Change (1)(2) AFSChange from base ($ in M ill io n s) Fixed 43% UST 2% Prime 13% SOFR 42% As of March 31, 2025 Impact on AFS from Interest Rate Change (1) (9.9)% (5.0)% 0% 6.8%4.2% (2.5)% 8.6% No Floor; 55% 0.5-2%; 1% 2-3.5%; 12% 3.5-5%; 8% 5-6.75%; 24% By Floors 1,808 1,768 1,736 1,700 1,662 1,620 1,527 -200 bps -100 bps -50 bps MV +50 bps +100 bps +200 bps ($ in M ill io n s) 6.4% 4.0% 2.1% 0% (2.3)% (4.7)% (10.2)% Expected AOCL Improvement Change from MVNet Interest Income (37,783) (25,264) 1Q25 1Q26 (estimated) (40,000) (20,000) — approx. 33% drop in AOCL Interest Rate Sensitivity
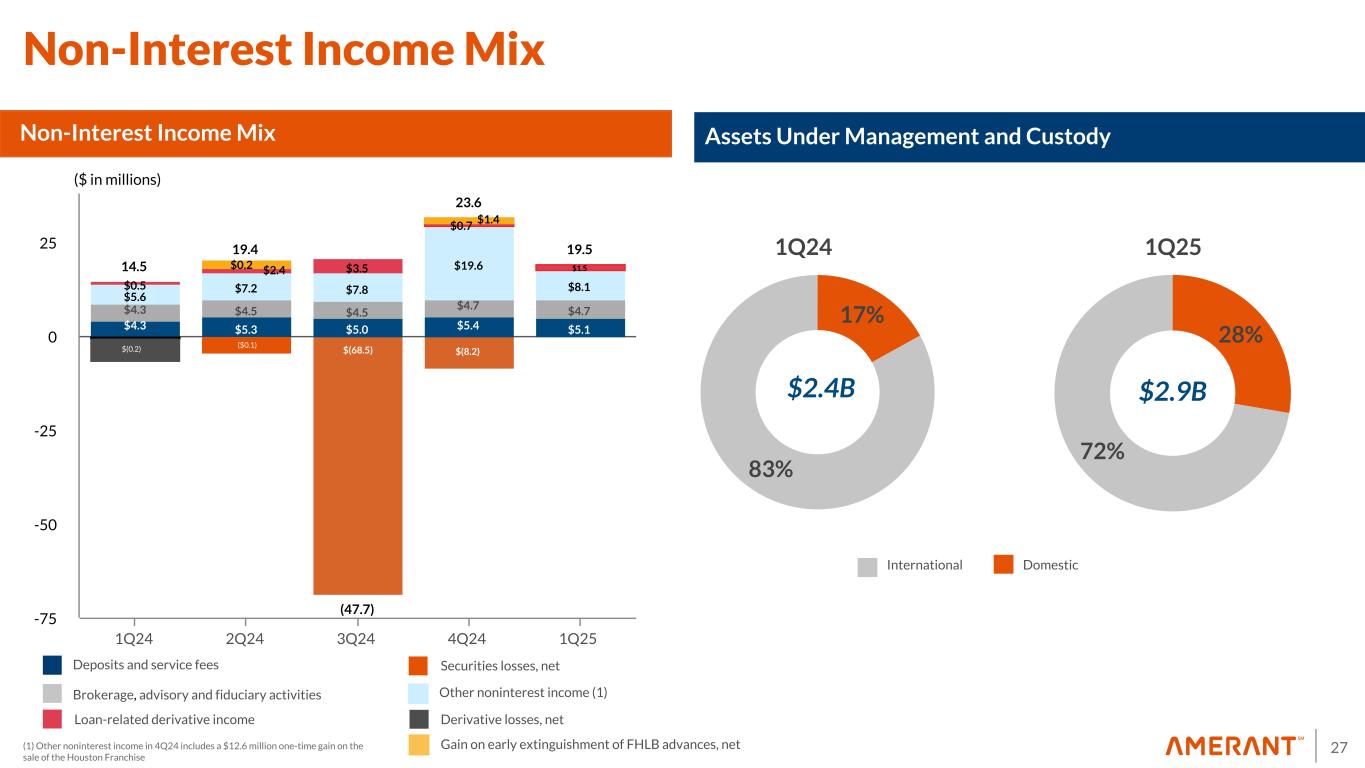
27 14.5 19.4 23.6 19.5 (47.7) $4.3 $5.3 $5.0 $5.4 $5.1 $4.3 $4.5 $4.5 $4.7 $4.7 $(68.5) $(8.2) $5.6 $7.2 $7.8 $19.6 $8.1$0.5 $3.5 $1.5 1Q24 2Q24 3Q24 4Q24 1Q25 -75 -50 -25 0 25 17% 83% 28% 72% Non-Interest Income Mix Deposits and service fees Brokerage, advisory and fiduciary activities Other noninterest income (1) DomesticInternational 1Q24 $2.9B ($ in millions) Securities losses, net Loan-related derivative income Derivative losses, net Gain on early extinguishment of FHLB advances, net Non-Interest Income Mix $2.4B Assets Under Management and Custody 1Q25 $(0.2) (1) Other noninterest income in 4Q24 includes a $12.6 million one-time gain on the sale of the Houston Franchise $(0.2) ($0.1) $1.4 $0.7 $2.4$0.2
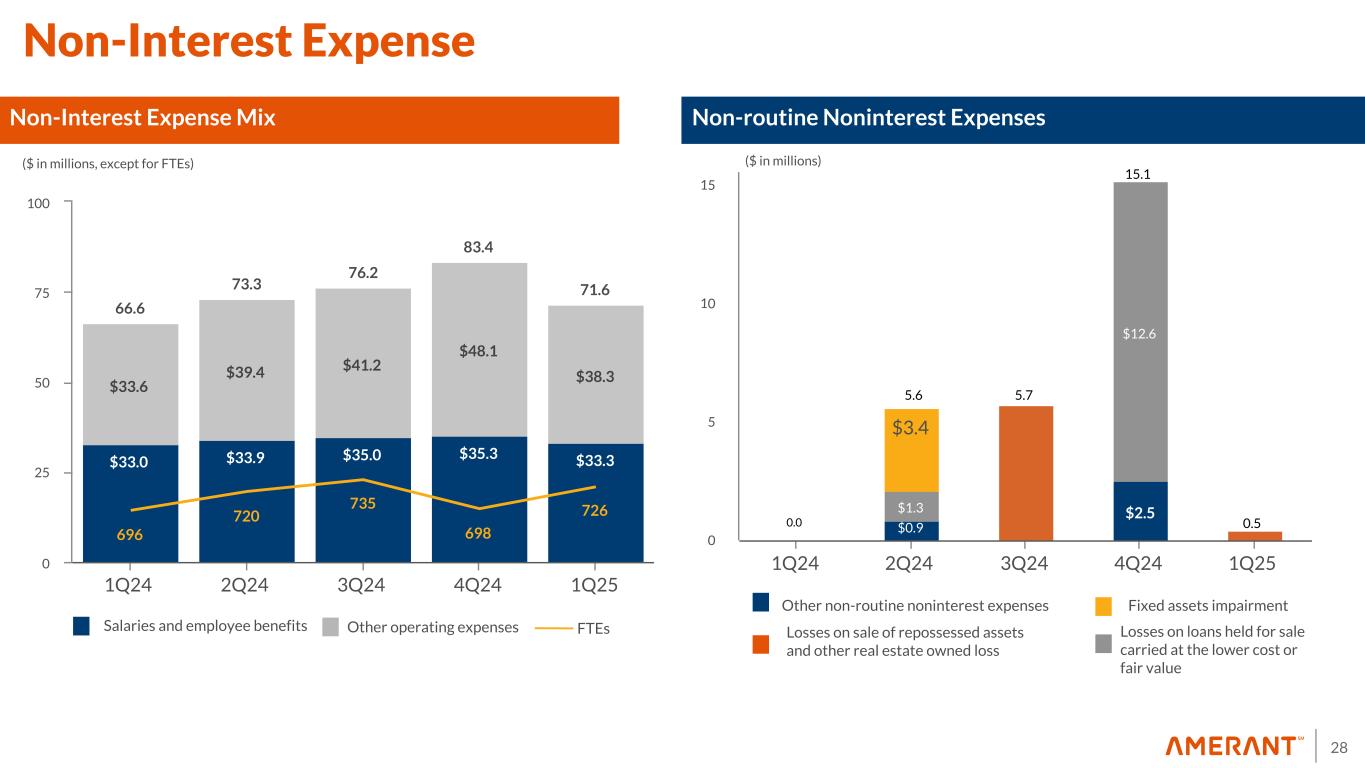
28 66.6 73.3 76.2 83.4 71.6 $33.0 $33.9 $35.0 $35.3 $33.3 $33.6 $39.4 $41.2 $48.1 $38.3 696 720 735 698 726 1Q24 2Q24 3Q24 4Q24 1Q25 0 25 50 75 100 Non-Interest Expense Mix ($ in millions, except for FTEs) Non-routine Noninterest Expenses $0.9 $2.5$1.3 $12.6 $3.4 1Q24 2Q24 3Q24 4Q24 1Q25 0 5 10 15 ($ in millions) Non-Interest Expense Salaries and employee benefits Other operating expenses FTEs Other non-routine noninterest expenses Losses on loans held for sale carried at the lower cost or fair value Fixed assets impairment Losses on sale of repossessed assets and other real estate owned loss .9 0.0 5.6 5.7 15.1 0.5
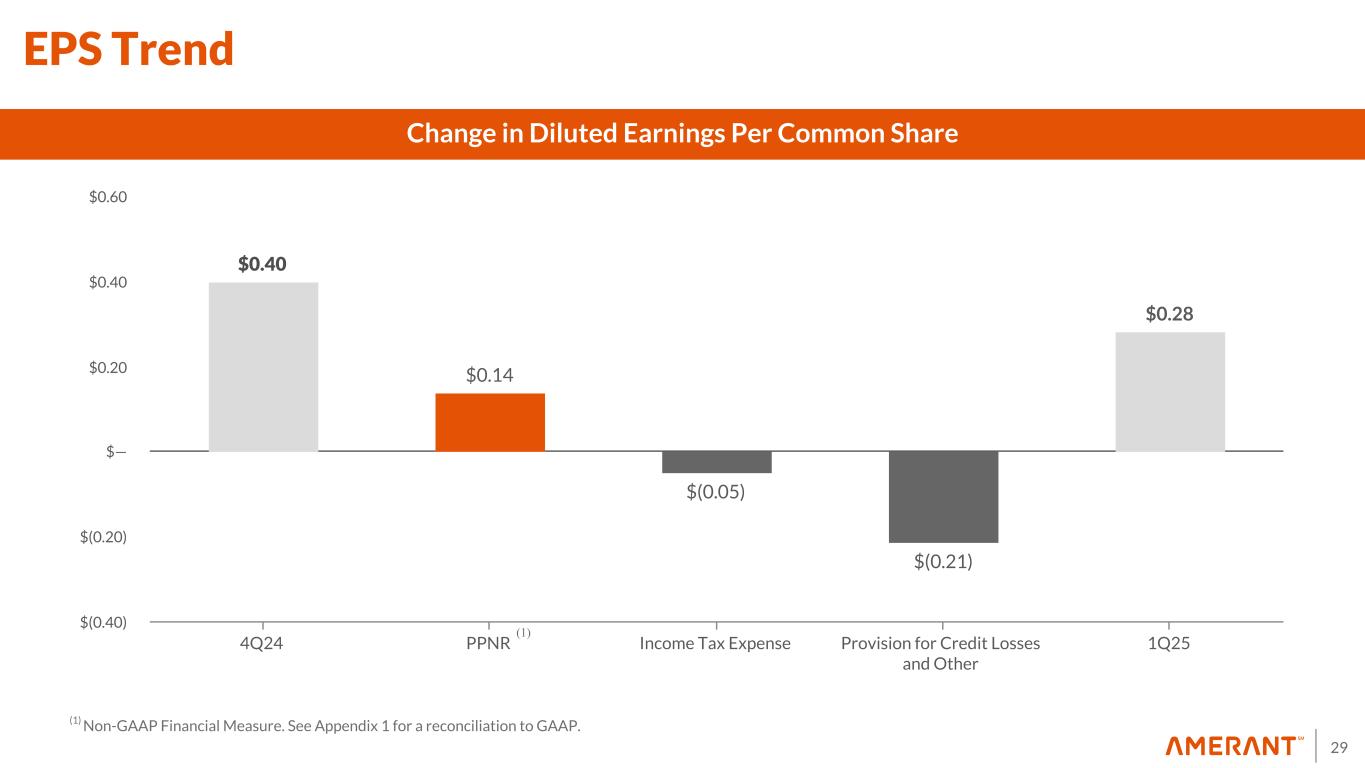
29 Change in Diluted Earnings Per Common Share $0.40 $0.14 $(0.05) $(0.21) $0.28 4Q24 PPNR Income Tax Expense Provision for Credit Losses and Other 1Q25 $(0.40) $(0.20) $— $0.20 $0.40 $0.60 EPS Trend (1) Non-GAAP Financial Measure. See Appendix 1 for a reconciliation to GAAP. (1)

Appendices
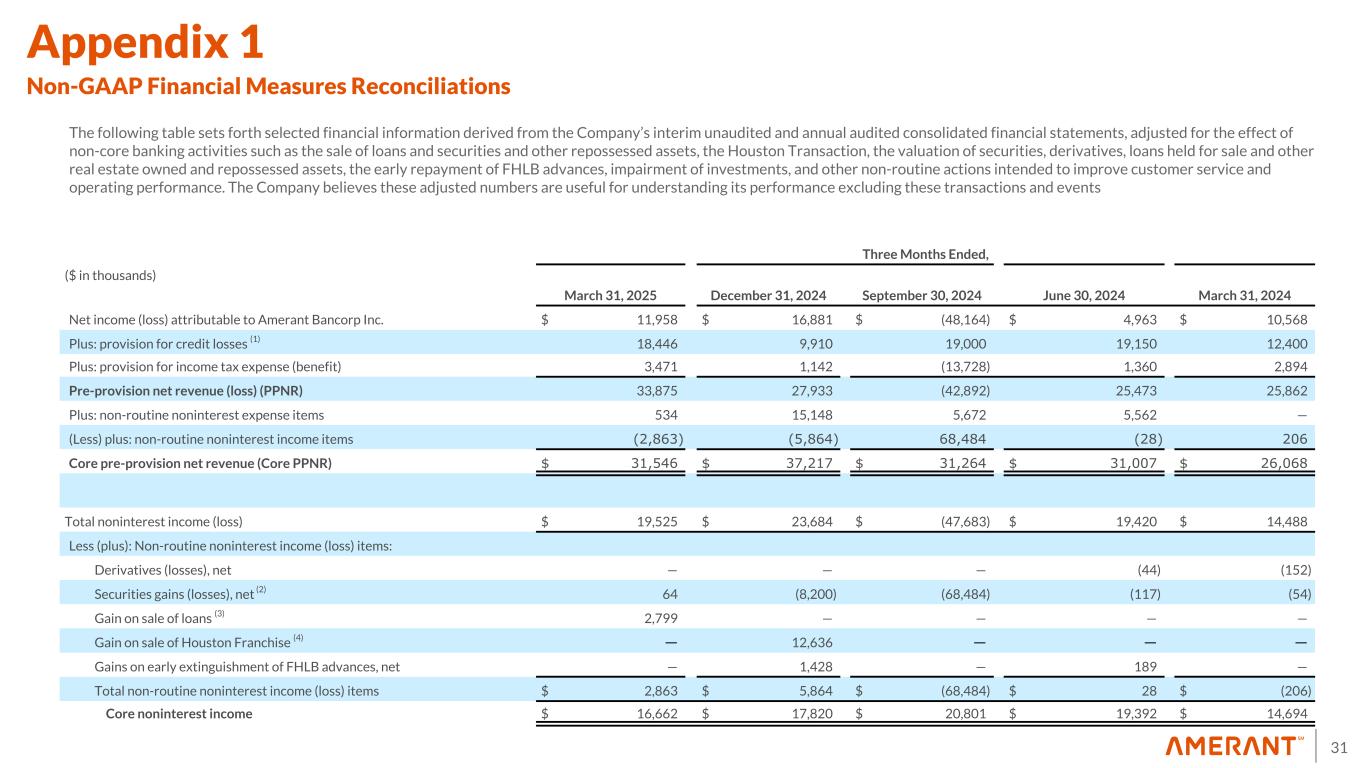
31 Appendix 1 Non-GAAP Financial Measures Reconciliations The following table sets forth selected financial information derived from the Company’s interim unaudited and annual audited consolidated financial statements, adjusted for the effect of non-core banking activities such as the sale of loans and securities and other repossessed assets, the Houston Transaction, the valuation of securities, derivatives, loans held for sale and other real estate owned and repossessed assets, the early repayment of FHLB advances, impairment of investments, and other non-routine actions intended to improve customer service and operating performance. The Company believes these adjusted numbers are useful for understanding its performance excluding these transactions and events Three Months Ended, ($ in thousands) March 31, 2025 December 31, 2024 September 30, 2024 June 30, 2024 March 31, 2024 Net income (loss) attributable to Amerant Bancorp Inc. $ 11,958 $ 16,881 $ (48,164) $ 4,963 $ 10,568 Plus: provision for credit losses (1) 18,446 9,910 19,000 19,150 12,400 Plus: provision for income tax expense (benefit) 3,471 1,142 (13,728) 1,360 2,894 Pre-provision net revenue (loss) (PPNR) 33,875 27,933 (42,892) 25,473 25,862 Plus: non-routine noninterest expense items 534 15,148 5,672 5,562 — (Less) plus: non-routine noninterest income items (2,863) (5,864) 68,484 (28) 206 Core pre-provision net revenue (Core PPNR) $ 31,546 $ 37,217 $ 31,264 $ 31,007 $ 26,068 Total noninterest income (loss) $ 19,525 $ 23,684 $ (47,683) $ 19,420 $ 14,488 Less (plus): Non-routine noninterest income (loss) items: Derivatives (losses), net — — — (44) (152) Securities gains (losses), net (2) 64 (8,200) (68,484) (117) (54) Gain on sale of loans (3) 2,799 — — — — Gain on sale of Houston Franchise (4) — 12,636 — — — Gains on early extinguishment of FHLB advances, net — 1,428 — 189 — Total non-routine noninterest income (loss) items $ 2,863 $ 5,864 $ (68,484) $ 28 $ (206) Core noninterest income $ 16,662 $ 17,820 $ 20,801 $ 19,392 $ 14,694
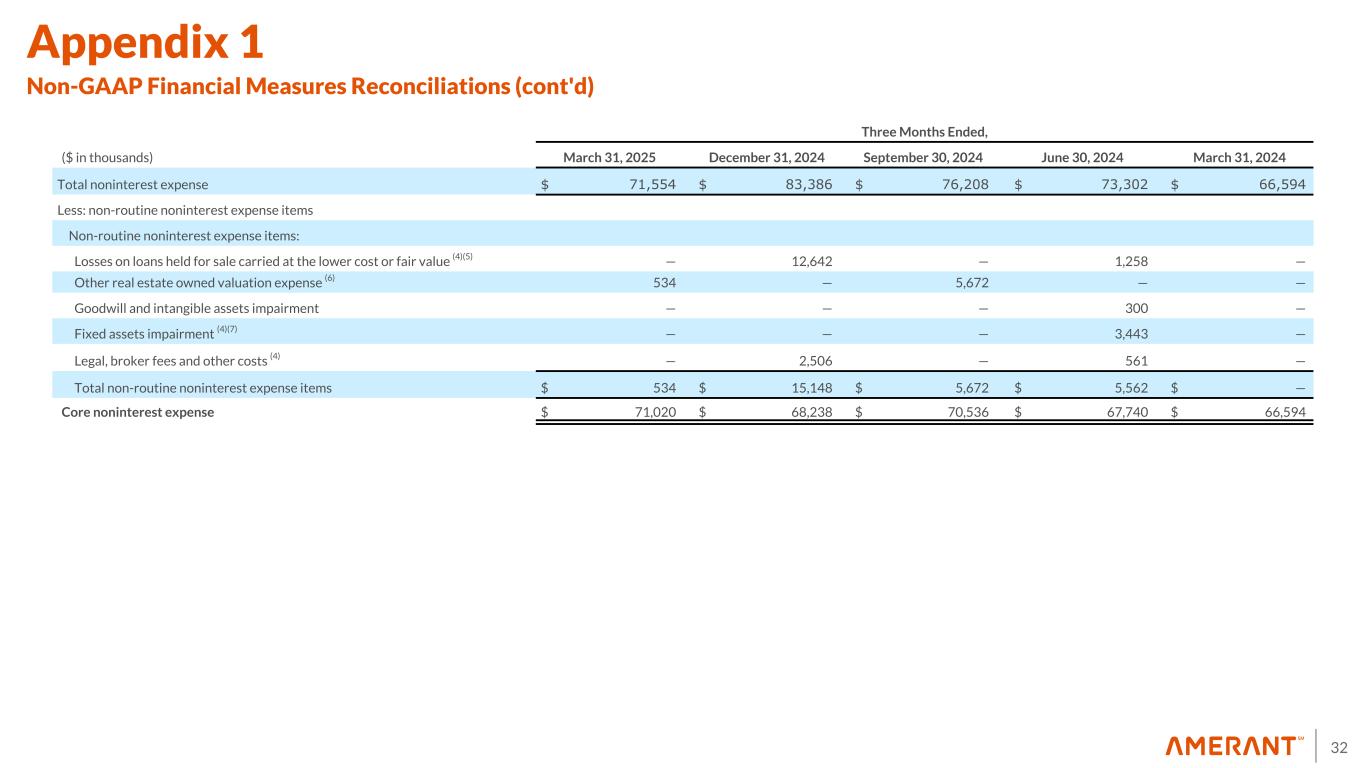
32 Three Months Ended, ($ in thousands) March 31, 2025 December 31, 2024 September 30, 2024 June 30, 2024 March 31, 2024 Total noninterest expense $ 71,554 $ 83,386 $ 76,208 $ 73,302 $ 66,594 Less: non-routine noninterest expense items Non-routine noninterest expense items: Losses on loans held for sale carried at the lower cost or fair value (4)(5) — 12,642 — 1,258 — Other real estate owned valuation expense (6) 534 — 5,672 — — Goodwill and intangible assets impairment — — — 300 — Fixed assets impairment (4)(7) — — — 3,443 — Legal, broker fees and other costs (4) — 2,506 — 561 — Total non-routine noninterest expense items $ 534 $ 15,148 $ 5,672 $ 5,562 $ — Core noninterest expense $ 71,020 $ 68,238 $ 70,536 $ 67,740 $ 66,594 Appendix 1 Non-GAAP Financial Measures Reconciliations (cont'd)
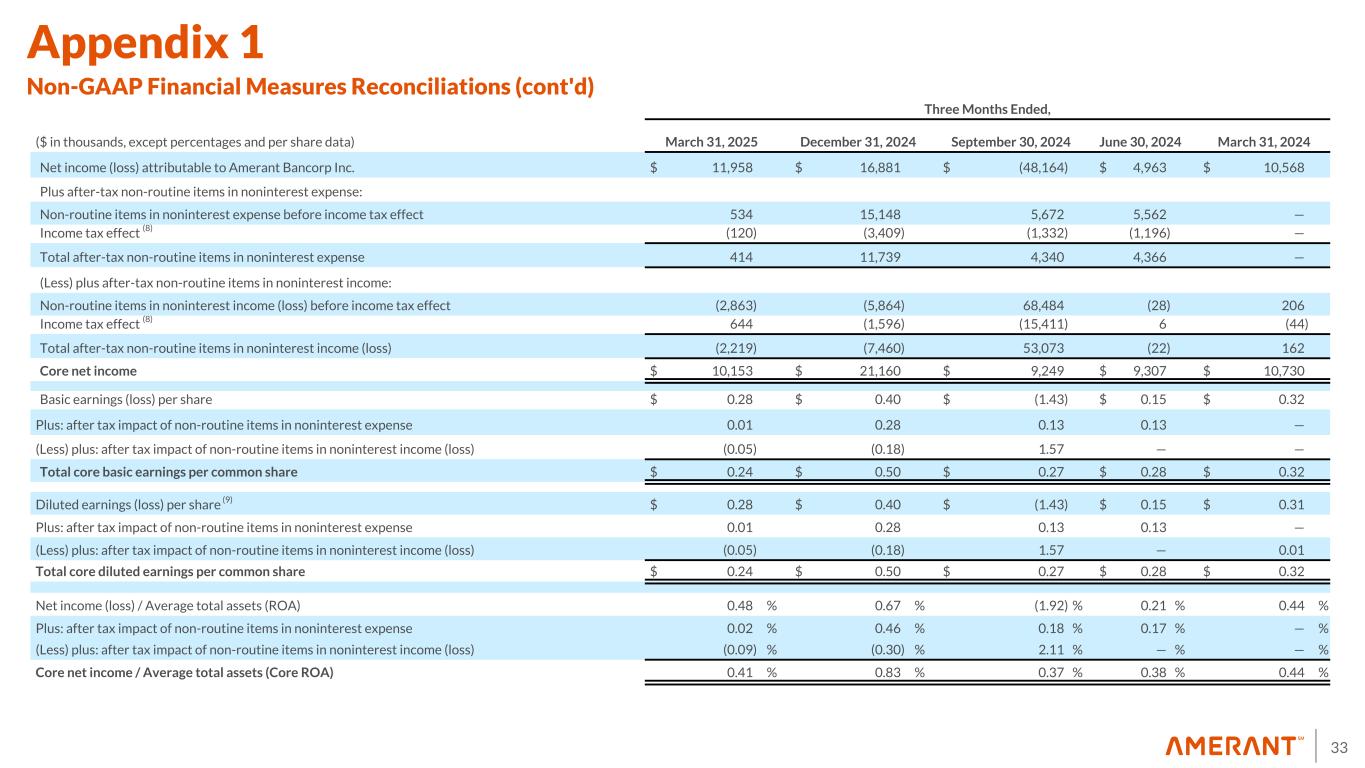
33 Three Months Ended, ($ in thousands, except percentages and per share data) March 31, 2025 December 31, 2024 September 30, 2024 June 30, 2024 March 31, 2024 Net income (loss) attributable to Amerant Bancorp Inc. $ 11,958 $ 16,881 $ (48,164) $ 4,963 $ 10,568 Plus after-tax non-routine items in noninterest expense: Non-routine items in noninterest expense before income tax effect 534 15,148 5,672 5,562 — Income tax effect (8) (120) (3,409) (1,332) (1,196) — Total after-tax non-routine items in noninterest expense 414 11,739 4,340 4,366 — (Less) plus after-tax non-routine items in noninterest income: Non-routine items in noninterest income (loss) before income tax effect (2,863) (5,864) 68,484 (28) 206 Income tax effect (8) 644 (1,596) (15,411) 6 (44) Total after-tax non-routine items in noninterest income (loss) (2,219) (7,460) 53,073 (22) 162 Core net income $ 10,153 $ 21,160 $ 9,249 $ 9,307 $ 10,730 Basic earnings (loss) per share $ 0.28 $ 0.40 $ (1.43) $ 0.15 $ 0.32 Plus: after tax impact of non-routine items in noninterest expense 0.01 0.28 0.13 0.13 — (Less) plus: after tax impact of non-routine items in noninterest income (loss) (0.05) (0.18) 1.57 — — Total core basic earnings per common share $ 0.24 $ 0.50 $ 0.27 $ 0.28 $ 0.32 Diluted earnings (loss) per share (9) $ 0.28 $ 0.40 $ (1.43) $ 0.15 $ 0.31 Plus: after tax impact of non-routine items in noninterest expense 0.01 0.28 0.13 0.13 — (Less) plus: after tax impact of non-routine items in noninterest income (loss) (0.05) (0.18) 1.57 — 0.01 Total core diluted earnings per common share $ 0.24 $ 0.50 $ 0.27 $ 0.28 $ 0.32 Net income (loss) / Average total assets (ROA) 0.48 % 0.67 % (1.92) % 0.21 % 0.44 % Plus: after tax impact of non-routine items in noninterest expense 0.02 % 0.46 % 0.18 % 0.17 % — % (Less) plus: after tax impact of non-routine items in noninterest income (loss) (0.09) % (0.30) % 2.11 % — % — % Core net income / Average total assets (Core ROA) 0.41 % 0.83 % 0.37 % 0.38 % 0.44 % Appendix 1 Non-GAAP Financial Measures Reconciliations (cont'd)
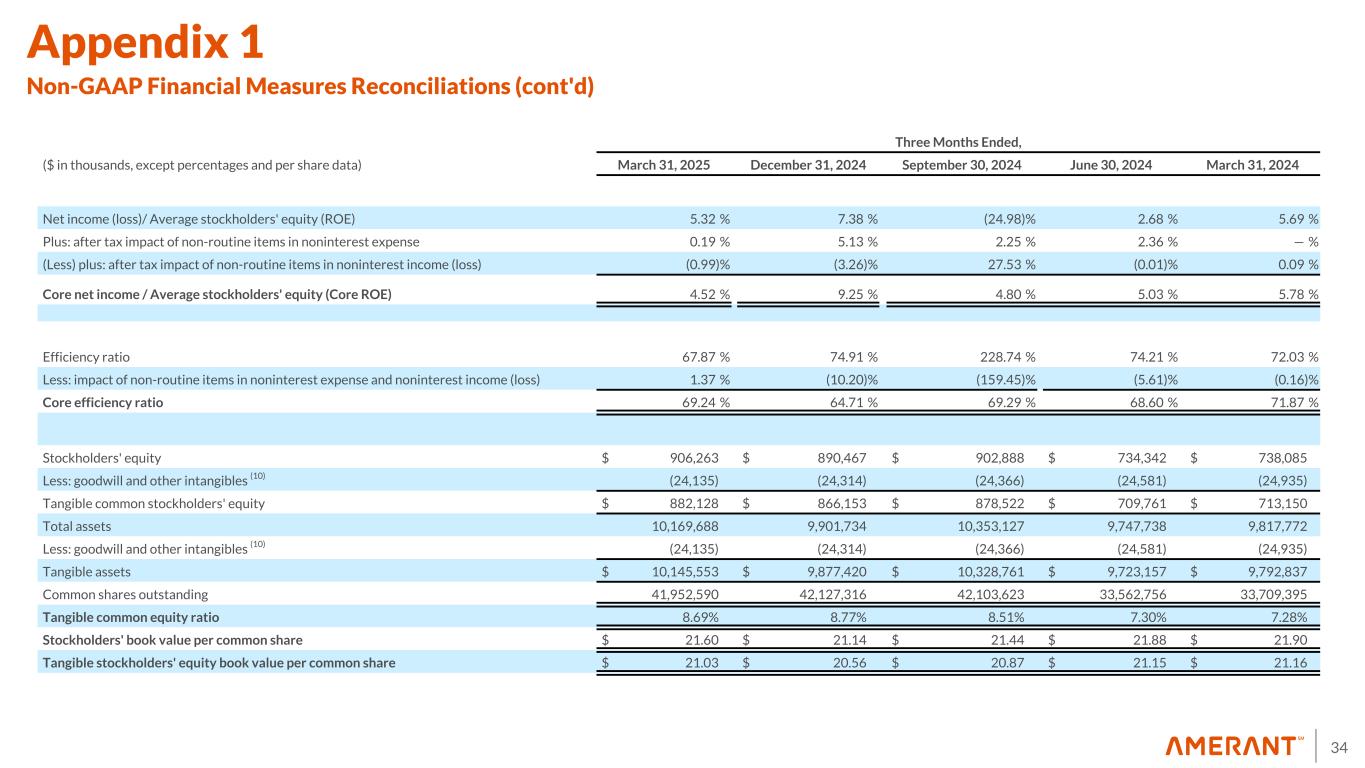
34 Three Months Ended, ($ in thousands, except percentages and per share data) March 31, 2025 December 31, 2024 September 30, 2024 June 30, 2024 March 31, 2024 Net income (loss)/ Average stockholders' equity (ROE) 5.32 % 7.38 % (24.98) % 2.68 % 5.69 % Plus: after tax impact of non-routine items in noninterest expense 0.19 % 5.13 % 2.25 % 2.36 % — % (Less) plus: after tax impact of non-routine items in noninterest income (loss) (0.99) % (3.26) % 27.53 % (0.01) % 0.09 % Core net income / Average stockholders' equity (Core ROE) 4.52 % 9.25 % 4.80 % 5.03 % 5.78 % Efficiency ratio 67.87 % 74.91 % 228.74 % 74.21 % 72.03 % Less: impact of non-routine items in noninterest expense and noninterest income (loss) 1.37 % (10.20) % (159.45) % (5.61) % (0.16) % Core efficiency ratio 69.24 % 64.71 % 69.29 % 68.60 % 71.87 % Stockholders' equity $ 906,263 $ 890,467 $ 902,888 $ 734,342 $ 738,085 Less: goodwill and other intangibles (10) (24,135) (24,314) (24,366) (24,581) (24,935) Tangible common stockholders' equity $ 882,128 $ 866,153 $ 878,522 $ 709,761 $ 713,150 Total assets 10,169,688 9,901,734 10,353,127 9,747,738 9,817,772 Less: goodwill and other intangibles (10) (24,135) (24,314) (24,366) (24,581) (24,935) Tangible assets $ 10,145,553 $ 9,877,420 $ 10,328,761 $ 9,723,157 $ 9,792,837 Common shares outstanding 41,952,590 42,127,316 42,103,623 33,562,756 33,709,395 Tangible common equity ratio 8.69 % 8.77 % 8.51 % 7.30 % 7.28 % Stockholders' book value per common share $ 21.60 $ 21.14 $ 21.44 $ 21.88 $ 21.90 Tangible stockholders' equity book value per common share $ 21.03 $ 20.56 $ 20.87 $ 21.15 $ 21.16 Appendix 1 Non-GAAP Financial Measures Reconciliations (cont'd)
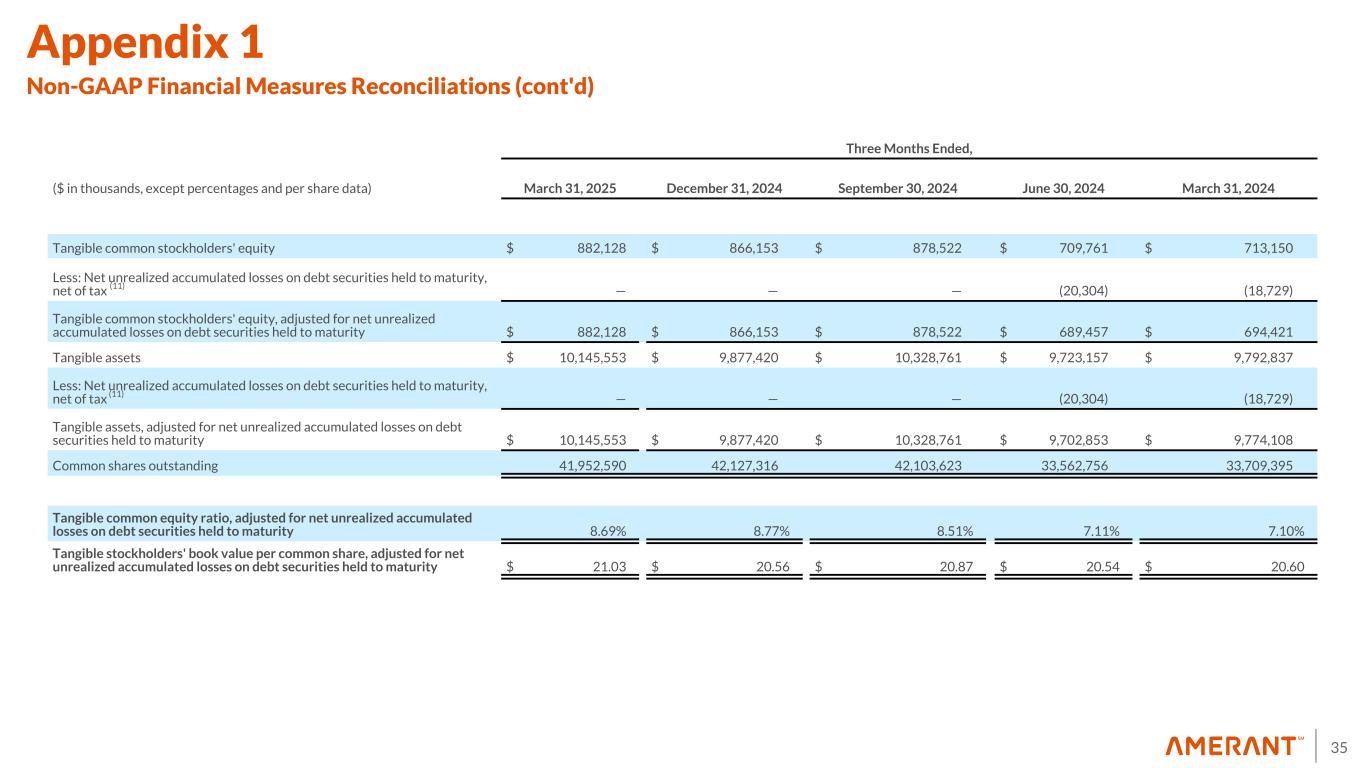
35 Three Months Ended, ($ in thousands, except percentages and per share data) March 31, 2025 December 31, 2024 September 30, 2024 June 30, 2024 March 31, 2024 Tangible common stockholders' equity $ 882,128 $ 866,153 $ 878,522 $ 709,761 $ 713,150 Less: Net unrealized accumulated losses on debt securities held to maturity, net of tax (11) — — — (20,304) (18,729) Tangible common stockholders' equity, adjusted for net unrealized accumulated losses on debt securities held to maturity $ 882,128 $ 866,153 $ 878,522 $ 689,457 $ 694,421 Tangible assets $ 10,145,553 $ 9,877,420 $ 10,328,761 $ 9,723,157 $ 9,792,837 Less: Net unrealized accumulated losses on debt securities held to maturity, net of tax (11) — — — (20,304) (18,729) Tangible assets, adjusted for net unrealized accumulated losses on debt securities held to maturity $ 10,145,553 $ 9,877,420 $ 10,328,761 $ 9,702,853 $ 9,774,108 Common shares outstanding 41,952,590 42,127,316 42,103,623 33,562,756 33,709,395 Tangible common equity ratio, adjusted for net unrealized accumulated losses on debt securities held to maturity 8.69 % 8.77 % 8.51 % 7.11 % 7.10 % Tangible stockholders' book value per common share, adjusted for net unrealized accumulated losses on debt securities held to maturity $ 21.03 $ 20.56 $ 20.87 $ 20.54 $ 20.60 Appendix 1 Non-GAAP Financial Measures Reconciliations (cont'd)
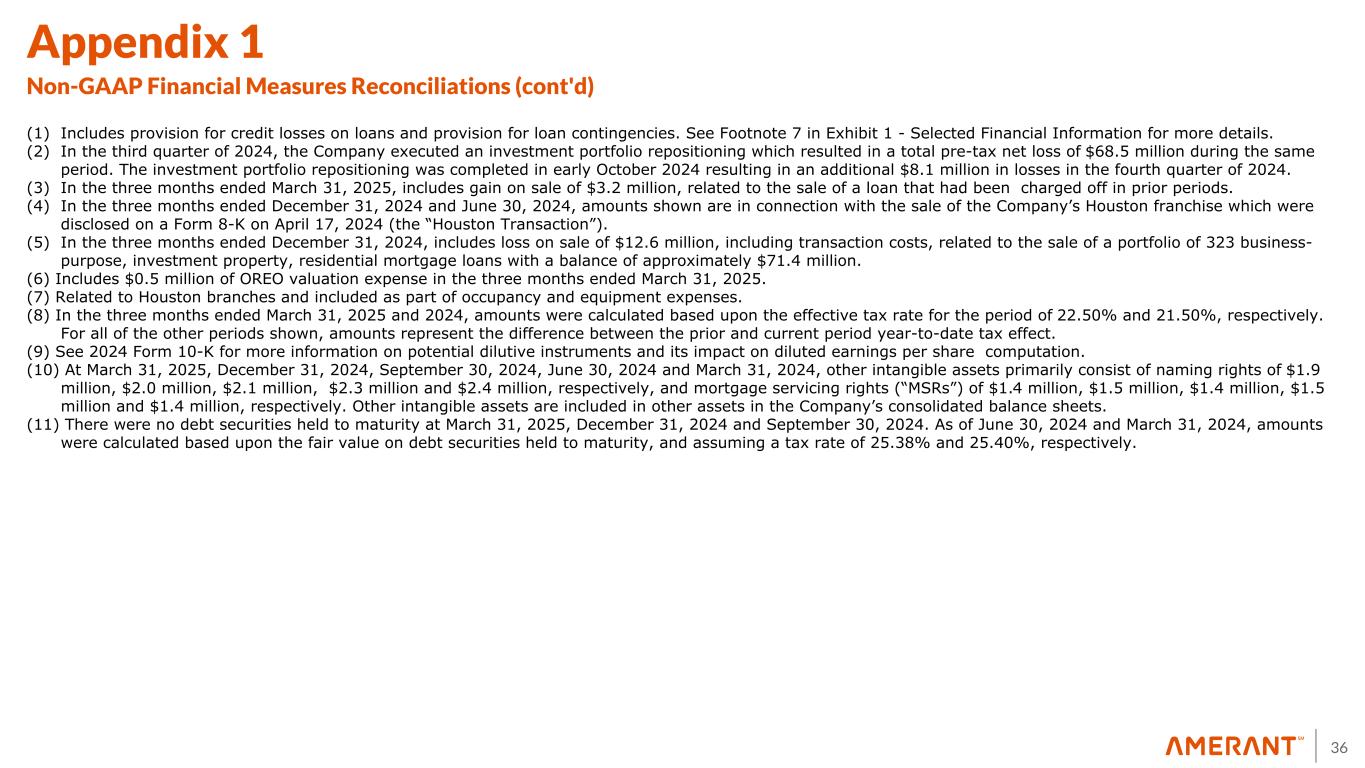
36 Appendix 1 Non-GAAP Financial Measures Reconciliations (cont'd) (1) Includes provision for credit losses on loans and provision for loan contingencies. See Footnote 7 in Exhibit 1 - Selected Financial Information for more details. (2) In the third quarter of 2024, the Company executed an investment portfolio repositioning which resulted in a total pre-tax net loss of $68.5 million during the same period. The investment portfolio repositioning was completed in early October 2024 resulting in an additional $8.1 million in losses in the fourth quarter of 2024. (3) In the three months ended March 31, 2025, includes gain on sale of $3.2 million, related to the sale of a loan that had been charged off in prior periods. (4) In the three months ended December 31, 2024 and June 30, 2024, amounts shown are in connection with the sale of the Company’s Houston franchise which were disclosed on a Form 8-K on April 17, 2024 (the “Houston Transaction”). (5) In the three months ended December 31, 2024, includes loss on sale of $12.6 million, including transaction costs, related to the sale of a portfolio of 323 business- purpose, investment property, residential mortgage loans with a balance of approximately $71.4 million. (6) Includes $0.5 million of OREO valuation expense in the three months ended March 31, 2025. (7) Related to Houston branches and included as part of occupancy and equipment expenses. (8) In the three months ended March 31, 2025 and 2024, amounts were calculated based upon the effective tax rate for the period of 22.50% and 21.50%, respectively. For all of the other periods shown, amounts represent the difference between the prior and current period year-to-date tax effect. (9) See 2024 Form 10-K for more information on potential dilutive instruments and its impact on diluted earnings per share computation. (10) At March 31, 2025, December 31, 2024, September 30, 2024, June 30, 2024 and March 31, 2024, other intangible assets primarily consist of naming rights of $1.9 million, $2.0 million, $2.1 million, $2.3 million and $2.4 million, respectively, and mortgage servicing rights (“MSRs”) of $1.4 million, $1.5 million, $1.4 million, $1.5 million and $1.4 million, respectively. Other intangible assets are included in other assets in the Company’s consolidated balance sheets. (11) There were no debt securities held to maturity at March 31, 2025, December 31, 2024 and September 30, 2024. As of June 30, 2024 and March 31, 2024, amounts were calculated based upon the fair value on debt securities held to maturity, and assuming a tax rate of 25.38% and 25.40%, respectively.
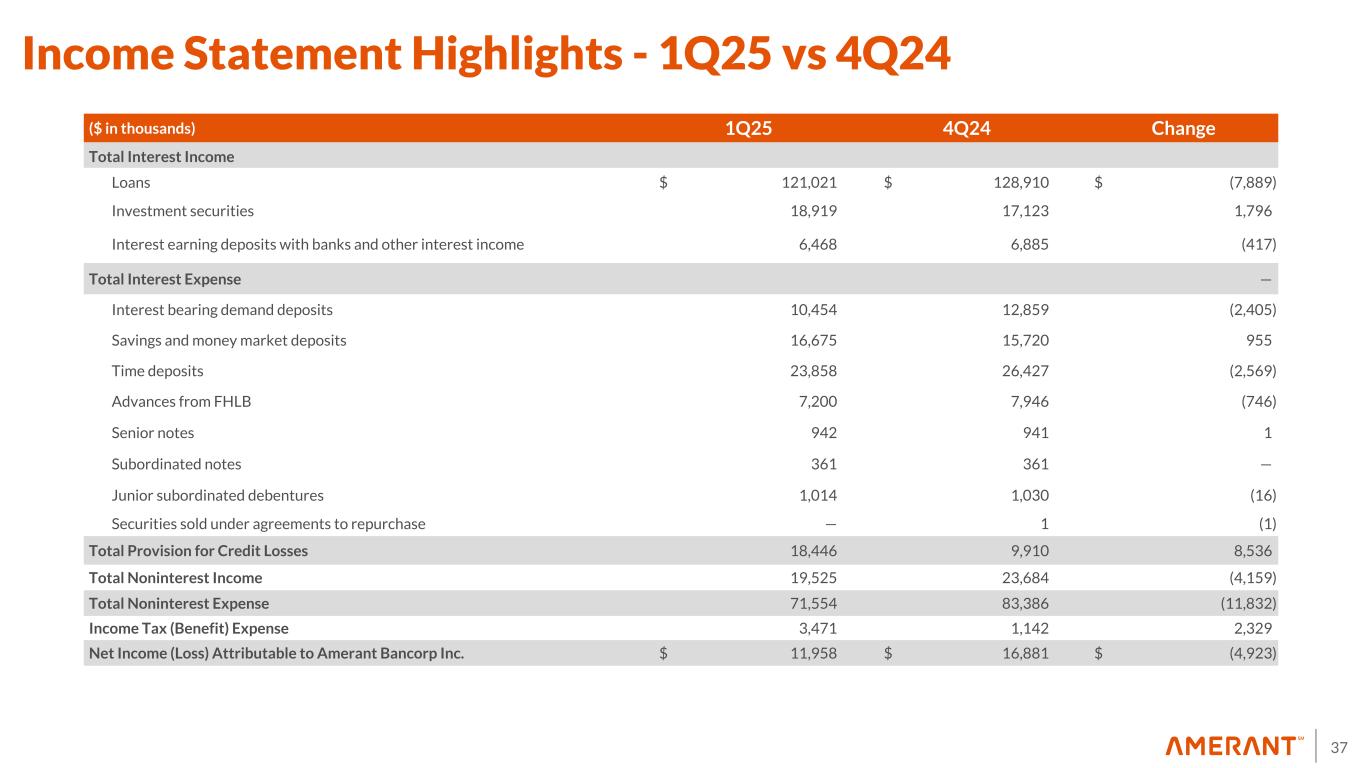
37 Income Statement Highlights - 1Q25 vs 4Q24 ($ in thousands) 1Q25 4Q24 Change Total Interest Income Loans $ 121,021 $ 128,910 $ (7,889) Investment securities 18,919 17,123 1,796 Interest earning deposits with banks and other interest income 6,468 6,885 (417) Total Interest Expense — Interest bearing demand deposits 10,454 12,859 (2,405) Savings and money market deposits 16,675 15,720 955 Time deposits 23,858 26,427 (2,569) Advances from FHLB 7,200 7,946 (746) Senior notes 942 941 1 Subordinated notes 361 361 — Junior subordinated debentures 1,014 1,030 (16) Securities sold under agreements to repurchase — 1 (1) Total Provision for Credit Losses 18,446 9,910 8,536 Total Noninterest Income 19,525 23,684 (4,159) Total Noninterest Expense 71,554 83,386 (11,832) Income Tax (Benefit) Expense 3,471 1,142 2,329 Net Income (Loss) Attributable to Amerant Bancorp Inc. $ 11,958 $ 16,881 $ (4,923)
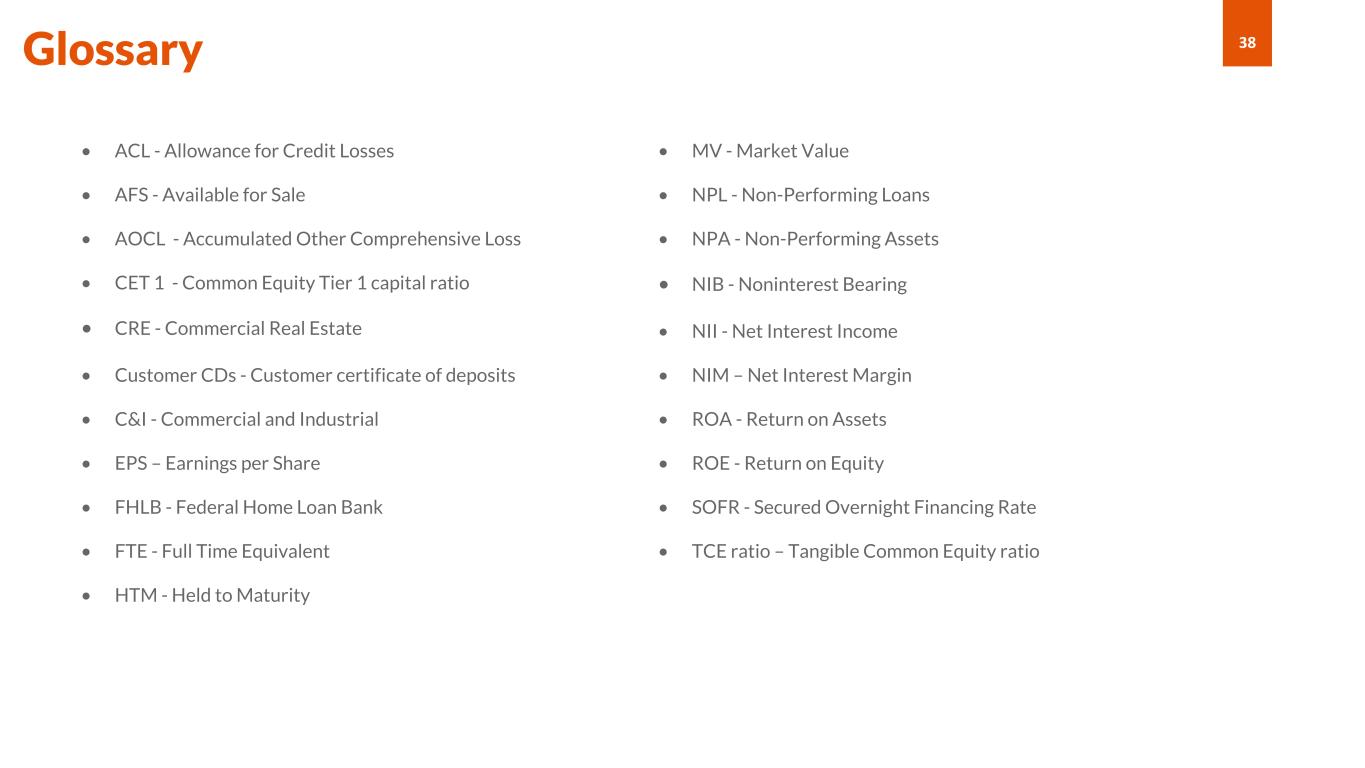
38 • ACL - Allowance for Credit Losses • AFS - Available for Sale • AOCL - Accumulated Other Comprehensive Loss • CET 1 - Common Equity Tier 1 capital ratio • CRE - Commercial Real Estate • Customer CDs - Customer certificate of deposits • C&I - Commercial and Industrial • EPS – Earnings per Share • FHLB - Federal Home Loan Bank • FTE - Full Time Equivalent • HTM - Held to Maturity • MV - Market Value • NPL - Non-Performing Loans • NPA - Non-Performing Assets • NIB - Noninterest Bearing • NII - Net Interest Income • NIM – Net Interest Margin • ROA - Return on Assets • ROE - Return on Equity • SOFR - Secured Overnight Financing Rate • TCE ratio – Tangible Common Equity ratio Glossary
39Glossary (cont'd) • Total gross loans: includes loans held for investment carried at amortized cost, loans held for sale carried at fair value, and loans held for sale carried at the lower of estimated fair value or cost • Cost of Total Deposits: annualized and calculated based upon the average daily balance of total deposits. • ROA: calculated based upon the average daily balance of total assets • ROE: calculated based upon the average daily balance of stockholders' equity • Loans Held for Investment: excludes loans held for sale carried at fair value and loans held for sale carried at the lower of cost or fair value • Non-performing loans include accruing loans past due by 90 days or more and all nonaccrual loans. Non-performing assets include accruing loans past due by 90 days or more, all nonaccrual loans, other real estate owned ("OREO") properties acquired through or in lieu of foreclosure and other repossessed assets. • Net Charge Offs/Average Total Loans Held for Investment: – Annualized and calculated based upon the average daily balance of outstanding loan principal balance net of unamortized deferred loan fees and costs, excluding the allowance for credit losses – Total loans exclude loans held for sale • Cost of Deposits: calculated based upon the average balance of total noninterest bearing and interest bearing deposits, which includes time deposits. • Cost of Funds: calculated based upon the average balance of total financial liabilities which include total interest bearing liabilities and noninterest bearing demand deposits • Quarterly beta (as shown in NII & NIM Slide): calculated based upon the change of the cost of deposit over the change of Federal funds rate (if any) during the quarter.

.