
Investor Update May 26, 2026 NYSE: AMTB

Being the bank of choice in the markets we serve. Table of Contents 3 About Us 10 Company Updates 15 Performance Updates 26 Supplemental Information 32 Appendix Investor Update | 1
Important Notices and Disclosures Forward-Looking Statements This presentation contains “forward-looking statements” including statements with respect to the Company’s objectives, expectations and intentions and other statements that are not historical facts. Examples of forward-looking statements include but are not limited to: our future operating or financial performance, including revenues, expenses, expense savings, income or loss and earnings or loss per share, and other financial items; statements regarding expectations, plans or objectives for future operations, products or services, and our expectations on loan recoveries or reaching positive resolutions on problem loans. All statements other than statements of historical fact are statements that could be forward-looking statements. You can identify these forward-looking statements through our use of words such as “may,” “will,” “anticipate,” “assume,” “should,” “indicate,” “would,” “believe,” “contemplate,” “expect,” “estimate,” “continue,” “plan,” “point to,” “project,” “could,” “intend,” “target,” “goals,” “outlook,” “modeled,” “dedicated,” “create,”and other similar words and expressions of the future. Forward-looking statements, including those relating to our beliefs, plans, objectives, goals, expectations, anticipations, estimates and intentions, involve known and unknown risks, uncertainties and other factors, which may be beyond our control, and which may cause the Company’s actual results, performance, achievements, or financial condition to be materially different from future results, performance, achievements, or financial condition expressed or implied by such forward-looking statements. You should not rely on any forward-looking statements as predictions of future events. You should not expect us to update any forward-looking statements, except as required by law. All written or oral forward-looking statements attributable to us are expressly qualified in their entirety by this cautionary notice, together with those risks and uncertainties described in “Risk factors” in our annual report on Form 10-K for the fiscal year ended December 31, 2025 filed on February 27, 2026, in our quarterly report on Form 10-Q for the quarter ended March 31, 2026 filed on May 1, 2026, and in our other filings with the U.S. Securities and Exchange Commission (the “SEC”), which are available at the SEC’s website www.sec.gov. Interim Financial Information Unaudited financial information as of and for interim periods, including the three-month periods ended March 31, 2026, December 31, 2025 and March 31, 2025, may not reflect our results of operations for our fiscal year ending, or financial condition as of December 31, 2026, or any other period of time or date. Non-GAAP Financial Measures The Company supplements its financial results that are determined in accordance with accounting principles generally accepted in the United States of America (“GAAP”) with non-GAAP financial measures, such as “pre-tax pre-provision net revenue (PPNR)”, "tangible common equity ratio", and “tangible stockholders’ equity (book value) per common share”. This supplemental information is not required by, or is not presented in accordance with GAAP. The Company refers to these financial measures and ratios as “non-GAAP financial measures”. We use certain non-GAAP financial measures, including those mentioned above, both to explain our results to shareholders and the investment community and in the internal evaluation and management of our business. Management believes that these supplementary non-GAAP financial measures and the information they provide are useful to investors since these measures permit investors to view our performance using the same tools that our management uses to evaluate our past performance and prospects for future performance. While we believe that these non-GAAP financial measures are useful in evaluating our performance, this information should be considered as supplemental and not as a substitute for or superior to the related financial information prepared in accordance with GAAP. Additionally, these non-GAAP financial measures may differ from similar measures presented by other companies. Appendix 1 reconciles these non-GAAP financial measures to GAAP reported results. Beginning in the first quarter of 2026, the Company reviewed and updated its use of non-GAAP financial measures and now presents a limited set of metrics that management uses to evaluate performance and make operating decisions. As part of this update, the Company discontinued the presentation of “Core PPNR”, “core noninterest income”, “core noninterest expense”, “core net income”, “core earnings per share (basic and diluted)”, “core return on assets (Core ROA)”, “core return on equity (Core ROE)”, and “core efficiency ratio” as management determined these measures are no longer primary metrics used internally. This change does not reflect any change in the Company’s underlying business, operations, or GAAP financial results. Investor Update | 2

About Us Investor Update | 3
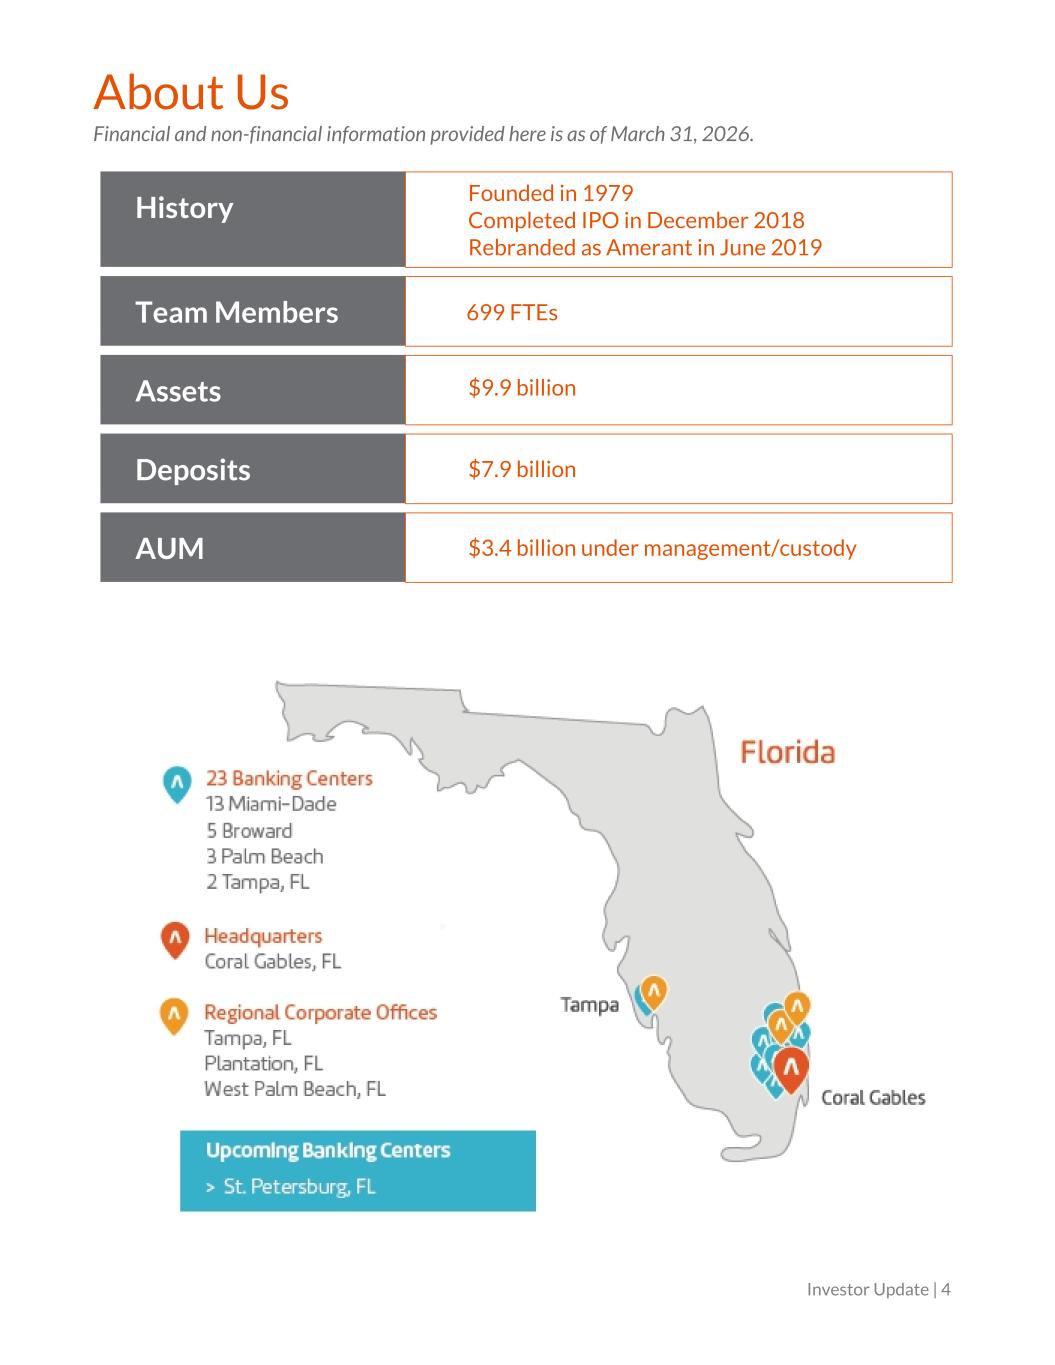
About Us Financial and non-financial information provided here is as of March 31, 2026. History Founded in 1979 Completed IPO in December 2018 Rebranded as Amerant in June 2019 Team Members 699 FTEs Assets $9.9 billion Deposits $7.9 billion AUM $3.4 billion under management/custody Investor Update | 4
Our Investment Proposition Established franchise with high scarcity value; presence in attractive, high- growth markets of South Florida, Tampa and Central Florida Vertically-integrated platform to serve LATAM clients Strong and diverse deposit base; organic, relationship-first focus Company focus is on the execution of strategic plan to unlock sustainable and profitable growth • Operating with a fully integrated, state-of-the-art core tech system, enabling us to better serve our customers and team members • Completed exit of non-core markets (NY and TX); focusing on organic growth in Florida • Continue to selectively invest in both business development and credit risk management talent to drive incremental growth • Branch network in place to support future growth in Florida • Digital transformation efforts well underway; leveraging AI capabilities in different areas to drive efficiencies We have a strong foundation to enable us to become a consistent top-quartile performer as Florida’s bank of choice. Investor Update | 5
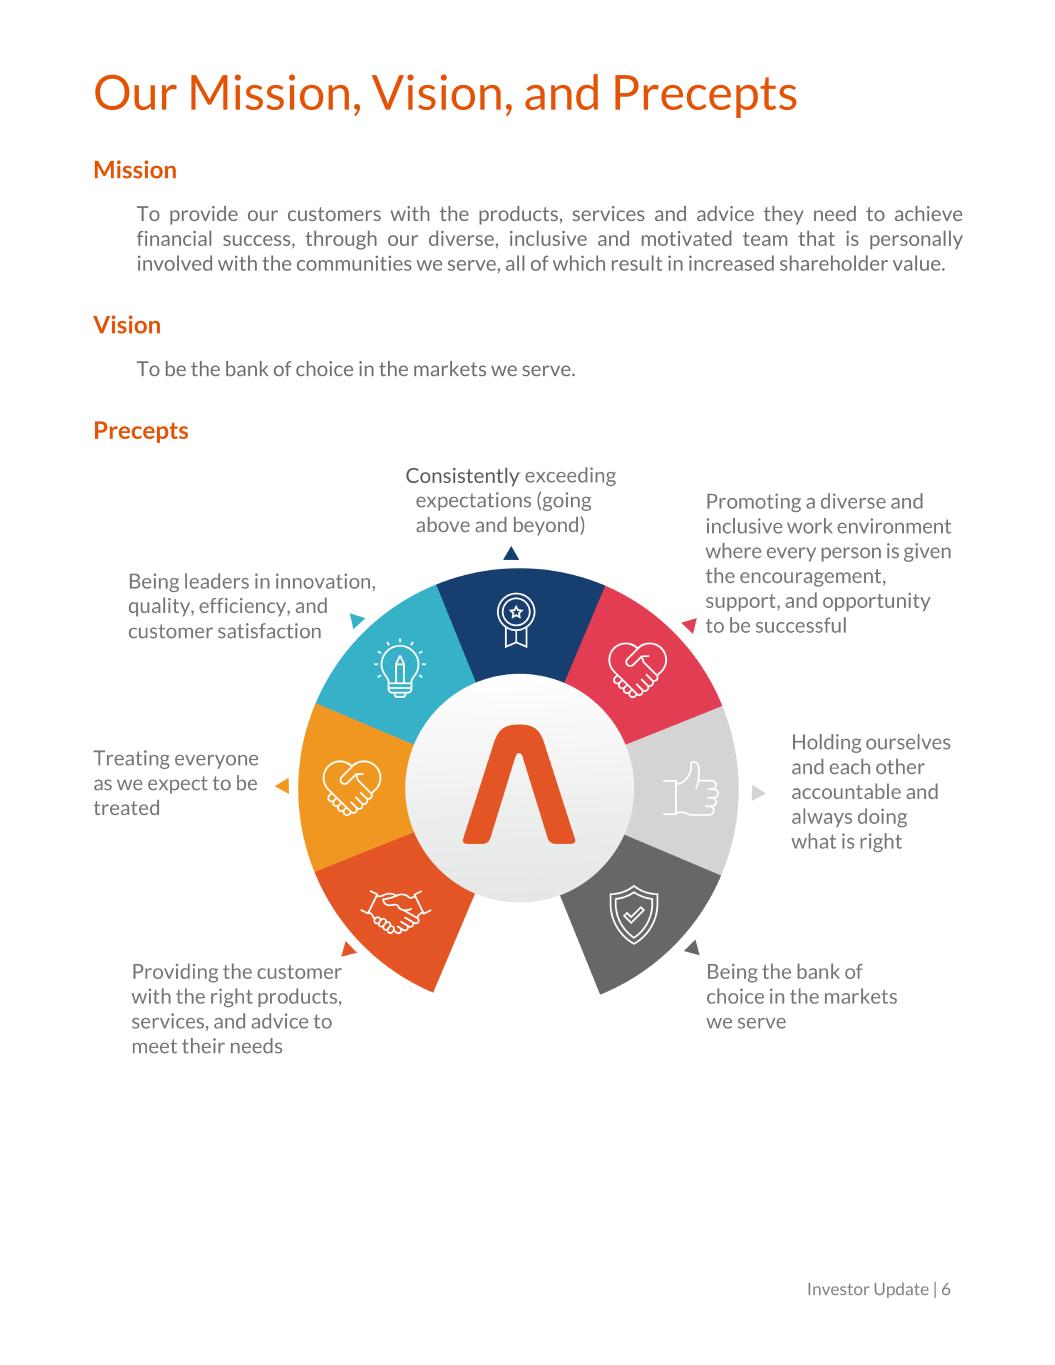
Our Mission, Vision, and Precepts Mission To provide our customers with the products, services and advice they need to achieve financial success, through our diverse, inclusive and motivated team that is personally involved with the communities we serve, all of which result in increased shareholder value. Vision To be the bank of choice in the markets we serve. Precepts Investor Update | 6 Consistently

Investor Update | 7 Experienced Leadership Team Carlos Iafigliola President, Chief Executive Officer and Director Carlos Iafigliola was appointed President, CEO and Director in May 2026 after having served as Interim CEO and Director since November 2025. He previously served as SEVP, Chief Operating Officer (COO) since June 2023,where he was responsible for Amerant’s loan and deposit operations, project management, technology services, facilities, and digital. Prior to being COO, he served as EVP, Chief Financial Officer since May 2020 spearheading Amerant's financial management. Sharymar Calderón SEVP, Chief Financial Officer Sharymar Calderón was appointed EVP, Chief Financial Officer (CFO) in June 2023 and SEVP in November 2024. She is responsible for Amerant’s financial management, including treasury, financial reporting and accounting, financial planning and analysis, strategy, investor relations, internal controls and corporate tax. Prior to her appointment as CFO, she served as Amerant’s Head of Internal Audit. Alberto Capriles SEVP, Chief Risk Officer Alberto Capriles was appointed SEVP in January 2023 and named Chief Risk Officer in February 2018. He is responsible for all enterprise risk management oversight, including credit, market, operational and information security risk. Prior to his appointment as CRO, he served in various leadership roles with Mercantil Servicios Financieros (MSF) since 1995. Lee Ann Cragg SEVP, Chief Credit Officer Lee Ann Cragg serves as SEVP, Chief Credit Officer. In this role, she oversees Credit Services, Credit Risk, and Special Assets ensuring strong credit quality, regulatory excellence, and disciplined risk management across all portfolios. She brings more than 15 years of commercial banking and credit risk experience and has been a strategic leader within Amerant’s Commercial and Industrial (C&I) Credit department since joining the organization. Tony Eelman EVP, Chief Product Officer Tony Eelman serves as EVP, Chief Product Officer where he leads enterprise product strategy and development across the bank’s lending and financial services platforms. He is responsible for aligning product design, technology enablement, and go-to-market execution to deliver client- focused solutions that support sustainable growth. Prior to his appointment as CPO, he served as President of Amerant Bank's subsidiary, Amerant Mortgage.

Investor Update | 8 Experienced Leadership Team Pedro Parra SEVP, Chief International Banking Officer Pedro Parra serves as SEVP, Chief International Banking Officer. In this role, he leads Amerant’s international banking platform, overseeing Private, Retail, Corporate and Commercial Banking, and Client Services. He is responsible for Amerant’s strategic focus on strengthening and expanding its international client relationships. He was most recently SEVP, Head of International Banking and has held multiple leadership roles since joining Amerant in 2000. Mariola Sanchez SEVP, Chief Administrative Officer Mariola Triana Sanchez was appointed Chief Administrative Officer in April 2025 after having served as Chief People Officer (CPO) since June 2022. She serves as Amerant's General Counsel and oversees human resources, legal, corporate communications, community relations, and sustainability. Adrian Rodriguez EVP, Interim Chief Operating Officer Adrian Rodriguez was appointed EVP, Interim Chief Operating Officer in November 2025. In his role, he oversees the bank’s core operating functions, including loan and credit operations, deposit and payment operations, IT, facilities management, project management, procurement and digital innovation. Most recently, he served as Head of Loan Operations, where he played a key role in strengthening operational controls and supporting the bank's efficiency and growth initiatives. Laura Rossi EVP, Head of Investor Relations & Strategy Laura Rossi serves as EVP, Head of Investor Relations & Strategy. In this role, she spearheads Amerant’s relationship with the investment community and rating agencies, as well as the Company’s strategic planning and execution process. She served as Project Manager for the Company’s spin-off and IPO in 2018, and has held various roles since joining Amerant in 2005. Mike Nursey SEVP, Chief Domestic Banking Officer Mike Nursey serves as SEVP, Chief Domestic Banking Officer. In this role, he leads Commercial Banking, Corporate Banking, and Commercial Real Estate, while also assuming leadership of Retail, Private, and Business Banking. Mike joined Amerant in June 2024 as Central FL Market President, leading the bank’s expansion efforts in the Tampa market. Prior to joining Amerant, he held executive positions at TD Bank and Regions Bank.
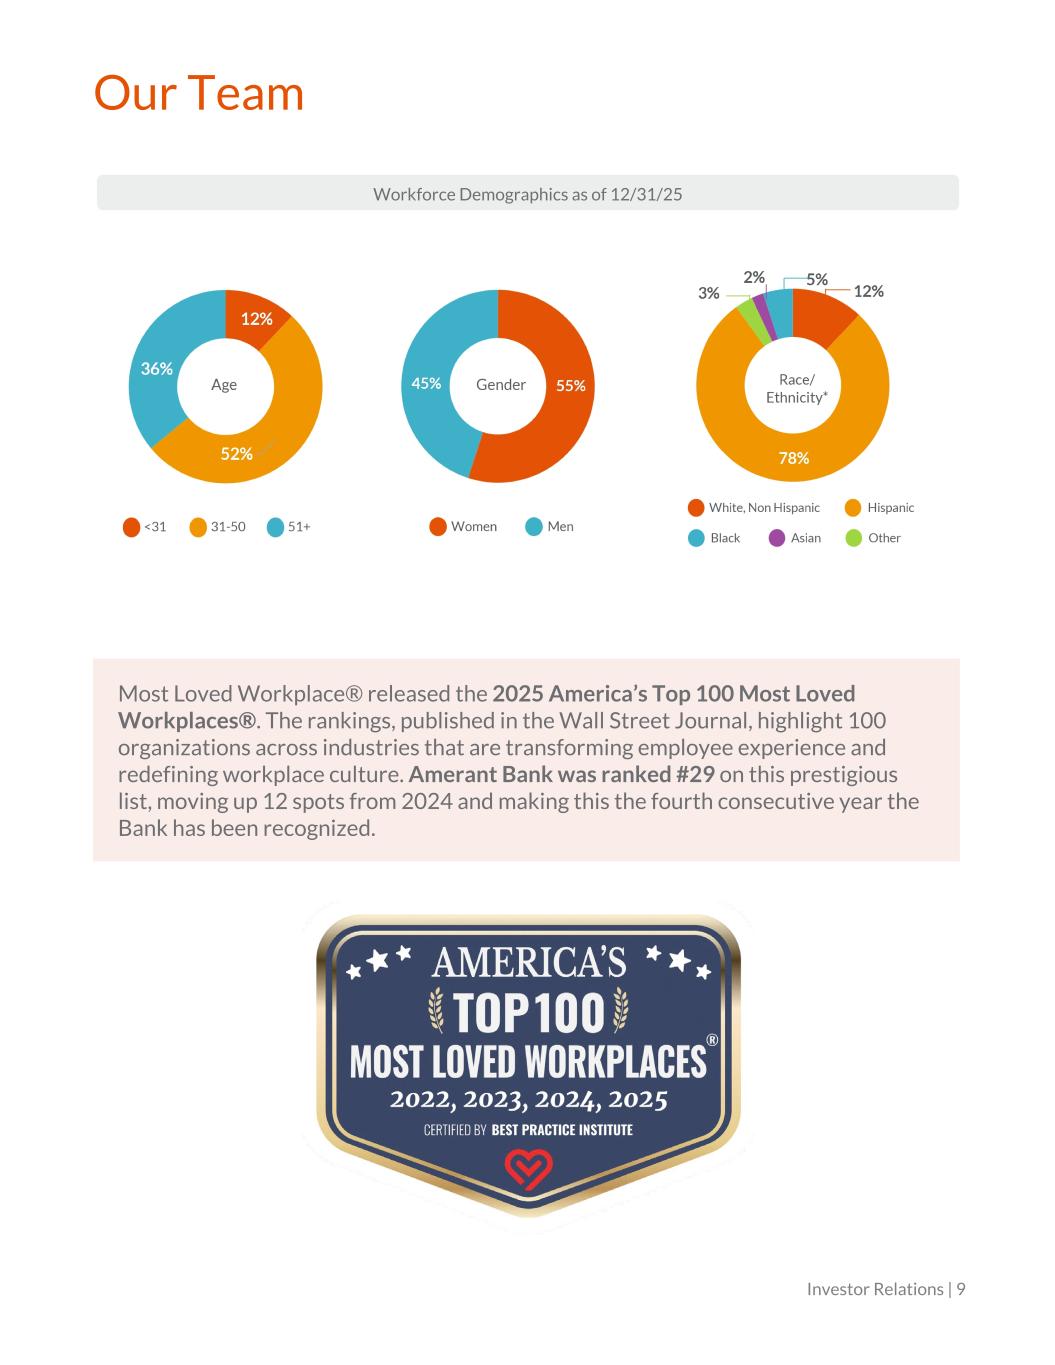
Our Team Most Loved Workplace® released the 2025 America’s Top 100 Most Loved Workplaces®. The rankings, published in the Wall Street Journal, highlight 100 organizations across industries that are transforming employee experience and redefining workplace culture. Amerant Bank was ranked #29 on this prestigious list, moving up 12 spots from 2024 and making this the fourth consecutive year the Bank has been recognized. Workforce Demographics as of 12/31/25 Investor Relations | 9

Company Updates Investor Update | 10
Executing Our Strategic Priorities Investor Updates | 11 Executing Strategic Plan: Our three priorities of stabilizing the business, optimizing our credit portfolio, and growing sustainably remain the same Enhancing Credit Quality: Improved loan portfolio monitoring and reviewing processes, leading to balanced portfolio actions during 1Q26, with both downgrades and significant upgrades. Continued to optimize loan portfolio, including exiting certain large-exposure, out-of-footprint and criticized loans Improving Efficiency: Net income in line with our guidance and significant reduction in noninterest expenses of ~$30 million during 2026 Prioritizing Stable and Disciplined Growth: Shifted underwriting approach, prioritizing borrowers with stable and proven operating histories and recalibrating our risk appetite Capturing Deposit Growth in International Markets: Significant deposit growth materializing following preliminary reactivation of Venezuelan economy, as Amerant is uniquely positioned to capitalize on existing relationships and accelerate efforts to deepen them and expand in this market Improved Credit Evaluation Processes Strengthened Portfolio Oversight: Established dedicated Portfolio Management team to enhance monitoring, reporting and escalation; investing in additional training for underwriting and relationship teams to improve accuracy and consistency of risk ratings Enhanced Risk-rating Process: Embedded new checkpoints throughout our monitoring process. We have also increased the cadence of multiple loan monitoring meetings with proactive strategy discussions Expanded Review Coverage & Rigor: Redesigned annual reviews for deeper and earlier issue identification; lowered review threshold from $5 million to $3 million in credit exposure (targeting $1 million over time); introduced consistent quarterly "Top 20" reviews across CRE, C&I, and Consumer loans to monitor the largest relationships, and targeted analysis for higher risk categories Aligned Incentives: Incorporated portfolio management metrics into banker compensation beginning in 2026
Key Updates On May 18, 2026, Carlos Iafigliola was appointed President and CEO of Amerant Bancorp Inc. and Amerant Bank, N.A.,. Carlos has provided strong and effective leadership as Interim CEO and has also served as CFO and COO since Amerant became a public company. He has deep knowledge of our business, disciplined execution, and unwavering commitment to our customers, team members, and shareholders. Carlos is keenly focused on advancing our strategic priorities, further strengthening our franchise, and driving sustainable long-term value for our shareholders. Continued improvement in asset quality with further reduction in criticized loan balances (see updates in slides 20-22) Outlook Balance Sheet • Total loans projected to reach $7 billion as of 2Q26, through organic originations complemented by selective residential loan purchases, to balance credit exits and support shift towards a more granular portfolio. We expect cumulative loan growth around 7% for 2026. • Total deposits projected to reach $8 billion as of 2Q26. We expect cumulative deposit growth between 8 to 10% for 2026. Income Statement • Updated Net Interest Margin ("NIM") expected to be 3.45%–3.50% in 2Q26 and to stabilize at this range for the remainder of the year. This updated NIM outlook reflects developments in April and May and is supported by the following factors: Stronger pipeline activity and a more favorable loan mix Higher international deposit balances, contributing to a lower cost of funds A reduced likelihood of 2026 rate cuts, which benefits Amerant given its asset sensitivity and the repricing at higher yields compared to 1Q26 • Projected expenses of approximately $68 to $69 million in 2Q26, stabilizing around $68 million towards year-end, as we continue to make progress towards a target efficiency ratio of approximately 60% Capital Management • Will continue to optimize capital management, balancing between retaining capital for growth, and buybacks and dividends to enhance returns Investor Update | 12
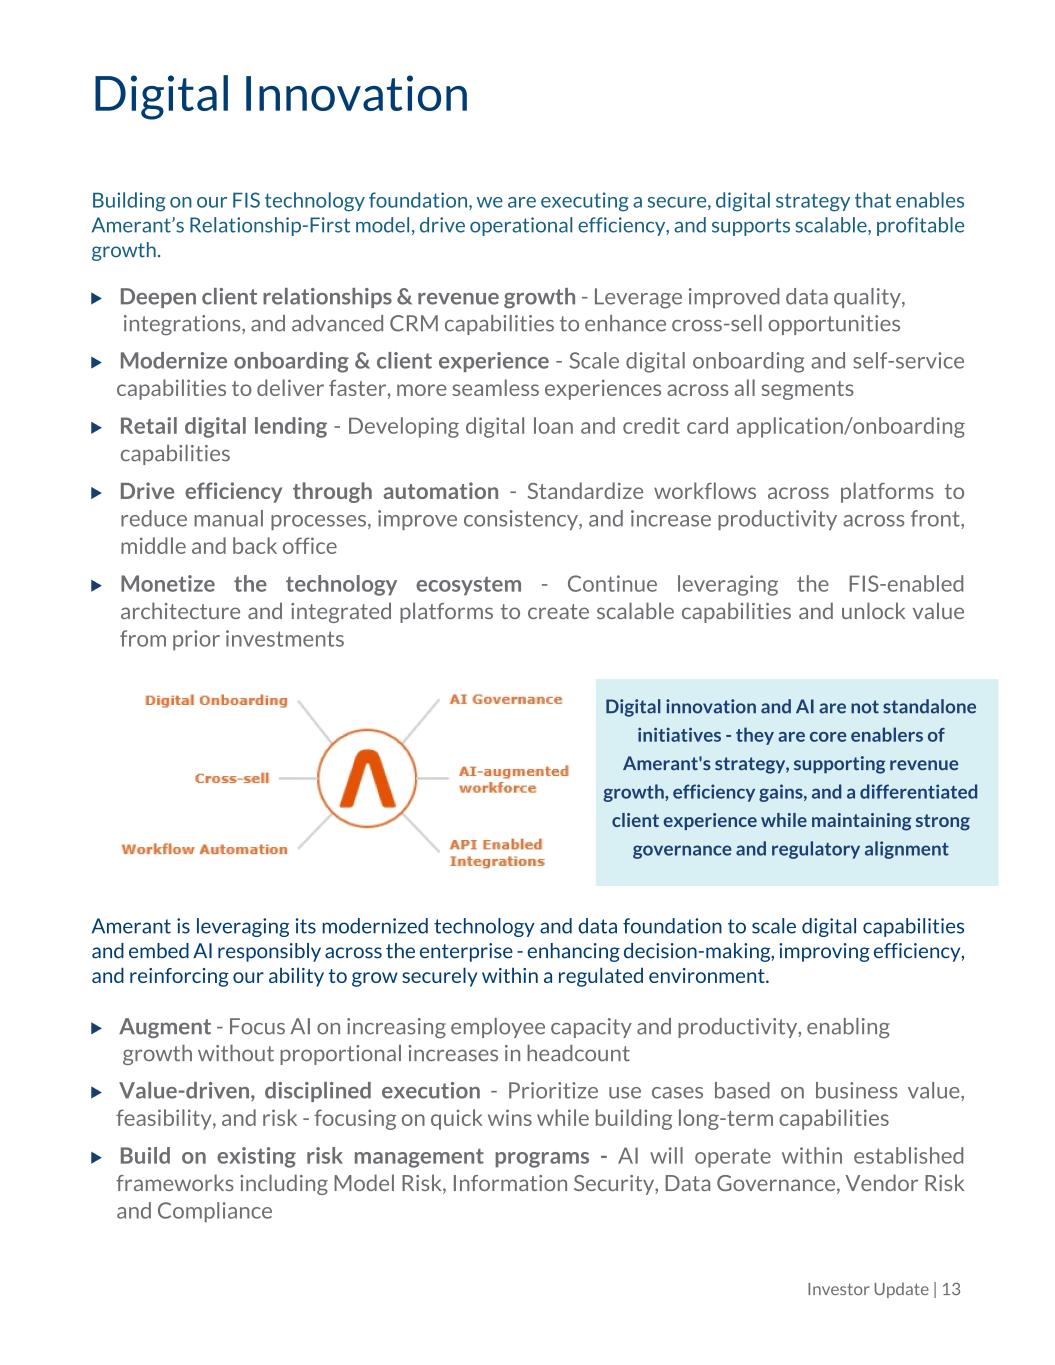
Digital Innovation Building on our FIS technology foundation, we are executing a secure, digital strategy that enables Amerant’s Relationship-First model, drive operational efficiency, and supports scalable, profitable growth. Deepen client relationships & revenue growth - Leverage improved data quality, integrations, and advanced CRM capabilities to enhance cross-sell opportunities Modernize onboarding & client experience - Scale digital onboarding and self-service capabilities to deliver faster, more seamless experiences across all segments Retail digital lending - Developing digital loan and credit card application/onboarding capabilities Drive efficiency through automation - Standardize workflows across platforms to reduce manual processes, improve consistency, and increase productivity across front, middle and back office Monetize the technology ecosystem - Continue leveraging the FIS-enabled architecture and integrated platforms to create scalable capabilities and unlock value from prior investments Digital innovation and AI are not standalone initiatives - they are core enablers of Amerant's strategy, supporting revenue growth, efficiency gains, and a differentiated client experience while maintaining strong governance and regulatory alignment Amerant is leveraging its modernized technology and data foundation to scale digital capabilities and embed AI responsibly across the enterprise - enhancing decision-making, improving efficiency, and reinforcing our ability to grow securely within a regulated environment. Augment - Focus AI on increasing employee capacity and productivity, enabling growth without proportional increases in headcount Value-driven, disciplined execution - Prioritize use cases based on business value, feasibility, and risk - focusing on quick wins while building long-term capabilities Build on existing risk management programs - AI will operate within established frameworks including Model Risk, Information Security, Data Governance, Vendor Risk and Compliance Investor Update | 13
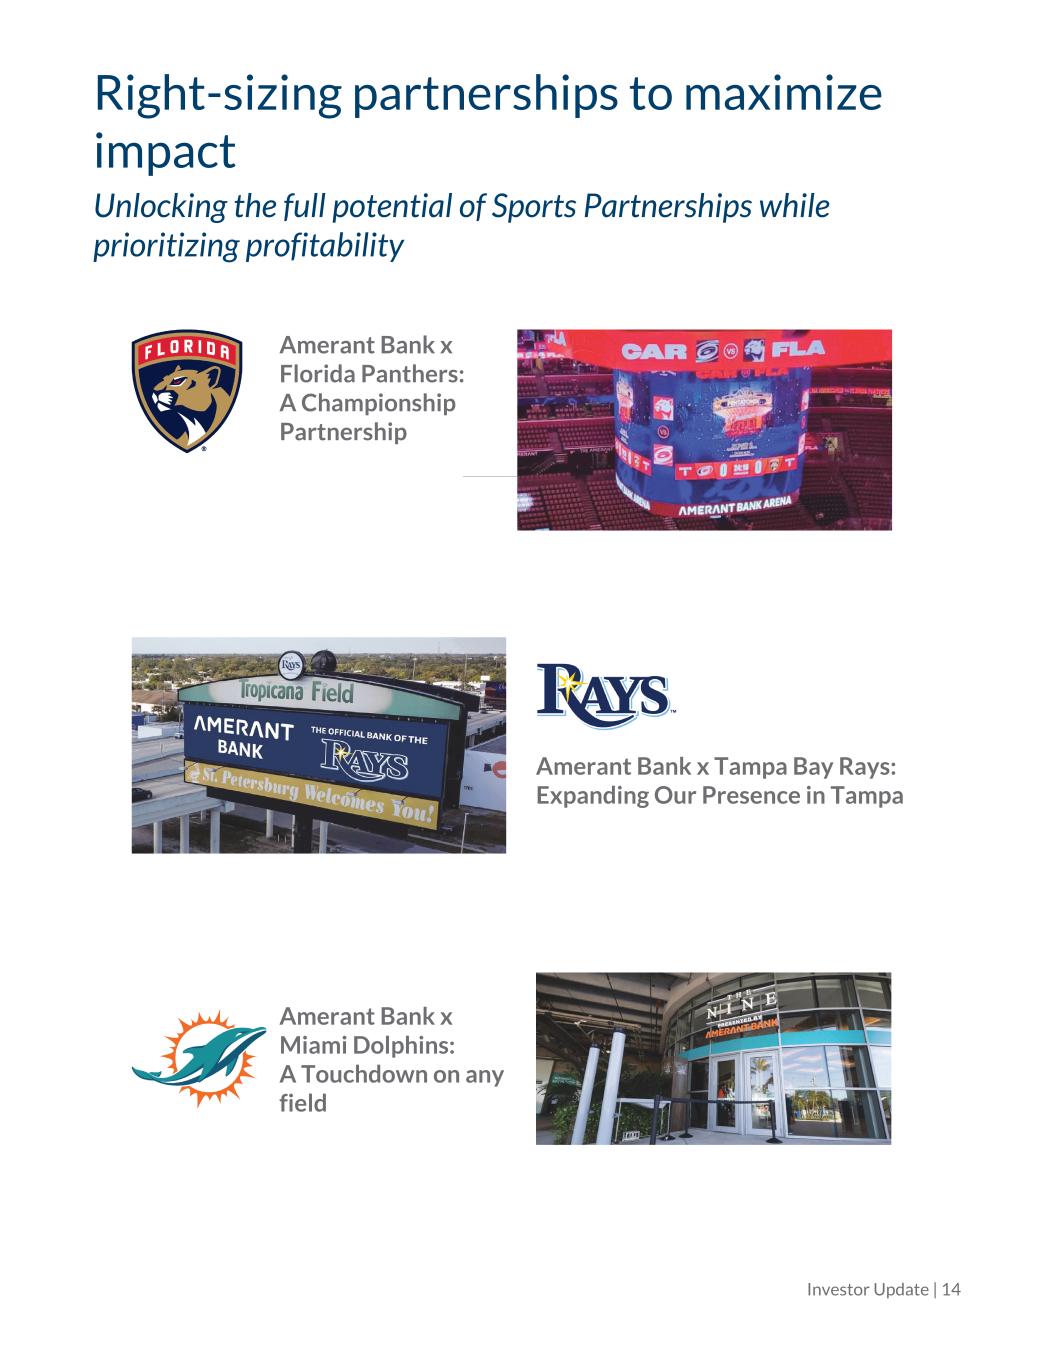
Right-sizing partnerships to maximize impact Unlocking the full potential of Sports Partnerships while prioritizing profitability Amerant Bank x Florida Panthers: A Championship Partnership Amerant Bank x Tampa Bay Rays: Expanding Our Presence in Tampa Amerant Bank x Miami Dolphins: A Touchdown on any field Investor Update | 14

Performance Updates Investor Update | 15
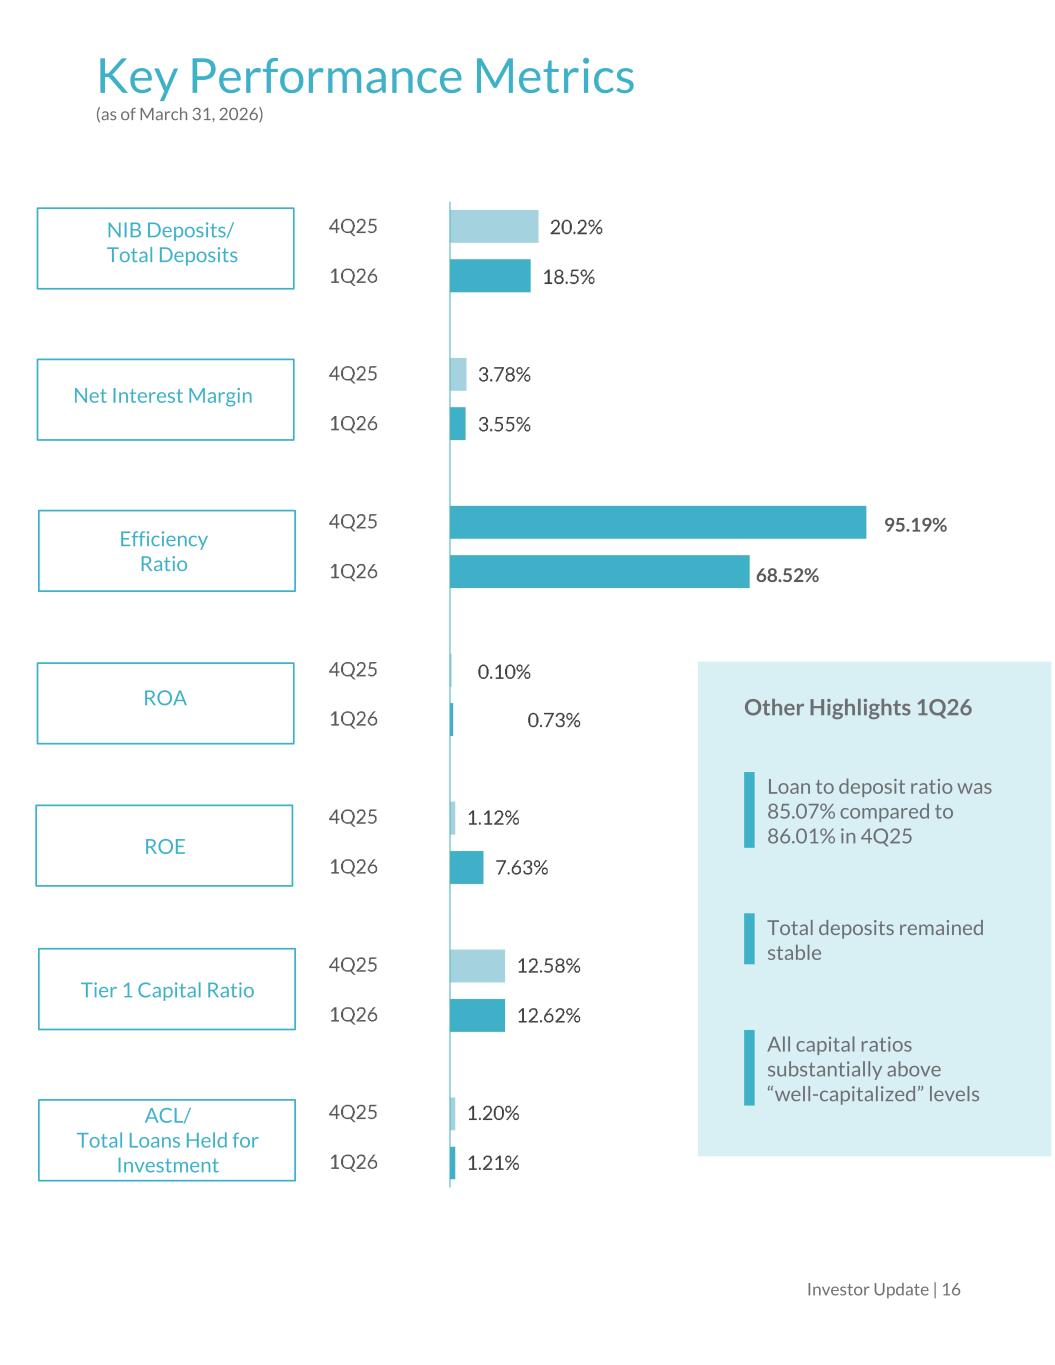
Key Performance Metrics (as of March 31, 2026) Other Highlights 1Q26 Loan to deposit ratio was 85.07% compared to 86.01% in 4Q25 Total deposits remained stable All capital ratios substantially above “well-capitalized” levels Investor Update | 16 NIB Deposits/ Total Deposits Net Interest Margin Efficiency Ratio ROA ROE Tier 1 Capital Ratio ACL/ Total Loans Held for Investment 95.19% 68.52%
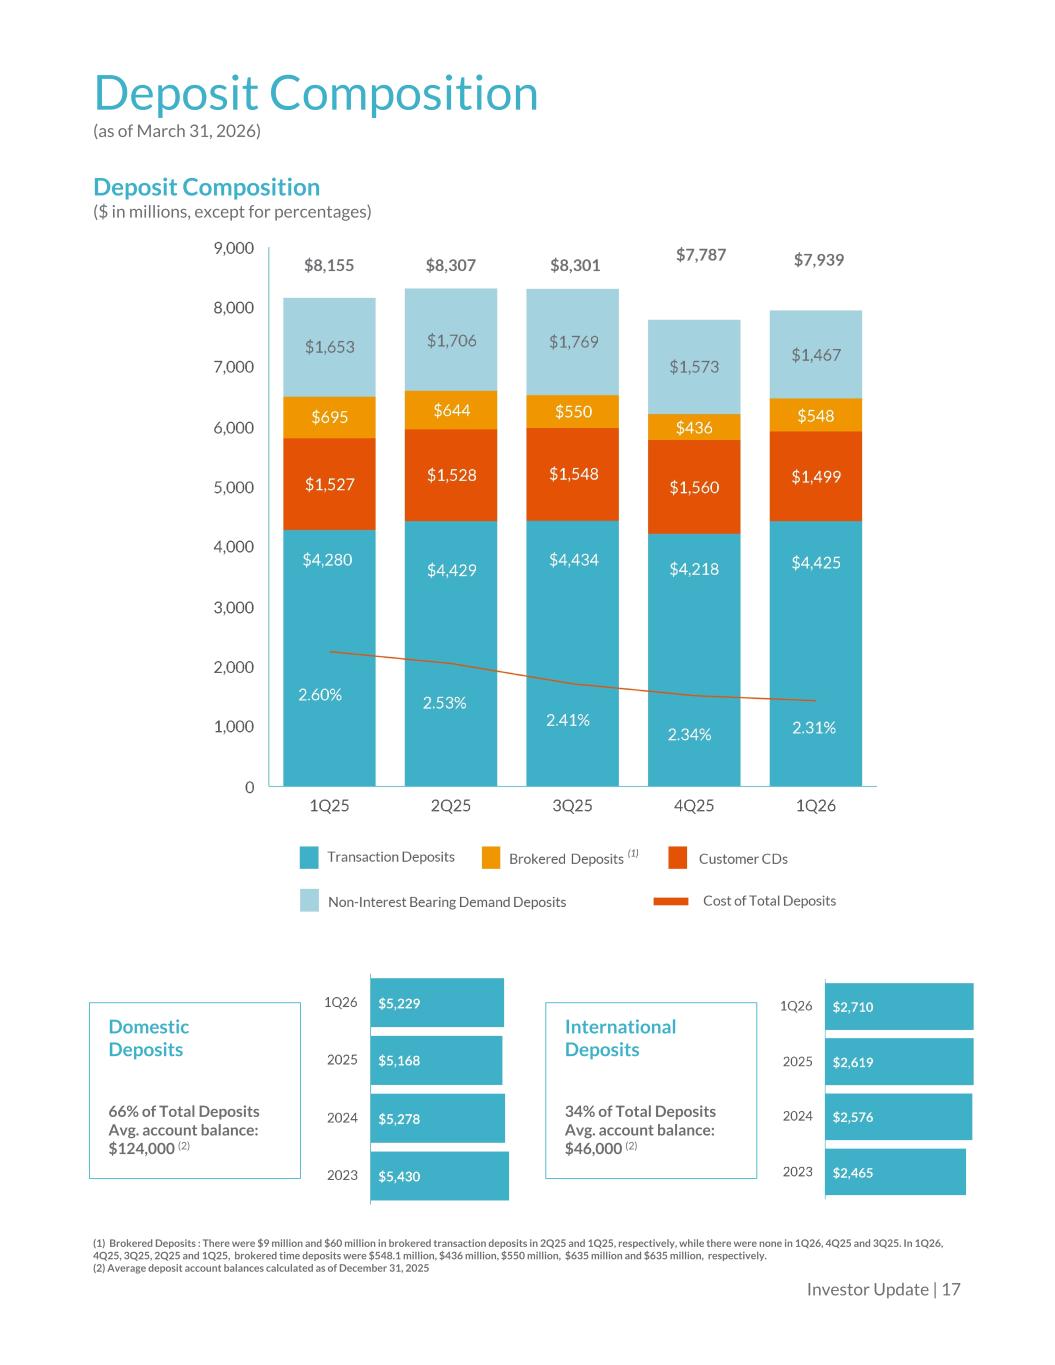
Deposit Composition (as of March 31, 2026) Deposit Composition ($ in millions, except for percentages) Domestic Deposits 66% of Total Deposits Avg. account balance: $124,000 (2) International Deposits 34% of Total Deposits Avg. account balance: $46,000 (2) (1) Brokered Deposits : There were $9 million and $60 million in brokered transaction deposits in 2Q25 and 1Q25, respectively, while there were none in 1Q26, 4Q25 and 3Q25. In 1Q26, 4Q25, 3Q25, 2Q25 and 1Q25, brokered time deposits were $548.1 million, $436 million, $550 million, $635 million and $635 million, respectively. (2) Average deposit account balances calculated as of December 31, 2025 Investor Update | 17
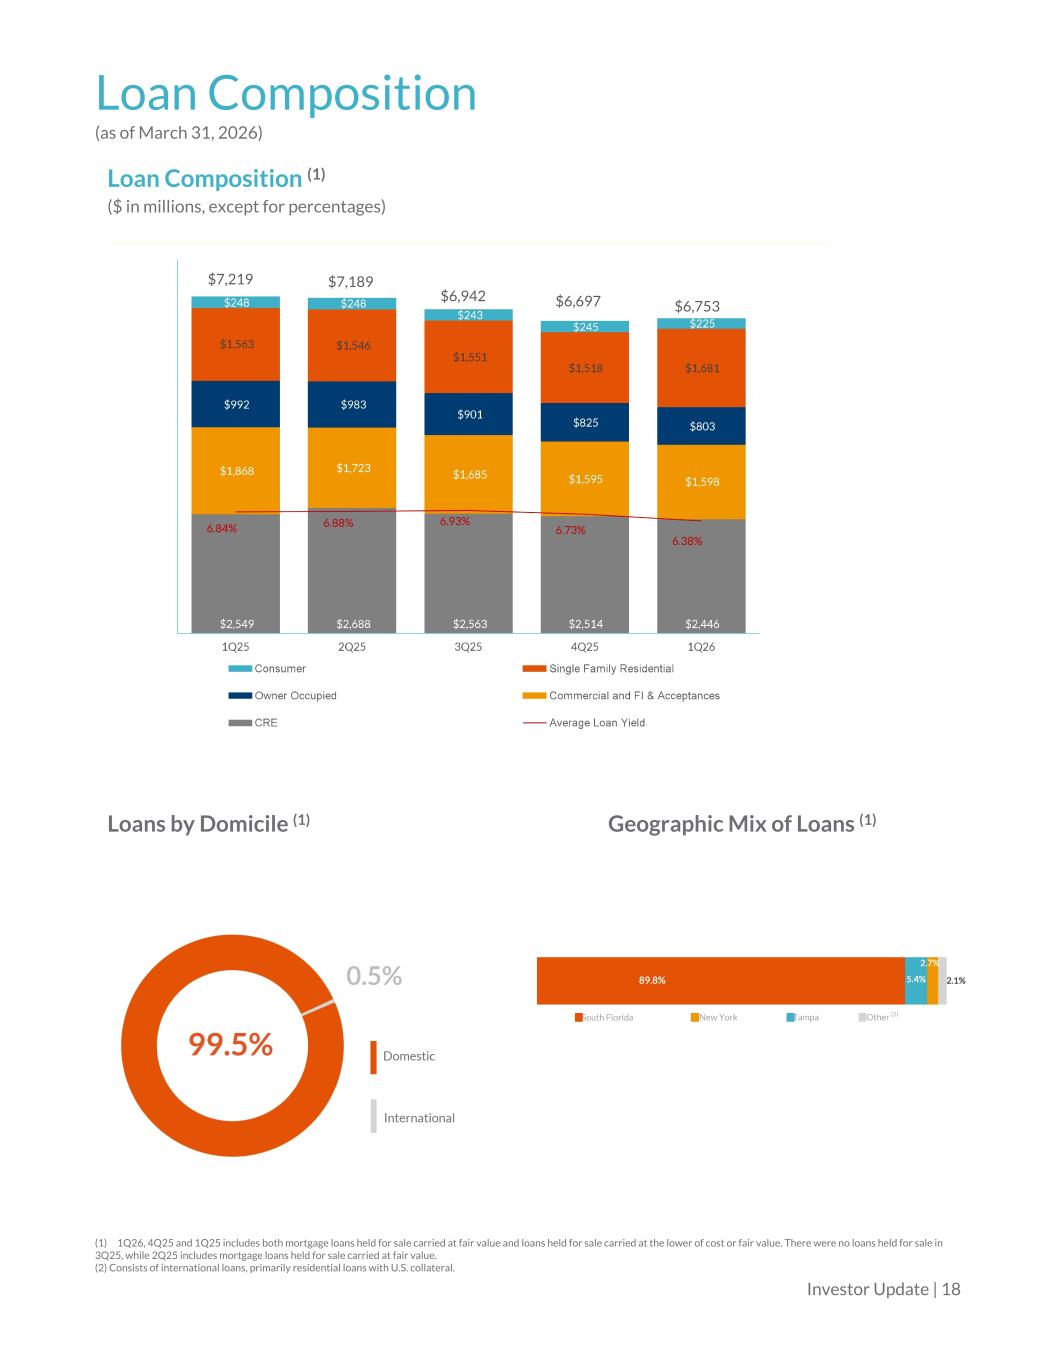
Loan Composition (as of March 31, 2026) Loan Composition (1) ($ in millions, except for percentages) Loans by Domicile (1) Geographic Mix of Loans (1) (1) 1Q26, 4Q25 and 1Q25 includes both mortgage loans held for sale carried at fair value and loans held for sale carried at the lower of cost or fair value. There were no loans held for sale in 3Q25, while 2Q25 includes mortgage loans held for sale carried at fair value. (2) Consists of international loans, primarily residential loans with U.S. collateral. Investor Update | 18 $7,219 $7,189 $6,942 $6,697 $6,753 99.5%
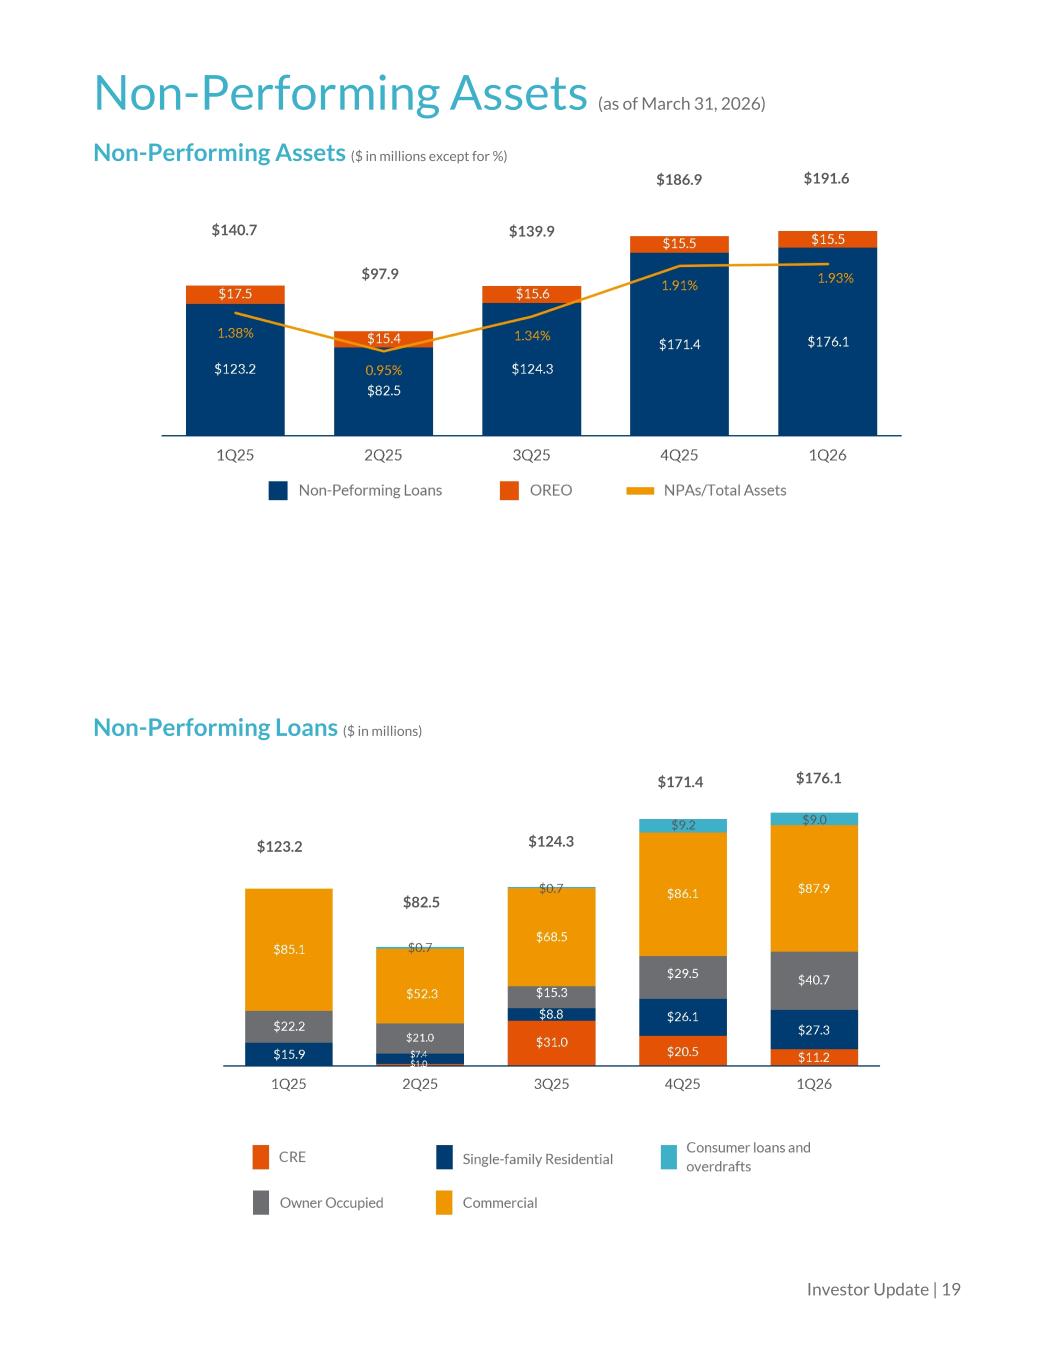
Non-Performing Assets (as of March 31, 2026) Non-Performing Assets ($ in millions except for %) Non-Performing Loans ($ in millions) Investor Update | 19 $140.7 $97.9 $139.9 $186.9 $191.6 $123.2 $82.5 $124.3 $171.4 $176.1
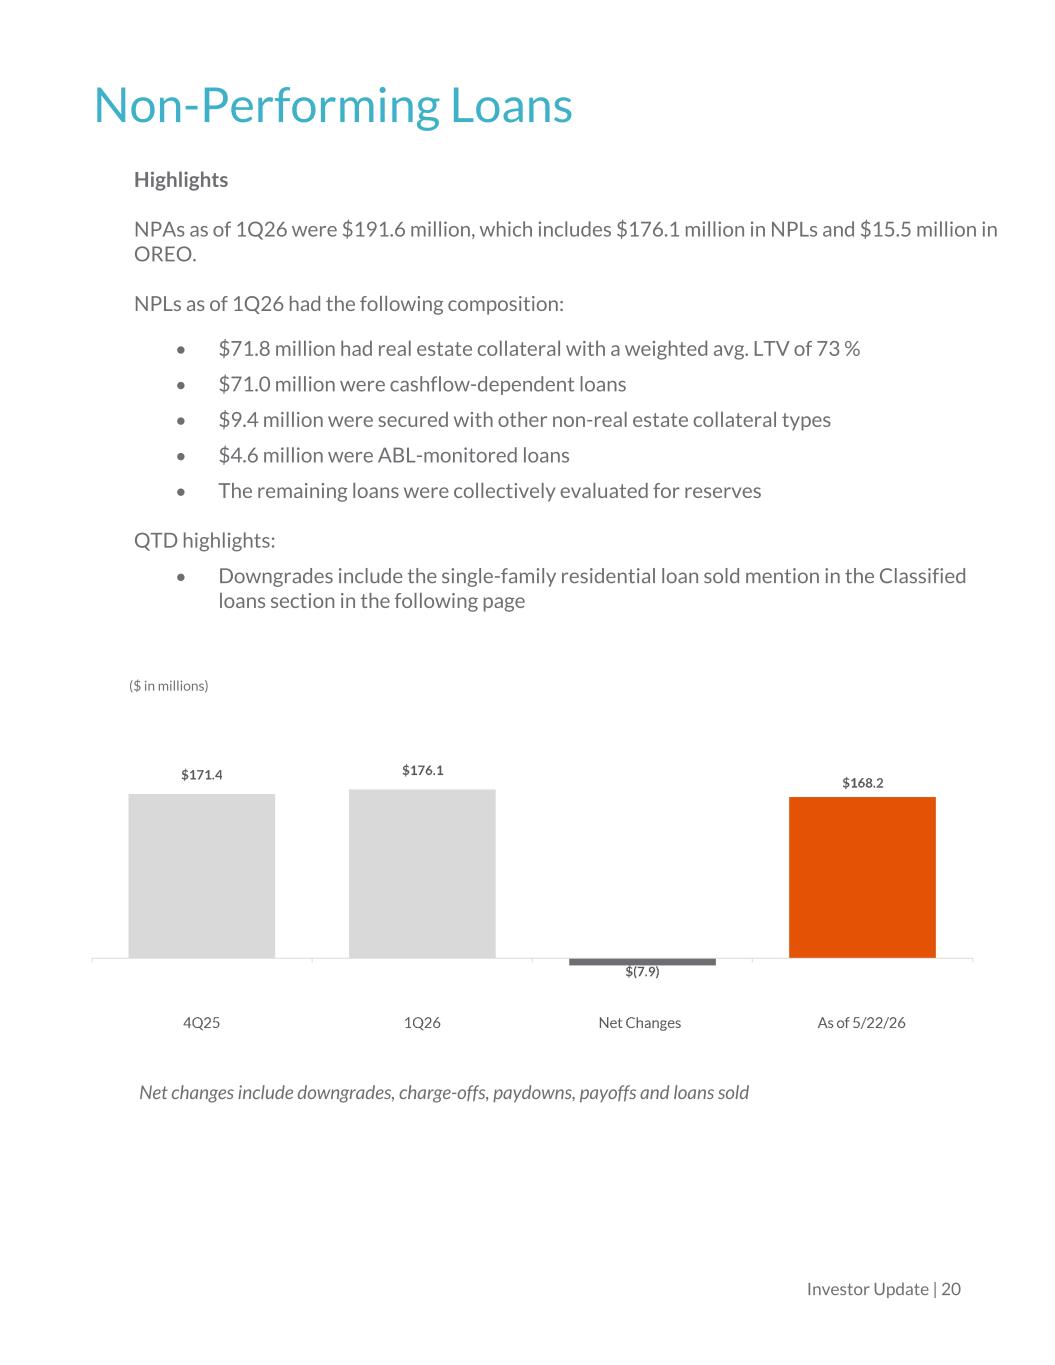
Non-Performing Loans Investor Update | 20 Highlights NPAs as of 1Q26 were $191.6 million, which includes $176.1 million in NPLs and $15.5 million in OREO. NPLs as of 1Q26 had the following composition: • $71.8 million had real estate collateral with a weighted avg. LTV of 73 % • $71.0 million were cashflow-dependent loans • $9.4 million were secured with other non-real estate collateral types • $4.6 million were ABL-monitored loans • The remaining loans were collectively evaluated for reserves QTD highlights: • Downgrades include the single-family residential loan sold mention in the Classified loans section in the following page ($ in millions) Net changes include downgrades, charge-offs, paydowns, payoffs and loans sold
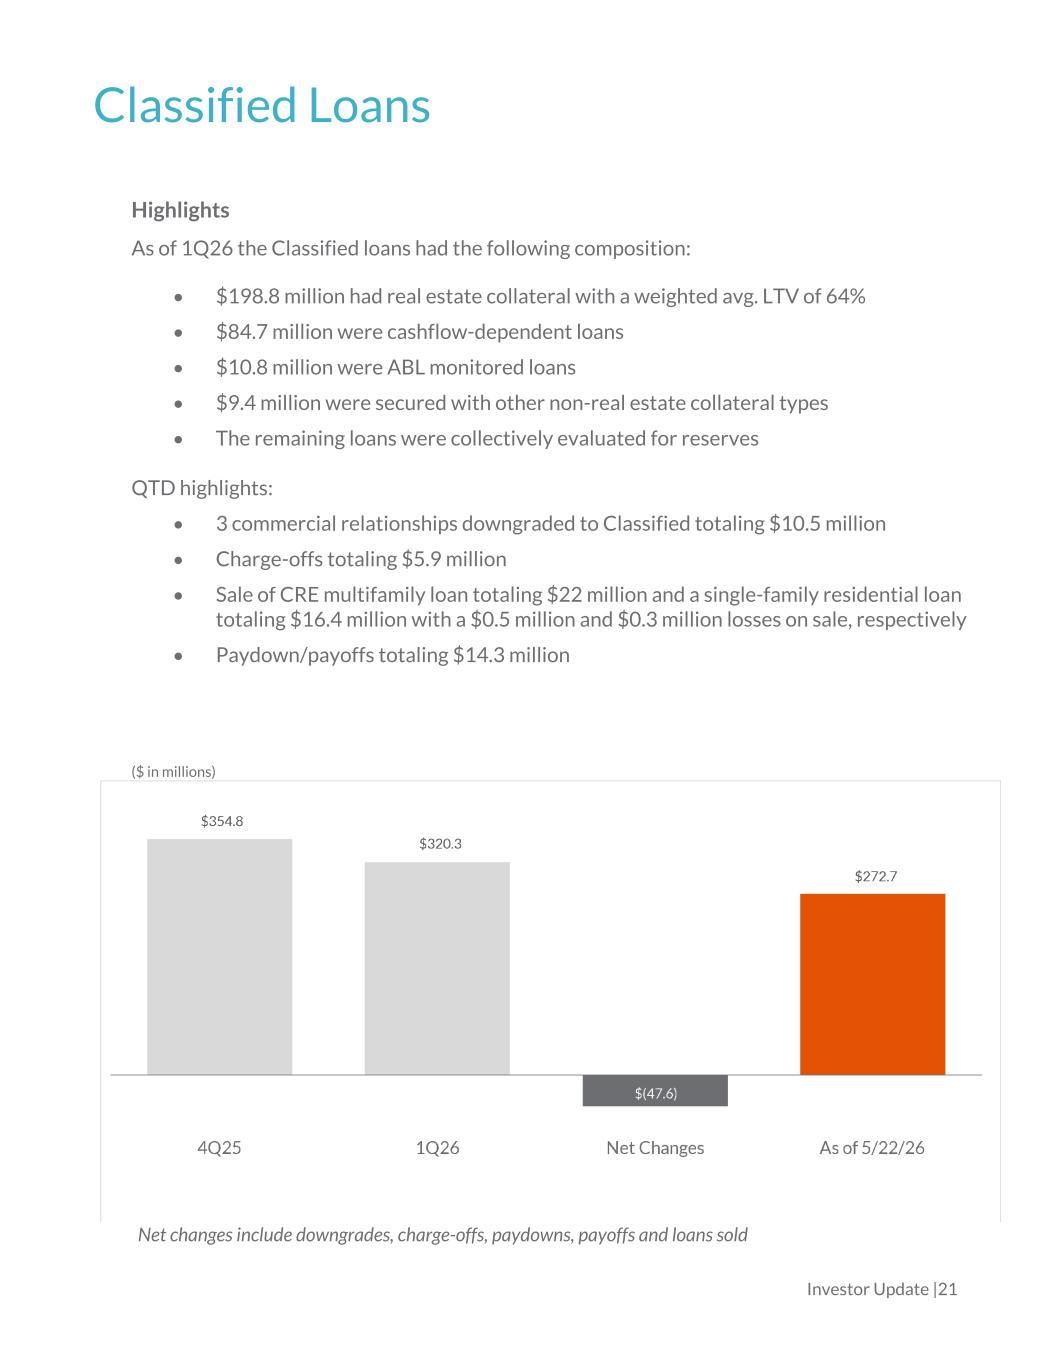
Classified Loans Investor Update |21 Highlights As of 1Q26 the Classified loans had the following composition: • $198.8 million had real estate collateral with a weighted avg. LTV of 64% • $84.7 million were cashflow-dependent loans • $10.8 million were ABL monitored loans • $9.4 million were secured with other non-real estate collateral types • The remaining loans were collectively evaluated for reserves QTD highlights: • 3 commercial relationships downgraded to Classified totaling $10.5 million • Charge-offs totaling $5.9 million • Sale of CRE multifamily loan totaling $22 million and a single-family residential loan totaling $16.4 million with a $0.5 million and $0.3 million losses on sale, respectively • Paydown/payoffs totaling $14.3 million ($ in millions) Net changes include downgrades, charge-offs, paydowns, payoffs and loans sold
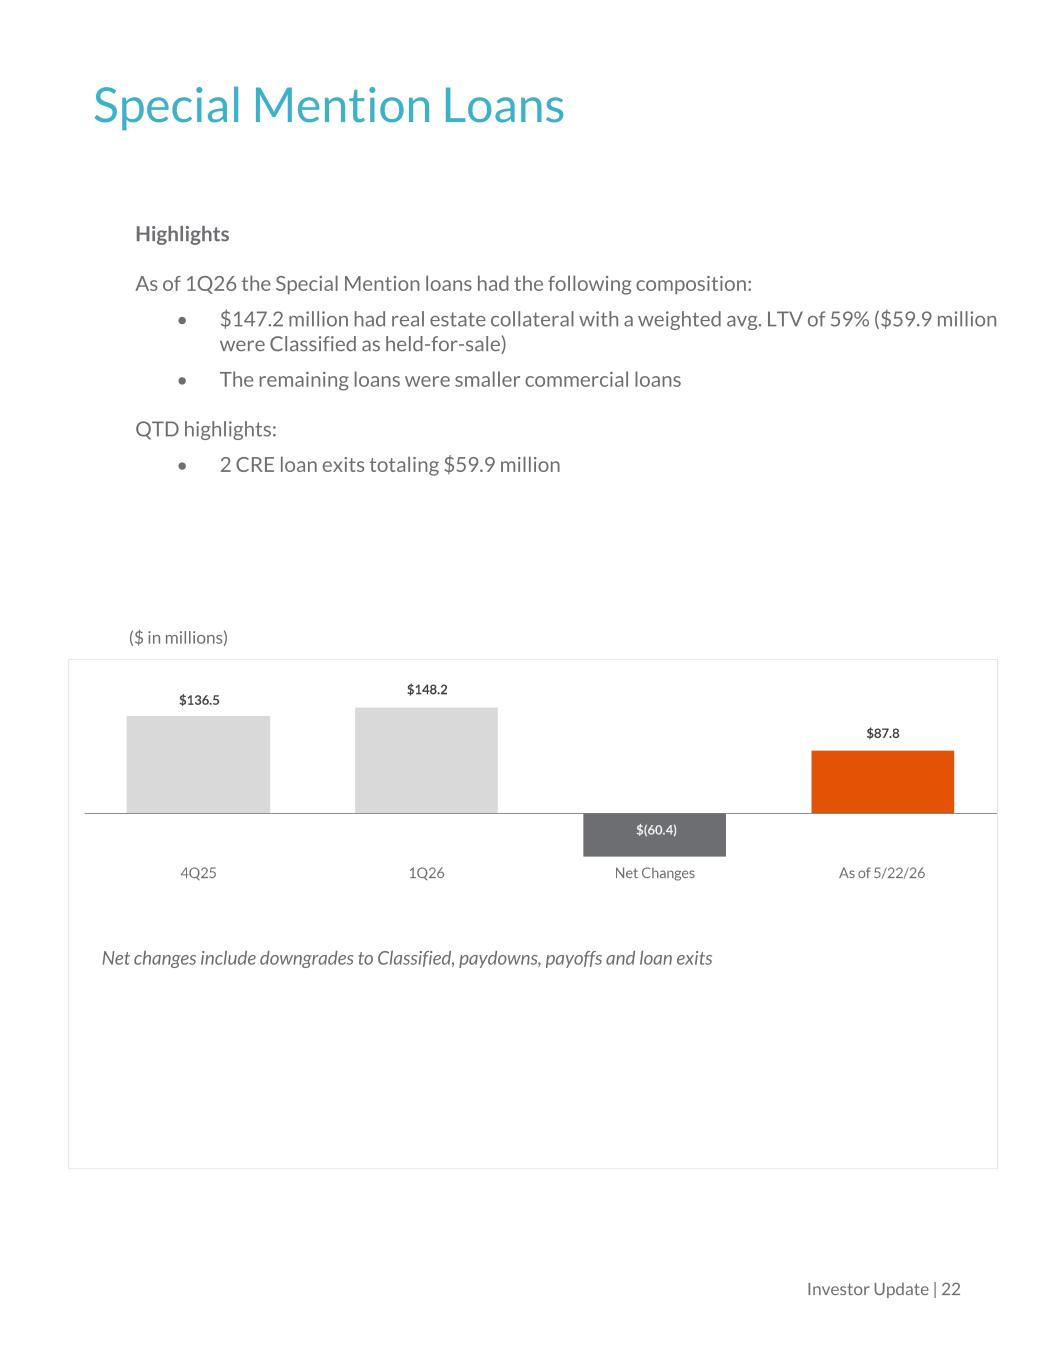
Special Mention Loans Investor Update | 22 Highlights As of 1Q26 the Special Mention loans had the following composition: • $147.2 million had real estate collateral with a weighted avg. LTV of 59% ($59.9 million were Classified as held-for-sale) • The remaining loans were smaller commercial loans QTD highlights: • 2 CRE loan exits totaling $59.9 million ($ in millions) $(54.1) Net changes include downgrades to Classified, paydowns, payoffs and loan exits
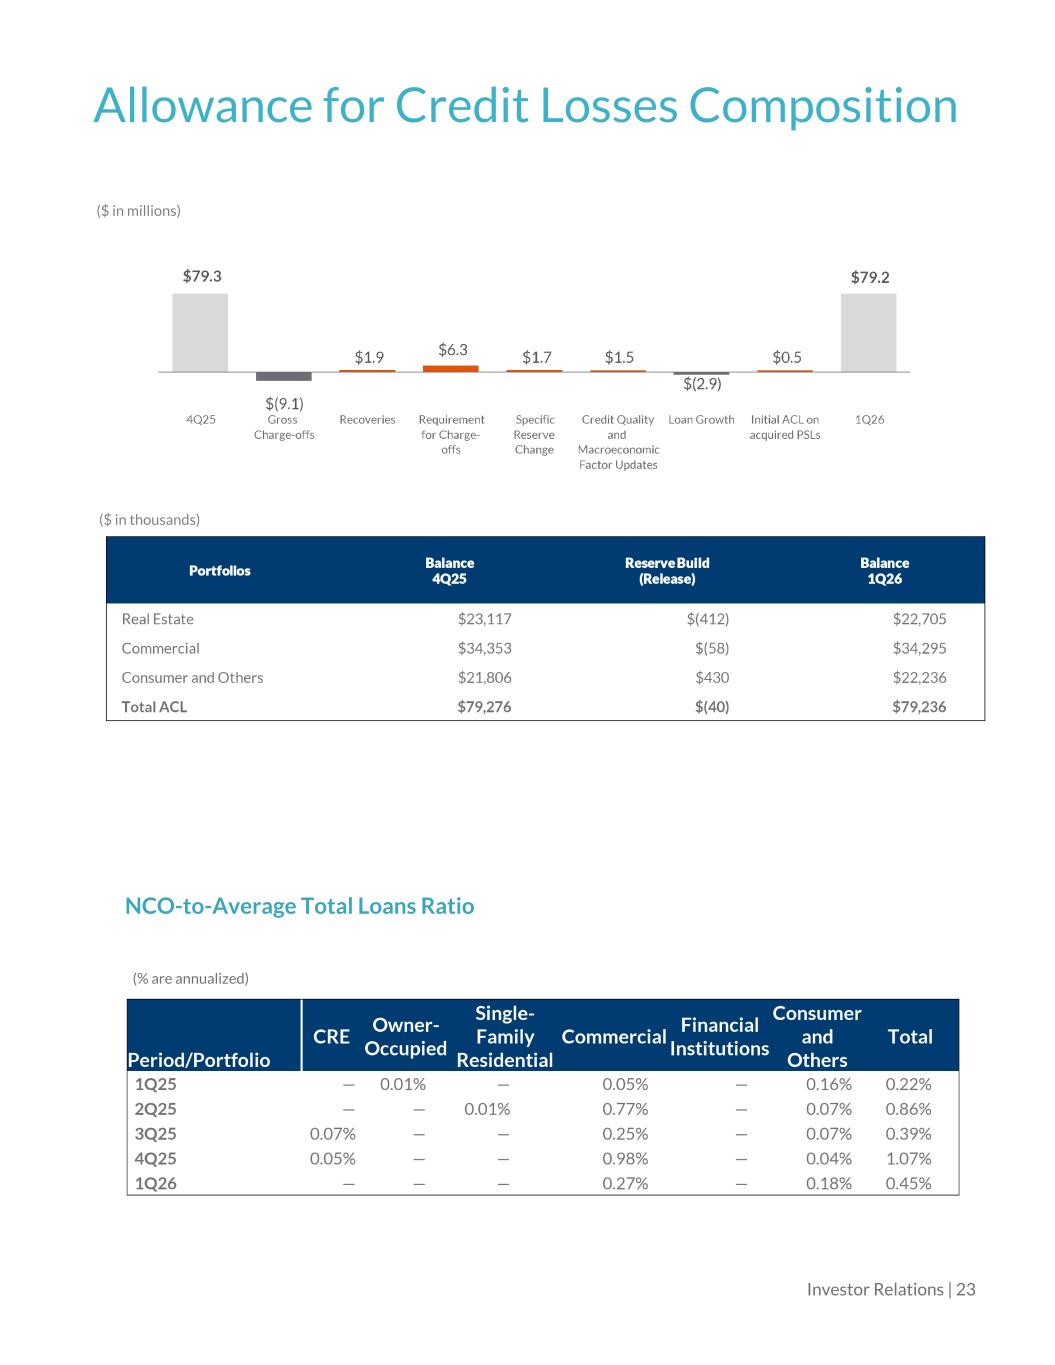
Allowance for Credit Losses Composition Investor Relations | 23 NCO-to-Average Total Loans Ratio (% are annualized) ($ in millions) ($ in thousands)
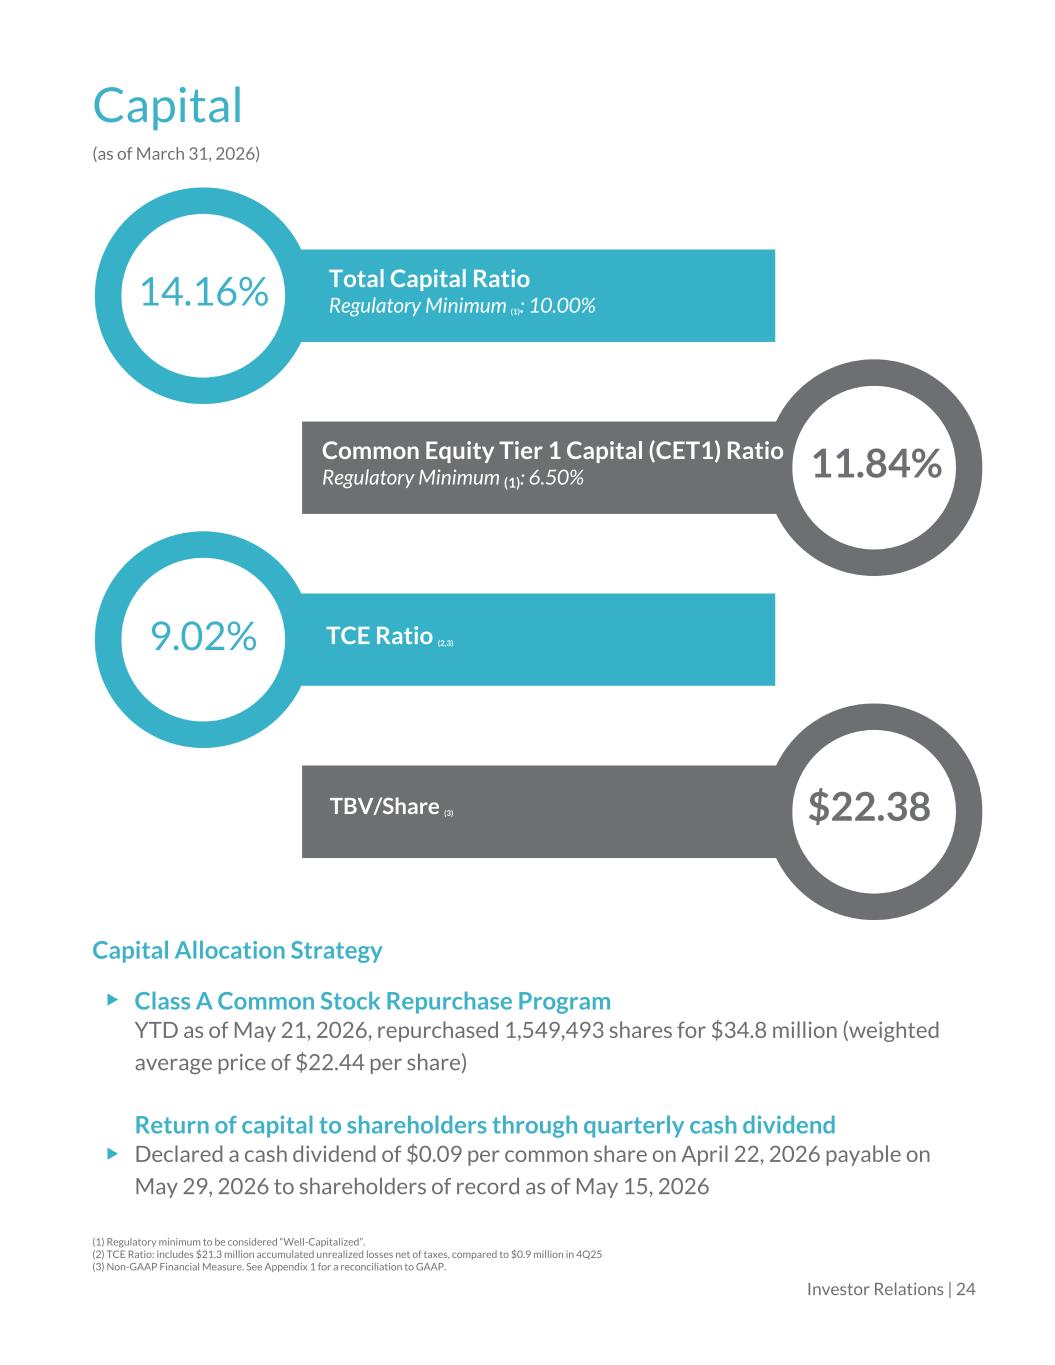
14.16% Total Capital Ratio Regulatory Minimum (1): 10.00% Common Equity Tier 1 Capital (CET1) Ratio Regulatory Minimum (1): 6.50% 11.84% 9.02% TCE Ratio (2,3) TBV/Share (3) $22.38 Capital (as of March 31, 2026) Capital Allocation Strategy Class A Common Stock Repurchase Program YTD as of May 21, 2026, repurchased 1,549,493 shares for $34.8 million (weighted average price of $22.44 per share) Return of capital to shareholders through quarterly cash dividend Declared a cash dividend of $0.09 per common share on April 22, 2026 payable on May 29, 2026 to shareholders of record as of May 15, 2026 (1) Regulatory minimum to be considered “Well-Capitalized”. (2) TCE Ratio: includes $21.3 million accumulated unrealized losses net of taxes, compared to $0.9 million in 4Q25 (3) Non-GAAP Financial Measure. See Appendix 1 for a reconciliation to GAAP. Investor Relations | 24
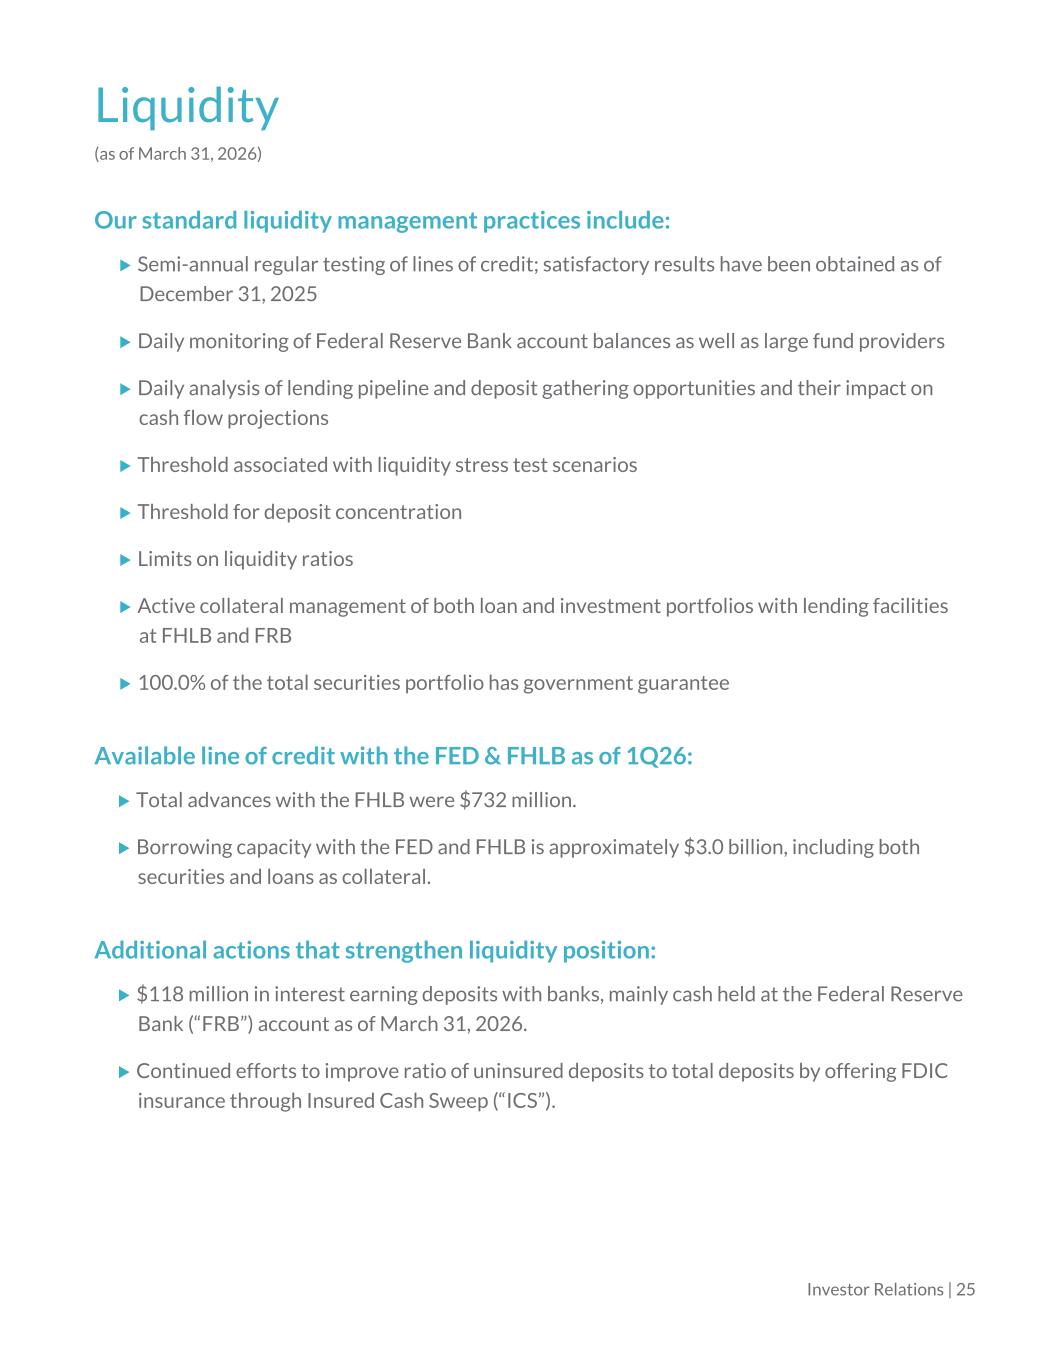
Liquidity (as of March 31, 2026) Our standard liquidity management practices include: Semi-annual regular testing of lines of credit; satisfactory results have been obtained as of December 31, 2025 Daily monitoring of Federal Reserve Bank account balances as well as large fund providers Daily analysis of lending pipeline and deposit gathering opportunities and their impact on cash flow projections Threshold associated with liquidity stress test scenarios Threshold for deposit concentration Limits on liquidity ratios Active collateral management of both loan and investment portfolios with lending facilities at FHLB and FRB 100.0% of the total securities portfolio has government guarantee Available line of credit with the FED & FHLB as of 1Q26: Total advances with the FHLB were $732 million. Borrowing capacity with the FED and FHLB is approximately $3.0 billion, including both securities and loans as collateral. Additional actions that strengthen liquidity position: $118 million in interest earning deposits with banks, mainly cash held at the Federal Reserve Bank (“FRB”) account as of March 31, 2026. Continued efforts to improve ratio of uninsured deposits to total deposits by offering FDIC insurance through Insured Cash Sweep (“ICS”). Investor Relations | 25

Supplemental Information Investor Update | 26
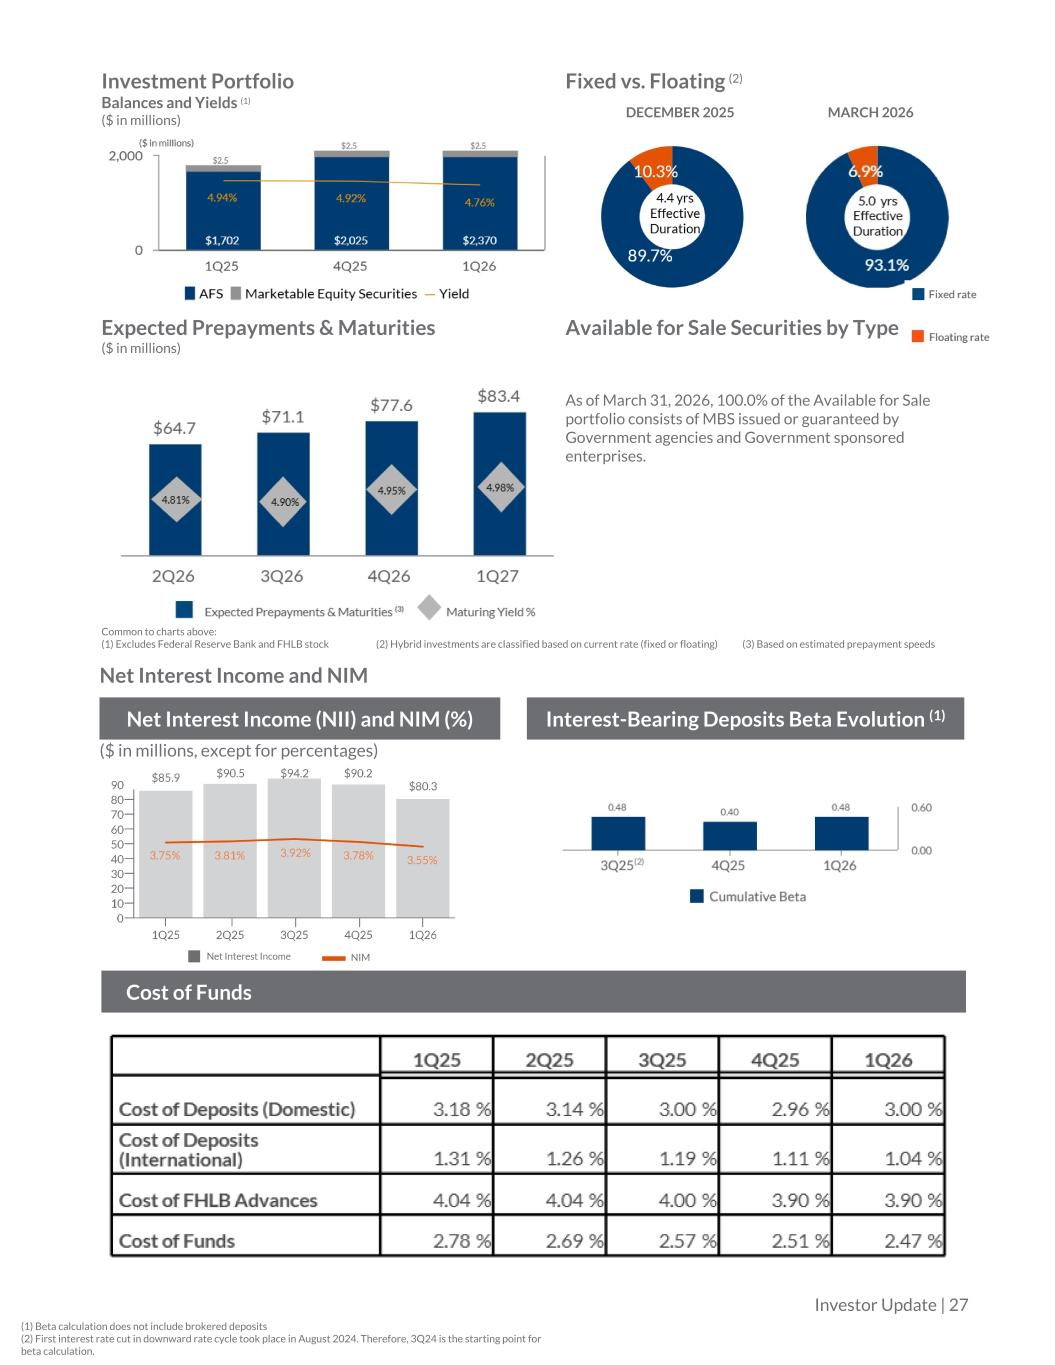
Investment Portfolio Balances and Yields (1) ($ in millions) Fixed vs. Floating (2) DECEMBER 2025 MARCH 2026 Expected Prepayments & Maturities ($ in millions) Available for Sale Securities by Type As of March 31, 2026, 100.0% of the Available for Sale portfolio consists of MBS issued or guaranteed by Government agencies and Government sponsored enterprises. Common to charts above: (1) Excludes Federal Reserve Bank and FHLB stock (2) Hybrid investments are classified based on current rate (fixed or floating) (3) Based on estimated prepayment speeds Net Interest Income and NIM Net Interest Income (NII) and NIM (%) Interest-Bearing Deposits Beta Evolution (1) ($ in millions, except for percentages) Cost of Funds (1) Beta calculation does not include brokered deposits (2) First interest rate cut in downward rate cycle took place in August 2024. Therefore, 3Q24 is the starting point for beta calculation. ances Cost of Funds Investor Update | 27
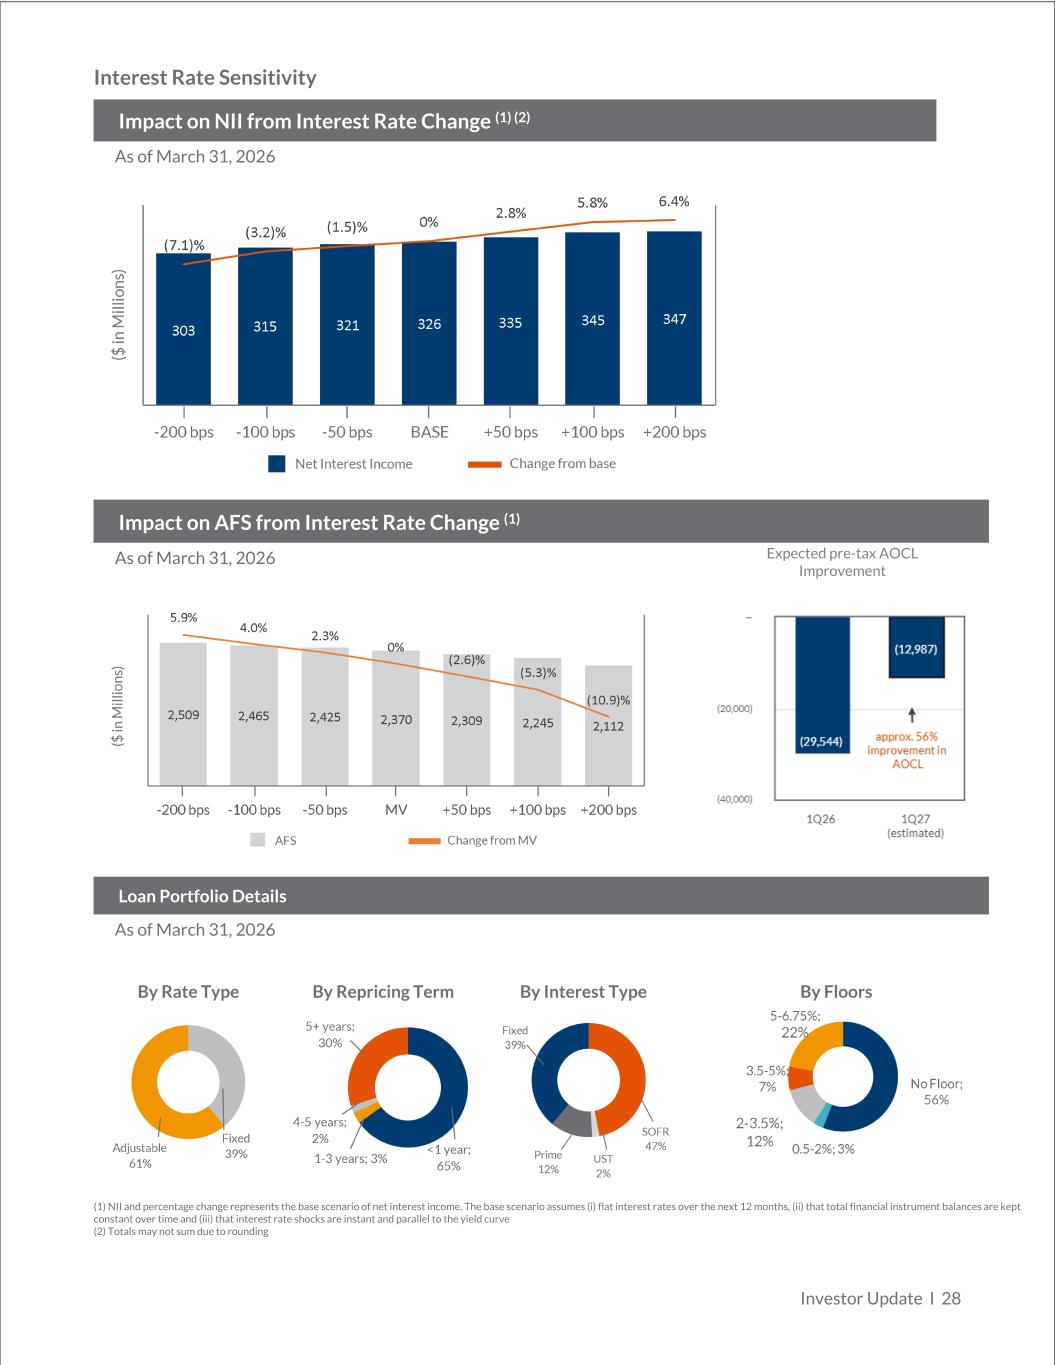
Interest Rate Sensitivity Impact on NII from Interest Rate Change (1) (2) As of March 31, 2026 Impact on AFS from Interest Rate Change (1) As of March 31, 2026 Loan Portfolio Details As of March 31, 2026 By Rate Type By Repricing Term By Interest Type By Floors (1) NII and percentage change represents the base scenario of net interest income. The base scenario assumes (i) flat interest rates over the next 12 months, (ii) that total financial instrument balances are kept constant over time and (iii) that interest rate shocks are instant and parallel to the yield curve (2) Totals may not sum due to rounding Investor Update I 28 Expected pre-tax AOCL Improvement
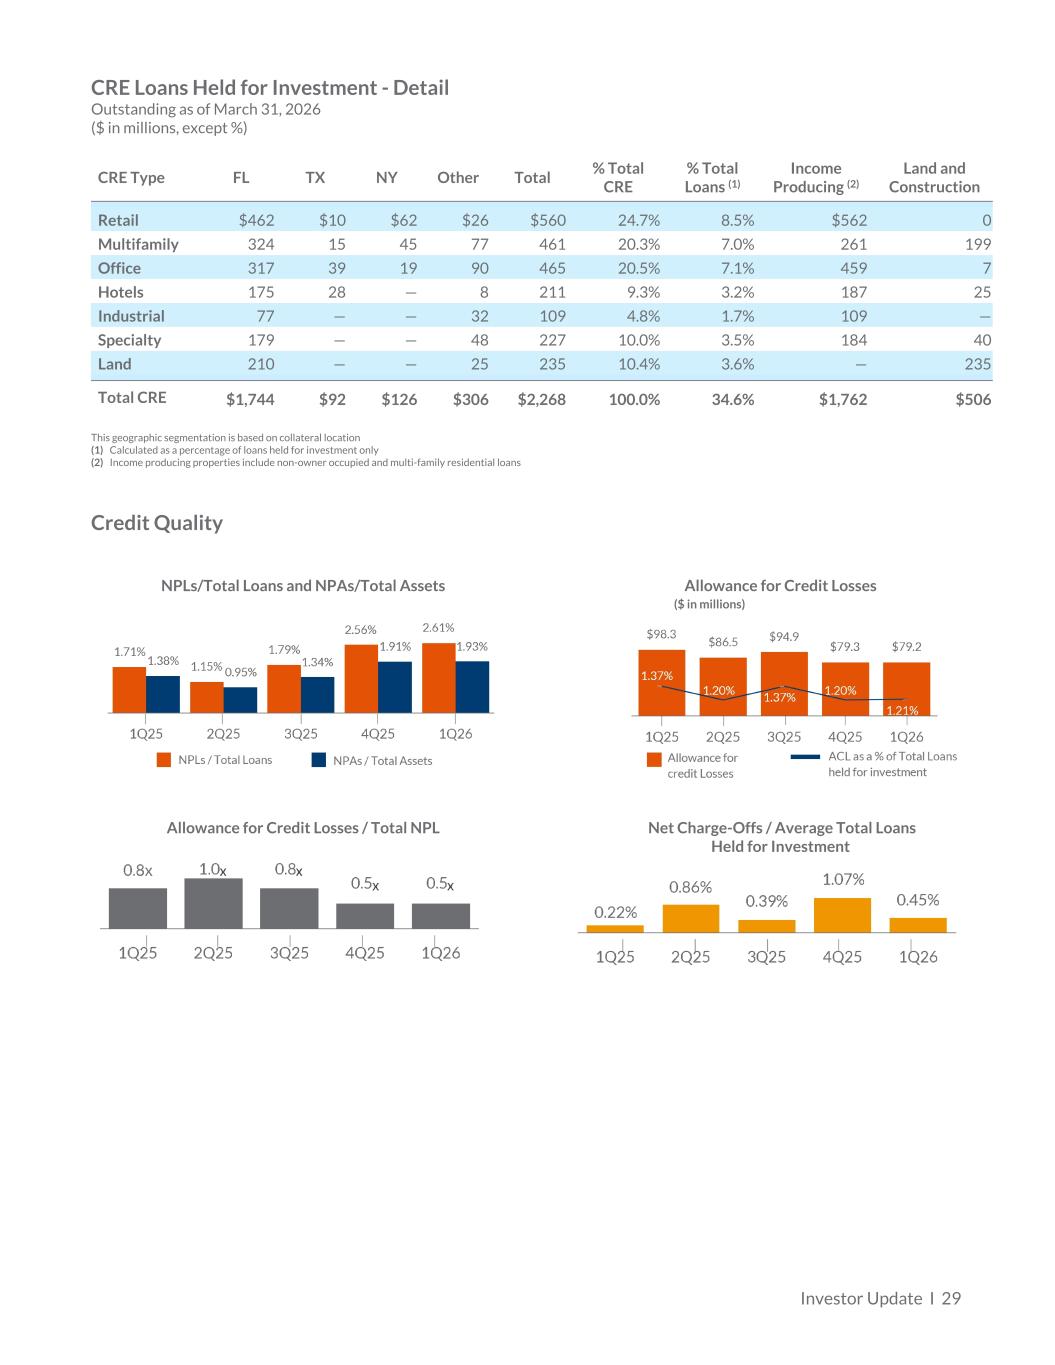
CRE Loans Held for Investment - Detail Outstanding as of March 31, 2026 ($ in millions, except %) CRE Type FL TX NY Other Total % Total CRE % Total Loans (1) Income Producing (2) Land and Construction Retail $462 $10 $62 $26 $560 24.7% 8.5% $562 0 Multifamily 324 15 45 77 461 20.3% 7.0% 261 199 Office 317 39 19 90 465 20.5% 7.1% 459 7 Hotels 175 28 — 8 211 9.3% 3.2% 187 25 Industrial 77 — — 32 109 4.8% 1.7% 109 — Specialty 179 — — 48 227 10.0% 3.5% 184 40 Land 210 — — 25 235 10.4% 3.6% — 235 Total CRE $1,744 $92 $126 $306 $2,268 100.0% 34.6% $1,762 $506 This geographic segmentation is based on collateral location (1) Calculated as a percentage of loans held for investment only (2) Income producing properties include non-owner occupied and multi-family residential loans Credit Quality Allowance for Credit LossesNPLs/Total Loans and NPAs/Total Assets ($ in millions) Allowance for Credit Losses / Total NPL Net Charge-Offs / Average Total Loans Held for Investment Investor Update I 29
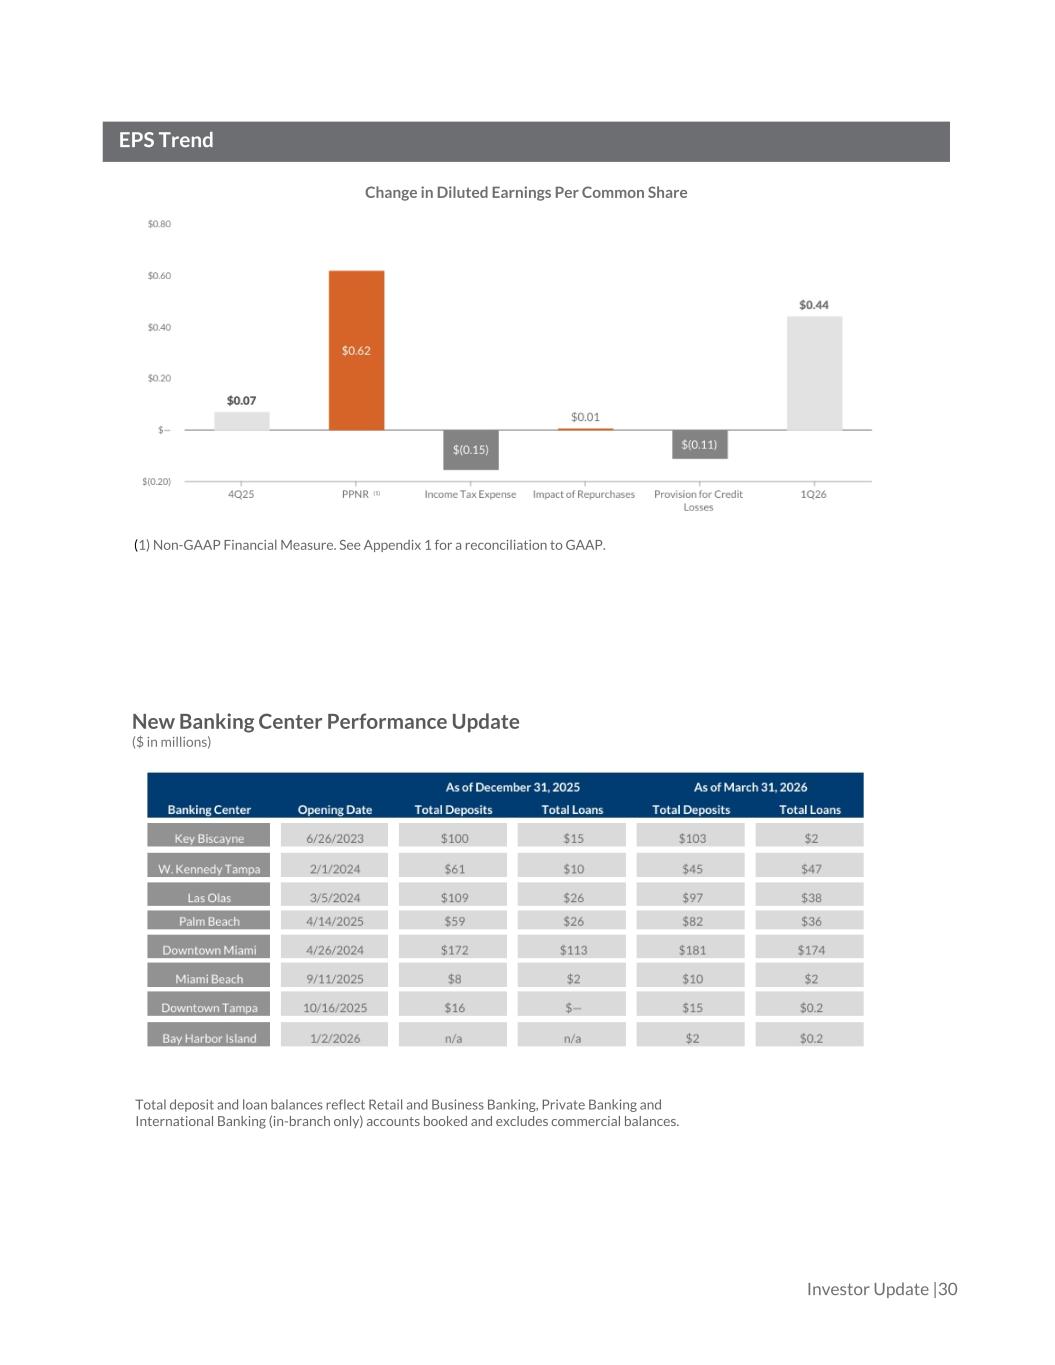
EPS Trend Change in Diluted Earnings Per Common Share Investor Update |30 (1) Non-GAAP Financial Measure. See Appendix 1 for a reconciliation to GAAP. New Banking Center Performance Update ($ in millions) Total deposit and loan balances reflect Retail and Business Banking, Private Banking and International Banking (in-branch only) accounts booked and excludes commercial balances.
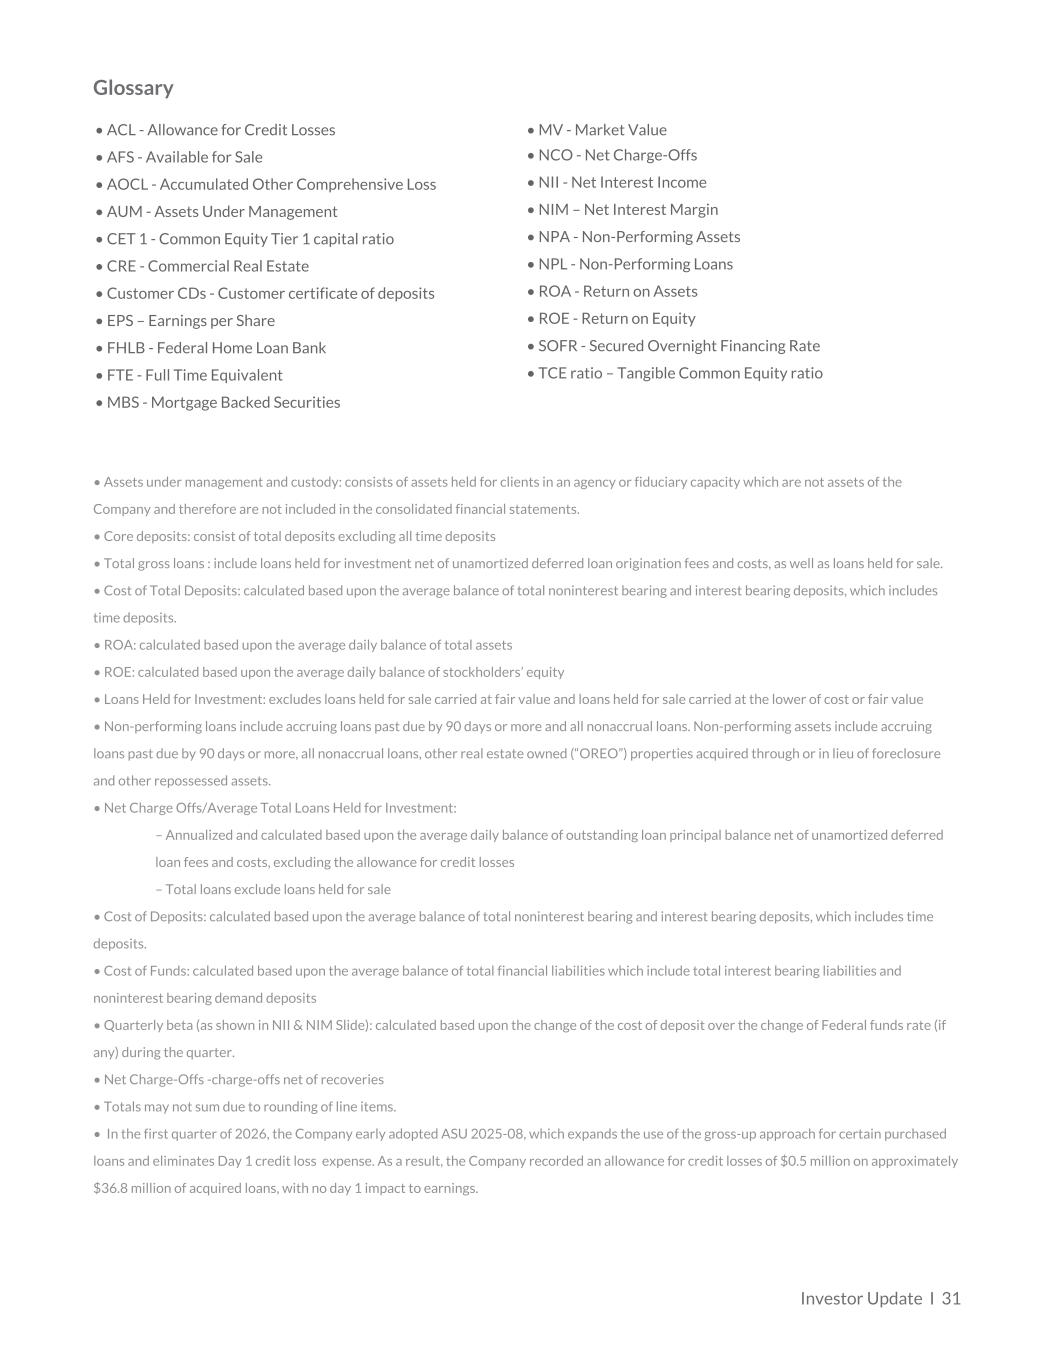
Glossary • ACL - Allowance for Credit Losses • MV - Market Value • AFS - Available for Sale • NCO - Net Charge-Offs • AOCL - Accumulated Other Comprehensive Loss • NII - Net Interest Income • AUM - Assets Under Management • NIM – Net Interest Margin • CET 1 - Common Equity Tier 1 capital ratio • NPA - Non-Performing Assets • CRE - Commercial Real Estate • NPL - Non-Performing Loans • Customer CDs - Customer certificate of deposits • ROA - Return on Assets • EPS – Earnings per Share • ROE - Return on Equity • FHLB - Federal Home Loan Bank • SOFR - Secured Overnight Financing Rate • FTE - Full Time Equivalent • TCE ratio – Tangible Common Equity ratio • MBS - Mortgage Backed Securities • Assets under management and custody: consists of assets held for clients in an agency or fiduciary capacity which are not assets of the Company and therefore are not included in the consolidated financial statements. • Core deposits: consist of total deposits excluding all time deposits • Total gross loans : include loans held for investment net of unamortized deferred loan origination fees and costs, as well as loans held for sale. • Cost of Total Deposits: calculated based upon the average balance of total noninterest bearing and interest bearing deposits, which includes time deposits. • ROA: calculated based upon the average daily balance of total assets • ROE: calculated based upon the average daily balance of stockholders’ equity • Loans Held for Investment: excludes loans held for sale carried at fair value and loans held for sale carried at the lower of cost or fair value • Non-performing loans include accruing loans past due by 90 days or more and all nonaccrual loans. Non-performing assets include accruing loans past due by 90 days or more, all nonaccrual loans, other real estate owned (“OREO”) properties acquired through or in lieu of foreclosure and other repossessed assets. • Net Charge Offs/Average Total Loans Held for Investment: – Annualized and calculated based upon the average daily balance of outstanding loan principal balance net of unamortized deferred loan fees and costs, excluding the allowance for credit losses – Total loans exclude loans held for sale • Cost of Deposits: calculated based upon the average balance of total noninterest bearing and interest bearing deposits, which includes time deposits. • Cost of Funds: calculated based upon the average balance of total financial liabilities which include total interest bearing liabilities and noninterest bearing demand deposits • Quarterly beta (as shown in NII & NIM Slide): calculated based upon the change of the cost of deposit over the change of Federal funds rate (if any) during the quarter. • Net Charge-Offs -charge-offs net of recoveries • Totals may not sum due to rounding of line items. • In the first quarter of 2026, the Company early adopted ASU 2025-08, which expands the use of the gross-up approach for certain purchased loans and eliminates Day 1 credit loss expense. As a result, the Company recorded an allowance for credit losses of $0.5 million on approximately $36.8 million of acquired loans, with no day 1 impact to earnings. Investor Update I 31

Appendix Investor Update | 32
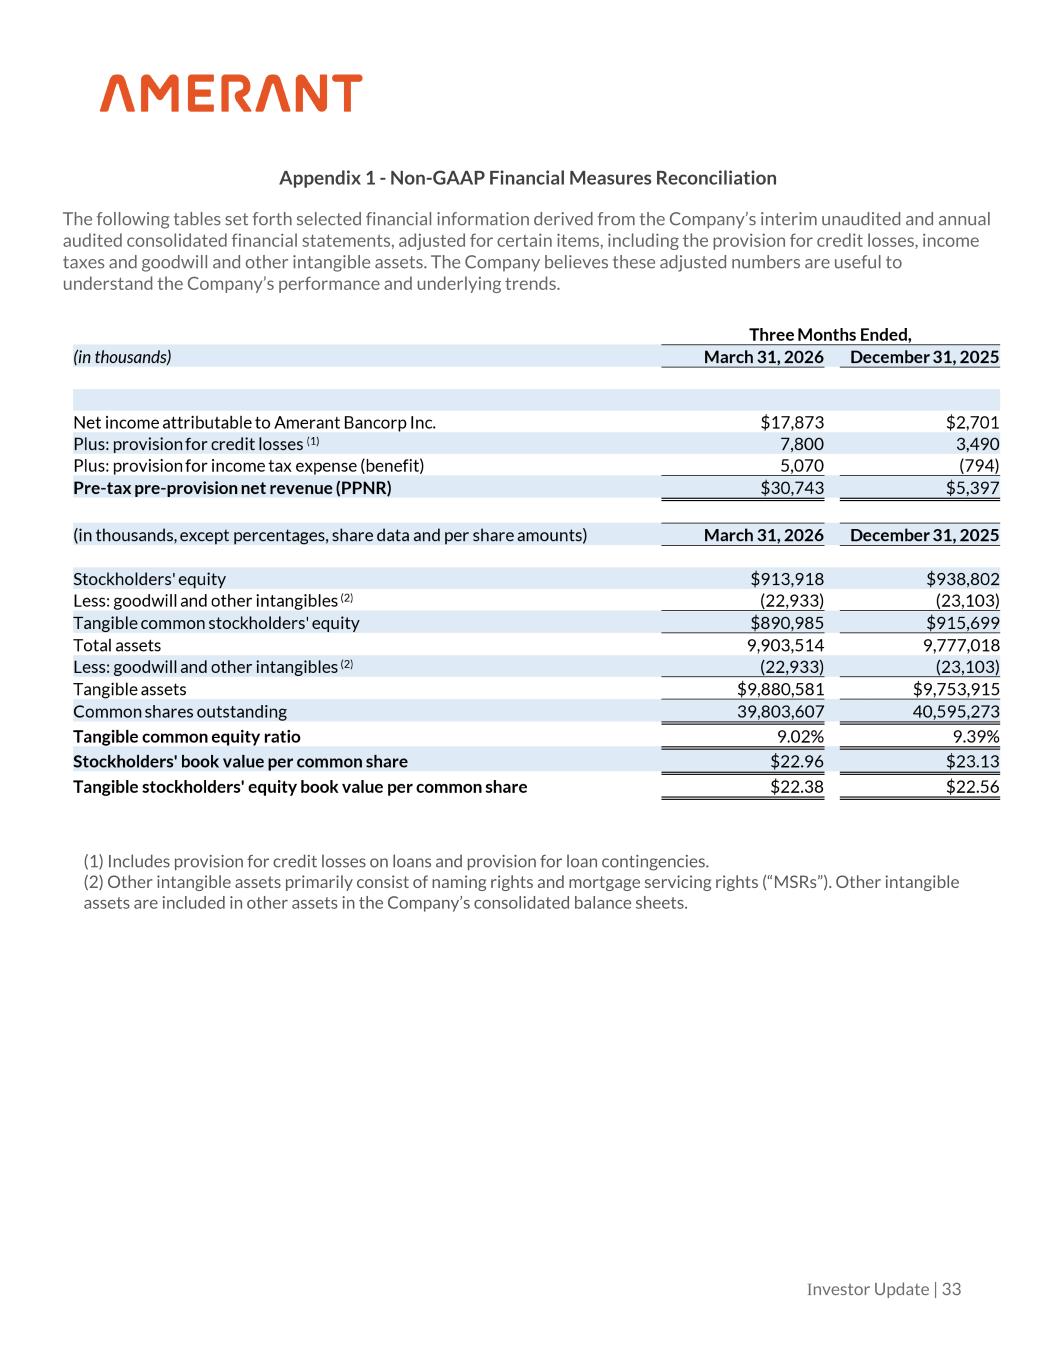
Appendix 1 - Non-GAAP Financial Measures Reconciliation The following tables set forth selected financial information derived from the Company’s interim unaudited and annual audited consolidated financial statements, adjusted for certain items, including the provision for credit losses, income taxes and goodwill and other intangible assets. The Company believes these adjusted numbers are useful to understand the Company’s performance and underlying trends. Investor Update | 33 (1) Includes provision for credit losses on loans and provision for loan contingencies. (2) Other intangible assets primarily consist of naming rights and mortgage servicing rights (“MSRs”). Other intangible assets are included in other assets in the Company’s consolidated balance sheets.

Thank You NYSE: AMTB